Chickasaw vs Immigrants from Turkey Poverty
COMPARE
Chickasaw
Immigrants from Turkey
Poverty
Poverty Comparison
Chickasaw
Immigrants from Turkey
14.7%
POVERTY
0.0/ 100
METRIC RATING
272nd/ 347
METRIC RANK
11.6%
POVERTY
91.7/ 100
METRIC RATING
109th/ 347
METRIC RANK
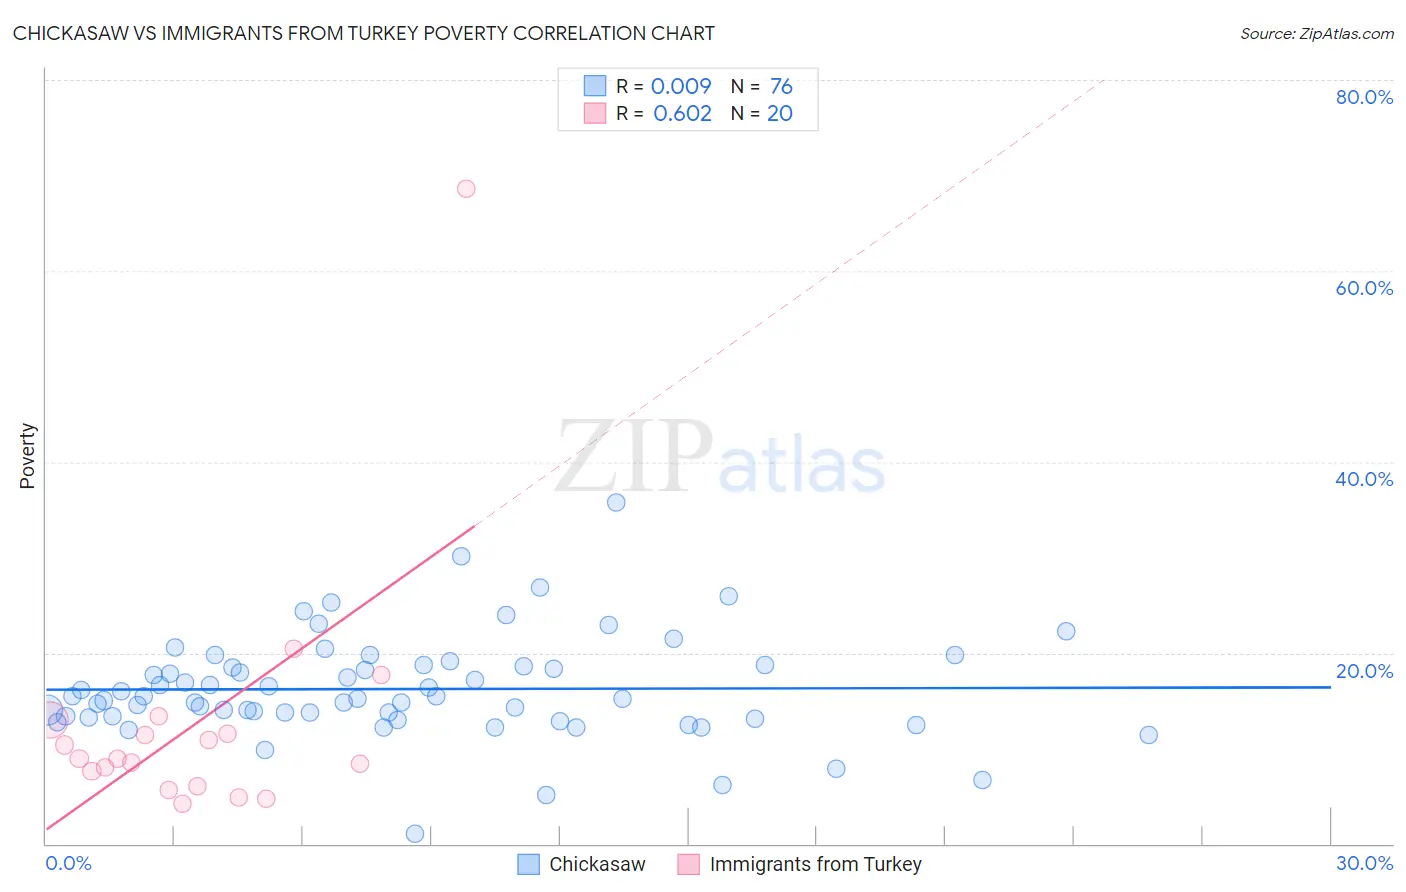
Chickasaw vs Immigrants from Turkey Poverty Correlation Chart
The statistical analysis conducted on geographies consisting of 147,672,043 people shows no correlation between the proportion of Chickasaw and poverty level in the United States with a correlation coefficient (R) of 0.009 and weighted average of 14.7%. Similarly, the statistical analysis conducted on geographies consisting of 222,977,543 people shows a significant positive correlation between the proportion of Immigrants from Turkey and poverty level in the United States with a correlation coefficient (R) of 0.602 and weighted average of 11.6%, a difference of 26.4%.
Poverty Correlation Summary
| Measurement | Chickasaw | Immigrants from Turkey |
| Minimum | 0.99% | 4.2% |
| Maximum | 35.7% | 68.6% |
| Range | 34.7% | 64.4% |
| Mean | 16.2% | 12.6% |
| Median | 15.3% | 8.9% |
| Interquartile 25% (IQ1) | 13.3% | 6.8% |
| Interquartile 75% (IQ3) | 18.7% | 12.3% |
| Interquartile Range (IQR) | 5.4% | 5.4% |
| Standard Deviation (Sample) | 5.4% | 13.8% |
| Standard Deviation (Population) | 5.4% | 13.5% |
Similar Demographics by Poverty
Demographics Similar to Chickasaw by Poverty
In terms of poverty, the demographic groups most similar to Chickasaw are Shoshone (14.7%, a difference of 0.040%), Spanish American (14.7%, a difference of 0.53%), Central American (14.6%, a difference of 0.63%), Immigrants from Cuba (14.6%, a difference of 0.77%), and Subsaharan African (14.5%, a difference of 0.92%).
| Demographics | Rating | Rank | Poverty |
| Immigrants | Guyana | 0.1 /100 | #265 | Tragic 14.5% |
| Guyanese | 0.1 /100 | #266 | Tragic 14.5% |
| Iroquois | 0.1 /100 | #267 | Tragic 14.5% |
| Sub-Saharan Africans | 0.1 /100 | #268 | Tragic 14.5% |
| Immigrants | Cuba | 0.1 /100 | #269 | Tragic 14.6% |
| Central Americans | 0.1 /100 | #270 | Tragic 14.6% |
| Shoshone | 0.0 /100 | #271 | Tragic 14.7% |
| Chickasaw | 0.0 /100 | #272 | Tragic 14.7% |
| Spanish Americans | 0.0 /100 | #273 | Tragic 14.7% |
| Barbadians | 0.0 /100 | #274 | Tragic 14.8% |
| Immigrants | West Indies | 0.0 /100 | #275 | Tragic 14.8% |
| Immigrants | Bahamas | 0.0 /100 | #276 | Tragic 14.8% |
| Bangladeshis | 0.0 /100 | #277 | Tragic 14.8% |
| Belizeans | 0.0 /100 | #278 | Tragic 14.8% |
| Immigrants | St. Vincent and the Grenadines | 0.0 /100 | #279 | Tragic 14.9% |
Demographics Similar to Immigrants from Turkey by Poverty
In terms of poverty, the demographic groups most similar to Immigrants from Turkey are Canadian (11.6%, a difference of 0.010%), Welsh (11.6%, a difference of 0.040%), Palestinian (11.6%, a difference of 0.050%), Portuguese (11.6%, a difference of 0.14%), and Immigrants from Zimbabwe (11.6%, a difference of 0.14%).
| Demographics | Rating | Rank | Poverty |
| Laotians | 92.4 /100 | #102 | Exceptional 11.6% |
| Okinawans | 92.4 /100 | #103 | Exceptional 11.6% |
| Native Hawaiians | 92.1 /100 | #104 | Exceptional 11.6% |
| Portuguese | 92.1 /100 | #105 | Exceptional 11.6% |
| Immigrants | Zimbabwe | 92.1 /100 | #106 | Exceptional 11.6% |
| Palestinians | 91.8 /100 | #107 | Exceptional 11.6% |
| Canadians | 91.7 /100 | #108 | Exceptional 11.6% |
| Immigrants | Turkey | 91.7 /100 | #109 | Exceptional 11.6% |
| Welsh | 91.6 /100 | #110 | Exceptional 11.6% |
| French Canadians | 91.0 /100 | #111 | Exceptional 11.6% |
| Immigrants | Southern Europe | 90.8 /100 | #112 | Exceptional 11.6% |
| Immigrants | Belarus | 90.8 /100 | #113 | Exceptional 11.6% |
| Immigrants | China | 90.7 /100 | #114 | Exceptional 11.6% |
| Albanians | 90.3 /100 | #115 | Exceptional 11.7% |
| Immigrants | Russia | 89.7 /100 | #116 | Excellent 11.7% |