Chickasaw vs Hopi Unemployment Among Ages 55 to 59 years
COMPARE
Chickasaw
Hopi
Unemployment Among Ages 55 to 59 years
Unemployment Among Ages 55 to 59 years Comparison
Chickasaw
Hopi
4.8%
UNEMPLOYMENT AMONG AGES 55 TO 59 YEARS
65.1/ 100
METRIC RATING
160th/ 347
METRIC RANK
8.1%
UNEMPLOYMENT AMONG AGES 55 TO 59 YEARS
0.0/ 100
METRIC RATING
342nd/ 347
METRIC RANK
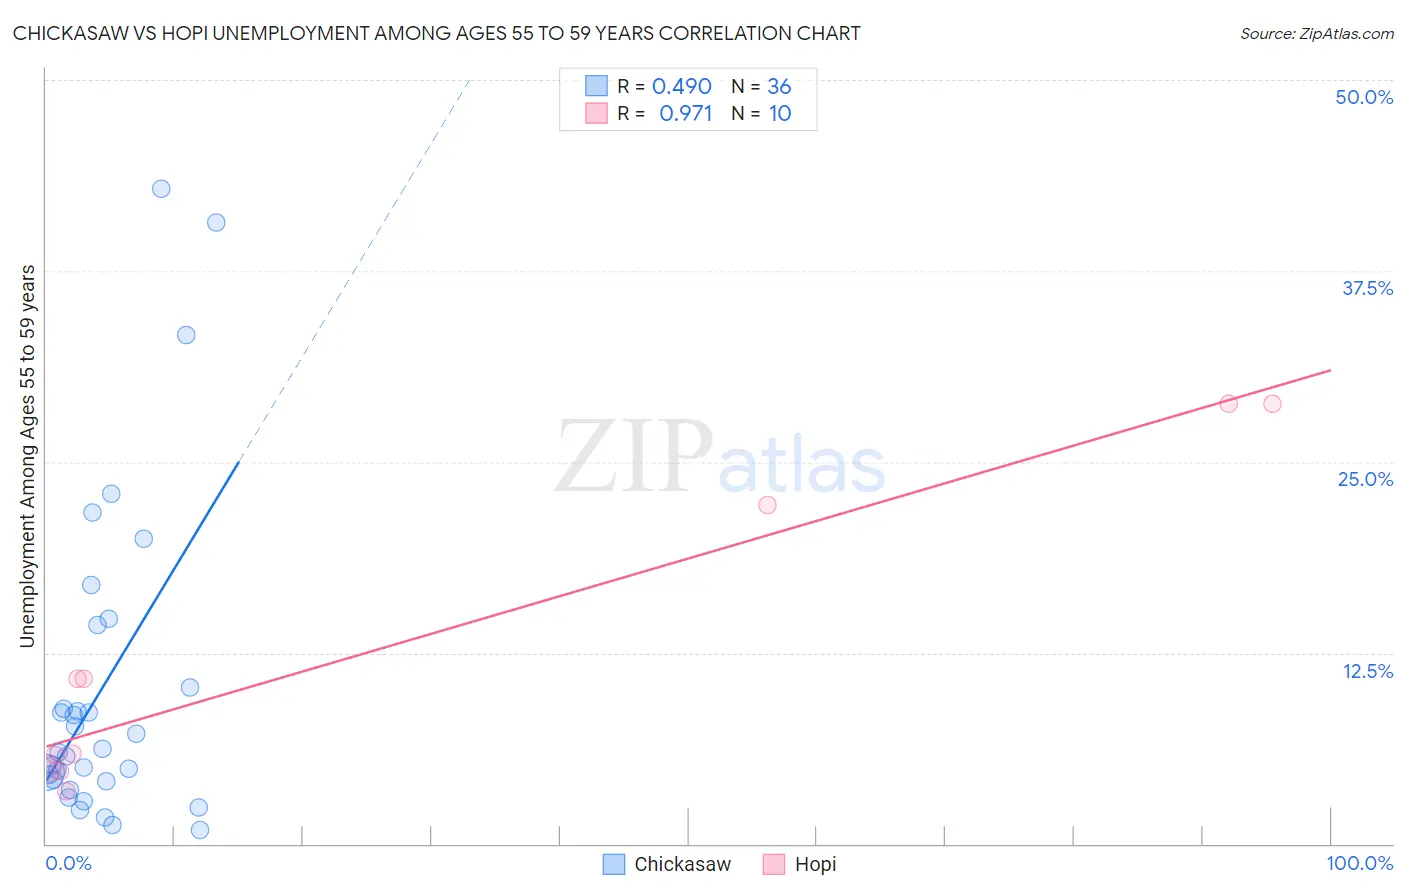
Chickasaw vs Hopi Unemployment Among Ages 55 to 59 years Correlation Chart
The statistical analysis conducted on geographies consisting of 141,352,588 people shows a moderate positive correlation between the proportion of Chickasaw and unemployment rate among population between the ages 55 and 59 in the United States with a correlation coefficient (R) of 0.490 and weighted average of 4.8%. Similarly, the statistical analysis conducted on geographies consisting of 73,356,460 people shows a perfect positive correlation between the proportion of Hopi and unemployment rate among population between the ages 55 and 59 in the United States with a correlation coefficient (R) of 0.971 and weighted average of 8.1%, a difference of 69.6%.
Unemployment Among Ages 55 to 59 years Correlation Summary
| Measurement | Chickasaw | Hopi |
| Minimum | 0.90% | 3.5% |
| Maximum | 42.9% | 28.8% |
| Range | 42.0% | 25.3% |
| Mean | 10.2% | 12.6% |
| Median | 6.1% | 8.3% |
| Interquartile 25% (IQ1) | 4.2% | 4.9% |
| Interquartile 75% (IQ3) | 12.2% | 22.2% |
| Interquartile Range (IQR) | 8.1% | 17.3% |
| Standard Deviation (Sample) | 10.5% | 10.1% |
| Standard Deviation (Population) | 10.3% | 9.6% |
Similar Demographics by Unemployment Among Ages 55 to 59 years
Demographics Similar to Chickasaw by Unemployment Among Ages 55 to 59 years
In terms of unemployment among ages 55 to 59 years, the demographic groups most similar to Chickasaw are Immigrants from Nicaragua (4.8%, a difference of 0.0%), Slovak (4.8%, a difference of 0.010%), Korean (4.8%, a difference of 0.020%), Carpatho Rusyn (4.8%, a difference of 0.040%), and Immigrants from Africa (4.8%, a difference of 0.040%).
| Demographics | Rating | Rank | Unemployment Among Ages 55 to 59 years |
| Immigrants | Uruguay | 67.2 /100 | #153 | Good 4.8% |
| Immigrants | Panama | 66.8 /100 | #154 | Good 4.8% |
| Immigrants | North Macedonia | 66.3 /100 | #155 | Good 4.8% |
| Italians | 66.2 /100 | #156 | Good 4.8% |
| Carpatho Rusyns | 66.0 /100 | #157 | Good 4.8% |
| Slovaks | 65.3 /100 | #158 | Good 4.8% |
| Immigrants | Nicaragua | 65.2 /100 | #159 | Good 4.8% |
| Chickasaw | 65.1 /100 | #160 | Good 4.8% |
| Koreans | 64.6 /100 | #161 | Good 4.8% |
| Immigrants | Africa | 64.2 /100 | #162 | Good 4.8% |
| Immigrants | Lebanon | 63.8 /100 | #163 | Good 4.8% |
| Americans | 63.3 /100 | #164 | Good 4.8% |
| Immigrants | France | 62.0 /100 | #165 | Good 4.8% |
| Potawatomi | 62.0 /100 | #166 | Good 4.8% |
| Immigrants | Western Europe | 60.4 /100 | #167 | Good 4.8% |
Demographics Similar to Hopi by Unemployment Among Ages 55 to 59 years
In terms of unemployment among ages 55 to 59 years, the demographic groups most similar to Hopi are Yakama (8.9%, a difference of 10.0%), Shoshone (7.4%, a difference of 10.1%), Inupiat (9.0%, a difference of 11.3%), Alaskan Athabascan (7.1%, a difference of 13.8%), and Tohono O'odham (9.3%, a difference of 14.7%).
| Demographics | Rating | Rank | Unemployment Among Ages 55 to 59 years |
| Pima | 0.0 /100 | #333 | Tragic 6.6% |
| Pueblo | 0.0 /100 | #334 | Tragic 6.7% |
| Colville | 0.0 /100 | #335 | Tragic 6.7% |
| Navajo | 0.0 /100 | #336 | Tragic 6.7% |
| Paiute | 0.0 /100 | #337 | Tragic 6.8% |
| Immigrants | Yemen | 0.0 /100 | #338 | Tragic 6.9% |
| Puerto Ricans | 0.0 /100 | #339 | Tragic 7.0% |
| Alaskan Athabascans | 0.0 /100 | #340 | Tragic 7.1% |
| Shoshone | 0.0 /100 | #341 | Tragic 7.4% |
| Hopi | 0.0 /100 | #342 | Tragic 8.1% |
| Yakama | 0.0 /100 | #343 | Tragic 8.9% |
| Inupiat | 0.0 /100 | #344 | Tragic 9.0% |
| Tohono O'odham | 0.0 /100 | #345 | Tragic 9.3% |
| Menominee | 0.0 /100 | #346 | Tragic 10.5% |
| Yup'ik | 0.0 /100 | #347 | Tragic 13.9% |