Chickasaw vs Immigrants from Ethiopia Poverty
COMPARE
Chickasaw
Immigrants from Ethiopia
Poverty
Poverty Comparison
Chickasaw
Immigrants from Ethiopia
14.7%
POVERTY
0.0/ 100
METRIC RATING
272nd/ 347
METRIC RANK
12.2%
POVERTY
58.6/ 100
METRIC RATING
163rd/ 347
METRIC RANK
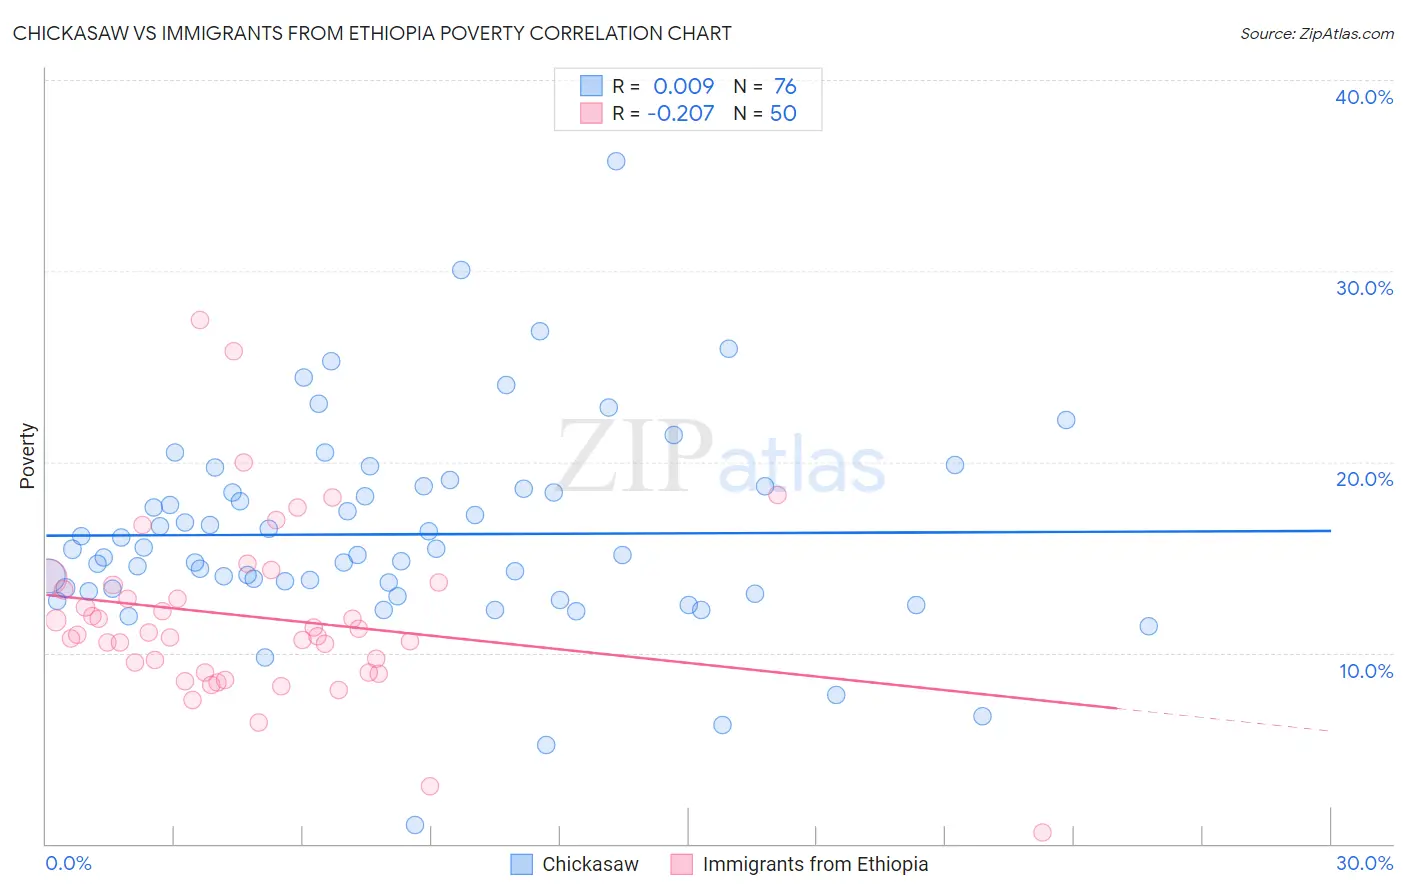
Chickasaw vs Immigrants from Ethiopia Poverty Correlation Chart
The statistical analysis conducted on geographies consisting of 147,672,043 people shows no correlation between the proportion of Chickasaw and poverty level in the United States with a correlation coefficient (R) of 0.009 and weighted average of 14.7%. Similarly, the statistical analysis conducted on geographies consisting of 211,460,176 people shows a weak negative correlation between the proportion of Immigrants from Ethiopia and poverty level in the United States with a correlation coefficient (R) of -0.207 and weighted average of 12.2%, a difference of 20.1%.
Poverty Correlation Summary
| Measurement | Chickasaw | Immigrants from Ethiopia |
| Minimum | 0.99% | 0.57% |
| Maximum | 35.7% | 27.5% |
| Range | 34.7% | 26.9% |
| Mean | 16.2% | 11.9% |
| Median | 15.3% | 11.0% |
| Interquartile 25% (IQ1) | 13.3% | 9.0% |
| Interquartile 75% (IQ3) | 18.7% | 13.6% |
| Interquartile Range (IQR) | 5.4% | 4.6% |
| Standard Deviation (Sample) | 5.4% | 4.7% |
| Standard Deviation (Population) | 5.4% | 4.6% |
Similar Demographics by Poverty
Demographics Similar to Chickasaw by Poverty
In terms of poverty, the demographic groups most similar to Chickasaw are Shoshone (14.7%, a difference of 0.040%), Spanish American (14.7%, a difference of 0.53%), Central American (14.6%, a difference of 0.63%), Immigrants from Cuba (14.6%, a difference of 0.77%), and Subsaharan African (14.5%, a difference of 0.92%).
| Demographics | Rating | Rank | Poverty |
| Immigrants | Guyana | 0.1 /100 | #265 | Tragic 14.5% |
| Guyanese | 0.1 /100 | #266 | Tragic 14.5% |
| Iroquois | 0.1 /100 | #267 | Tragic 14.5% |
| Sub-Saharan Africans | 0.1 /100 | #268 | Tragic 14.5% |
| Immigrants | Cuba | 0.1 /100 | #269 | Tragic 14.6% |
| Central Americans | 0.1 /100 | #270 | Tragic 14.6% |
| Shoshone | 0.0 /100 | #271 | Tragic 14.7% |
| Chickasaw | 0.0 /100 | #272 | Tragic 14.7% |
| Spanish Americans | 0.0 /100 | #273 | Tragic 14.7% |
| Barbadians | 0.0 /100 | #274 | Tragic 14.8% |
| Immigrants | West Indies | 0.0 /100 | #275 | Tragic 14.8% |
| Immigrants | Bahamas | 0.0 /100 | #276 | Tragic 14.8% |
| Bangladeshis | 0.0 /100 | #277 | Tragic 14.8% |
| Belizeans | 0.0 /100 | #278 | Tragic 14.8% |
| Immigrants | St. Vincent and the Grenadines | 0.0 /100 | #279 | Tragic 14.9% |
Demographics Similar to Immigrants from Ethiopia by Poverty
In terms of poverty, the demographic groups most similar to Immigrants from Ethiopia are Ethiopian (12.2%, a difference of 0.050%), Immigrants from Fiji (12.2%, a difference of 0.060%), Colombian (12.2%, a difference of 0.070%), Immigrants from Albania (12.2%, a difference of 0.080%), and Venezuelan (12.2%, a difference of 0.17%).
| Demographics | Rating | Rank | Poverty |
| Scotch-Irish | 62.6 /100 | #156 | Good 12.2% |
| Costa Ricans | 62.2 /100 | #157 | Good 12.2% |
| Taiwanese | 61.8 /100 | #158 | Good 12.2% |
| Pennsylvania Germans | 60.8 /100 | #159 | Good 12.2% |
| Immigrants | Nepal | 60.4 /100 | #160 | Good 12.2% |
| Immigrants | Fiji | 59.1 /100 | #161 | Average 12.2% |
| Ethiopians | 59.1 /100 | #162 | Average 12.2% |
| Immigrants | Ethiopia | 58.6 /100 | #163 | Average 12.2% |
| Colombians | 57.8 /100 | #164 | Average 12.2% |
| Immigrants | Albania | 57.7 /100 | #165 | Average 12.2% |
| Venezuelans | 56.9 /100 | #166 | Average 12.2% |
| Immigrants | Chile | 56.7 /100 | #167 | Average 12.2% |
| Immigrants | Venezuela | 56.5 /100 | #168 | Average 12.2% |
| Whites/Caucasians | 55.4 /100 | #169 | Average 12.3% |
| Immigrants | Oceania | 54.6 /100 | #170 | Average 12.3% |