Immigrants from South Central Asia vs Hopi Poverty
COMPARE
Immigrants from South Central Asia
Hopi
Poverty
Poverty Comparison
Immigrants from South Central Asia
Hopi
10.2%
POVERTY
99.9/ 100
METRIC RATING
9th/ 347
METRIC RANK
20.8%
POVERTY
0.0/ 100
METRIC RATING
341st/ 347
METRIC RANK
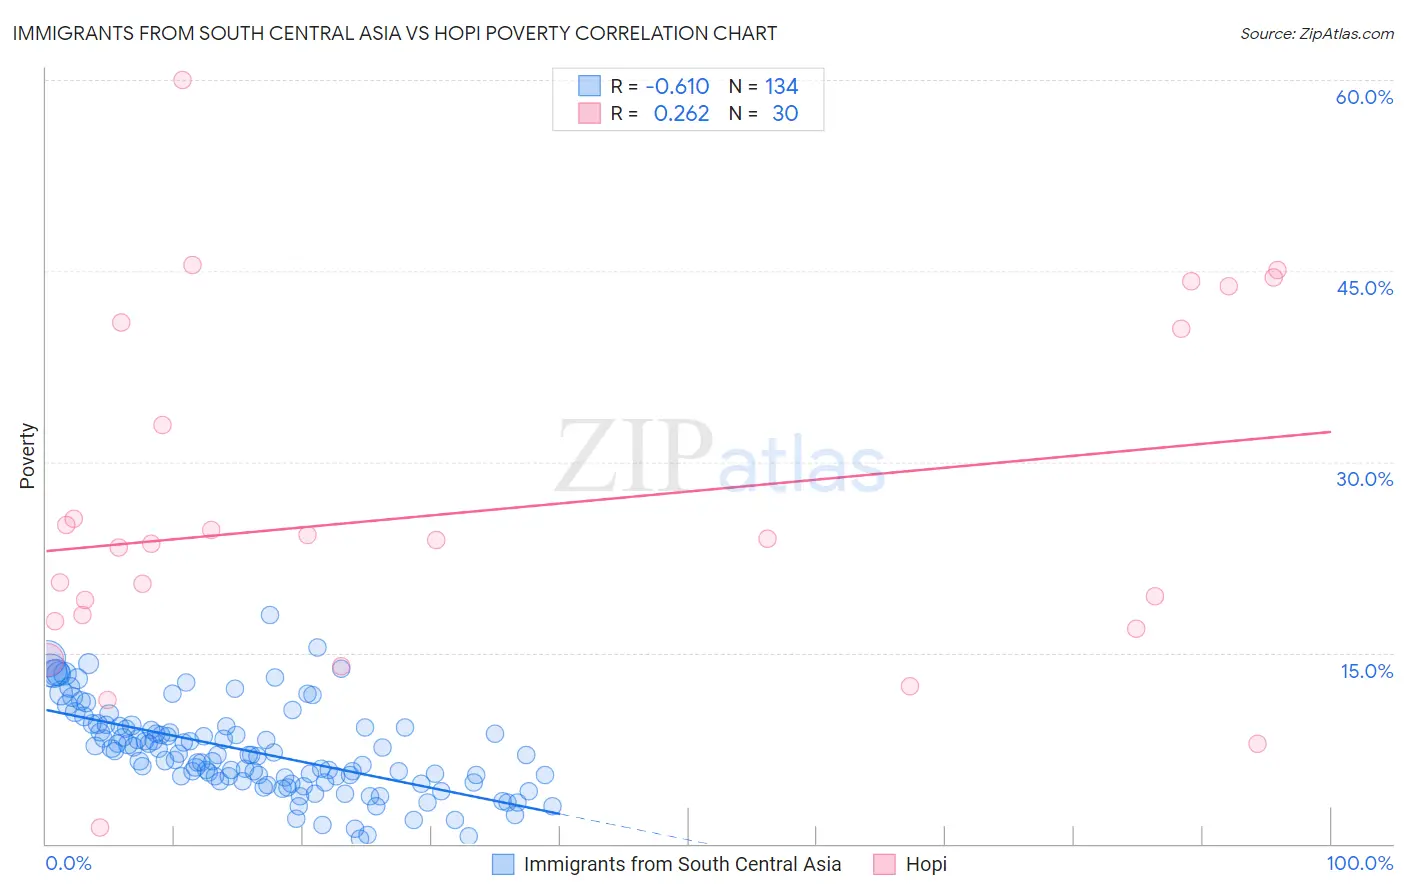
Immigrants from South Central Asia vs Hopi Poverty Correlation Chart
The statistical analysis conducted on geographies consisting of 472,664,539 people shows a significant negative correlation between the proportion of Immigrants from South Central Asia and poverty level in the United States with a correlation coefficient (R) of -0.610 and weighted average of 10.2%. Similarly, the statistical analysis conducted on geographies consisting of 74,733,532 people shows a weak positive correlation between the proportion of Hopi and poverty level in the United States with a correlation coefficient (R) of 0.262 and weighted average of 20.8%, a difference of 104.4%.
Poverty Correlation Summary
| Measurement | Immigrants from South Central Asia | Hopi |
| Minimum | 0.44% | 1.3% |
| Maximum | 18.0% | 60.0% |
| Range | 17.6% | 58.7% |
| Mean | 7.3% | 26.2% |
| Median | 7.0% | 23.8% |
| Interquartile 25% (IQ1) | 4.9% | 17.4% |
| Interquartile 75% (IQ3) | 9.2% | 40.4% |
| Interquartile Range (IQR) | 4.2% | 23.0% |
| Standard Deviation (Sample) | 3.4% | 13.6% |
| Standard Deviation (Population) | 3.4% | 13.4% |
Similar Demographics by Poverty
Demographics Similar to Immigrants from South Central Asia by Poverty
In terms of poverty, the demographic groups most similar to Immigrants from South Central Asia are Bulgarian (10.2%, a difference of 0.41%), Maltese (10.2%, a difference of 0.45%), Filipino (10.1%, a difference of 0.87%), Assyrian/Chaldean/Syriac (10.1%, a difference of 1.0%), and Immigrants from Ireland (10.1%, a difference of 1.2%).
| Demographics | Rating | Rank | Poverty |
| Chinese | 100.0 /100 | #2 | Exceptional 9.5% |
| Thais | 100.0 /100 | #3 | Exceptional 9.6% |
| Immigrants | Taiwan | 100.0 /100 | #4 | Exceptional 9.7% |
| Immigrants | Ireland | 99.9 /100 | #5 | Exceptional 10.1% |
| Assyrians/Chaldeans/Syriacs | 99.9 /100 | #6 | Exceptional 10.1% |
| Filipinos | 99.9 /100 | #7 | Exceptional 10.1% |
| Maltese | 99.9 /100 | #8 | Exceptional 10.2% |
| Immigrants | South Central Asia | 99.9 /100 | #9 | Exceptional 10.2% |
| Bulgarians | 99.9 /100 | #10 | Exceptional 10.2% |
| Immigrants | Lithuania | 99.9 /100 | #11 | Exceptional 10.3% |
| Bhutanese | 99.8 /100 | #12 | Exceptional 10.4% |
| Immigrants | Hong Kong | 99.8 /100 | #13 | Exceptional 10.4% |
| Immigrants | Bolivia | 99.8 /100 | #14 | Exceptional 10.4% |
| Bolivians | 99.8 /100 | #15 | Exceptional 10.4% |
| Lithuanians | 99.8 /100 | #16 | Exceptional 10.5% |
Demographics Similar to Hopi by Poverty
In terms of poverty, the demographic groups most similar to Hopi are Yup'ik (20.8%, a difference of 0.18%), Crow (20.7%, a difference of 0.93%), Immigrants from Yemen (21.5%, a difference of 3.2%), Yuman (20.2%, a difference of 3.2%), and Pima (21.9%, a difference of 4.8%).
| Demographics | Rating | Rank | Poverty |
| Houma | 0.0 /100 | #333 | Tragic 18.4% |
| Apache | 0.0 /100 | #334 | Tragic 18.4% |
| Cheyenne | 0.0 /100 | #335 | Tragic 18.9% |
| Pueblo | 0.0 /100 | #336 | Tragic 19.4% |
| Sioux | 0.0 /100 | #337 | Tragic 19.8% |
| Yuman | 0.0 /100 | #338 | Tragic 20.2% |
| Crow | 0.0 /100 | #339 | Tragic 20.7% |
| Yup'ik | 0.0 /100 | #340 | Tragic 20.8% |
| Hopi | 0.0 /100 | #341 | Tragic 20.8% |
| Immigrants | Yemen | 0.0 /100 | #342 | Tragic 21.5% |
| Pima | 0.0 /100 | #343 | Tragic 21.9% |
| Lumbee | 0.0 /100 | #344 | Tragic 21.9% |
| Navajo | 0.0 /100 | #345 | Tragic 23.1% |
| Puerto Ricans | 0.0 /100 | #346 | Tragic 23.7% |
| Tohono O'odham | 0.0 /100 | #347 | Tragic 24.4% |