Chickasaw vs Inupiat Poverty
COMPARE
Chickasaw
Inupiat
Poverty
Poverty Comparison
Chickasaw
Inupiat
14.7%
POVERTY
0.0/ 100
METRIC RATING
272nd/ 347
METRIC RANK
15.1%
POVERTY
0.0/ 100
METRIC RATING
287th/ 347
METRIC RANK
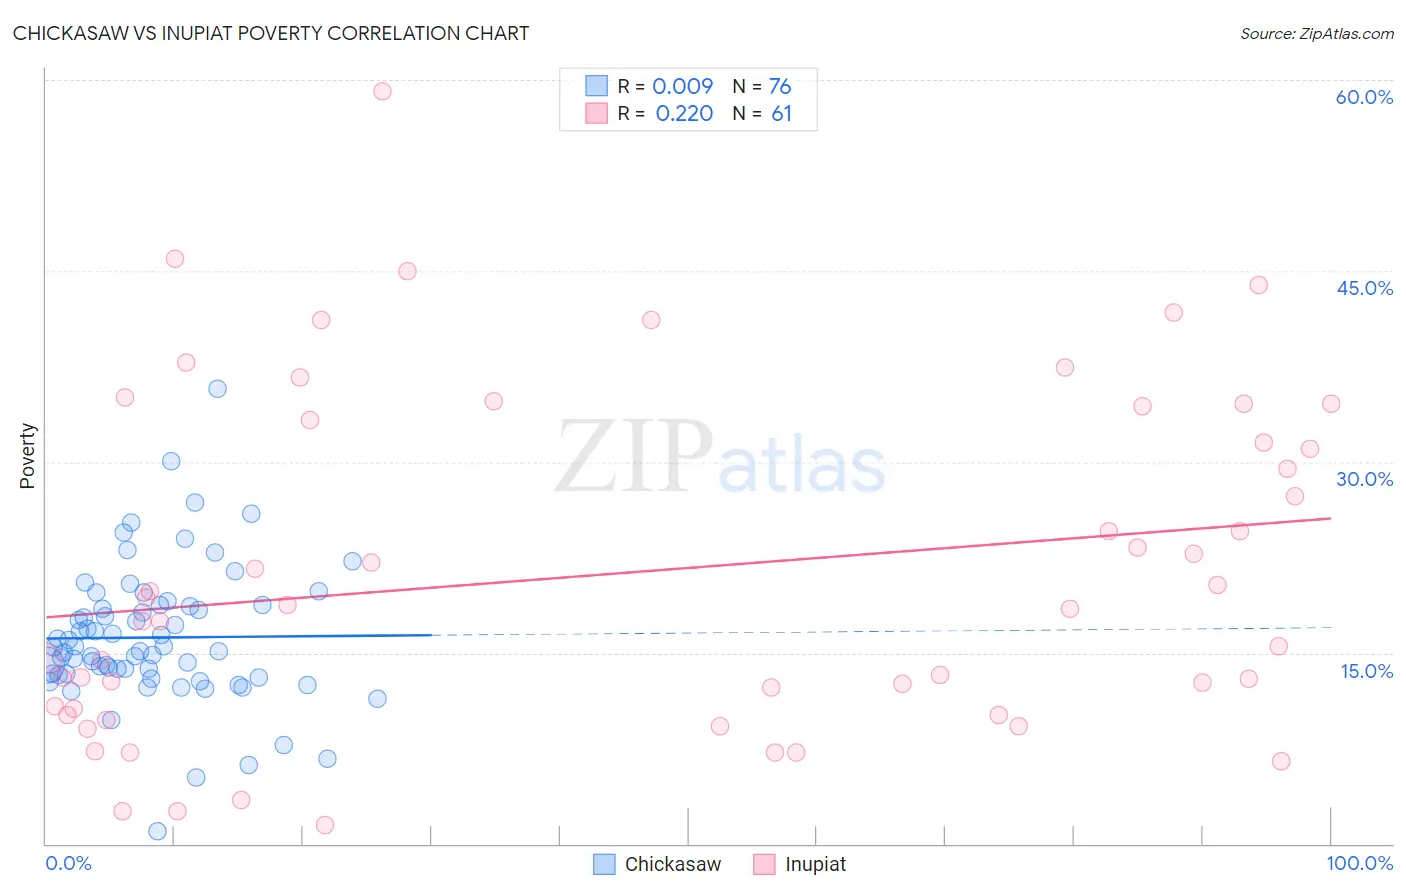
Chickasaw vs Inupiat Poverty Correlation Chart
The statistical analysis conducted on geographies consisting of 147,672,043 people shows no correlation between the proportion of Chickasaw and poverty level in the United States with a correlation coefficient (R) of 0.009 and weighted average of 14.7%. Similarly, the statistical analysis conducted on geographies consisting of 96,319,332 people shows a weak positive correlation between the proportion of Inupiat and poverty level in the United States with a correlation coefficient (R) of 0.220 and weighted average of 15.1%, a difference of 2.7%.
Poverty Correlation Summary
| Measurement | Chickasaw | Inupiat |
| Minimum | 0.99% | 1.4% |
| Maximum | 35.7% | 59.1% |
| Range | 34.7% | 57.7% |
| Mean | 16.2% | 21.3% |
| Median | 15.3% | 18.4% |
| Interquartile 25% (IQ1) | 13.3% | 10.3% |
| Interquartile 75% (IQ3) | 18.7% | 33.9% |
| Interquartile Range (IQR) | 5.4% | 23.5% |
| Standard Deviation (Sample) | 5.4% | 13.3% |
| Standard Deviation (Population) | 5.4% | 13.2% |
Demographics Similar to Chickasaw and Inupiat by Poverty
In terms of poverty, the demographic groups most similar to Chickasaw are Shoshone (14.7%, a difference of 0.040%), Spanish American (14.7%, a difference of 0.53%), Central American (14.6%, a difference of 0.63%), Immigrants from Cuba (14.6%, a difference of 0.77%), and Barbadian (14.8%, a difference of 0.93%). Similarly, the demographic groups most similar to Inupiat are Yaqui (15.1%, a difference of 0.010%), Immigrants from Belize (15.1%, a difference of 0.13%), Immigrants from Latin America (15.0%, a difference of 0.21%), Vietnamese (15.0%, a difference of 0.47%), and West Indian (15.0%, a difference of 0.53%).
| Demographics | Rating | Rank | Poverty |
| Immigrants | Cuba | 0.1 /100 | #269 | Tragic 14.6% |
| Central Americans | 0.1 /100 | #270 | Tragic 14.6% |
| Shoshone | 0.0 /100 | #271 | Tragic 14.7% |
| Chickasaw | 0.0 /100 | #272 | Tragic 14.7% |
| Spanish Americans | 0.0 /100 | #273 | Tragic 14.7% |
| Barbadians | 0.0 /100 | #274 | Tragic 14.8% |
| Immigrants | West Indies | 0.0 /100 | #275 | Tragic 14.8% |
| Immigrants | Bahamas | 0.0 /100 | #276 | Tragic 14.8% |
| Bangladeshis | 0.0 /100 | #277 | Tragic 14.8% |
| Belizeans | 0.0 /100 | #278 | Tragic 14.8% |
| Immigrants | St. Vincent and the Grenadines | 0.0 /100 | #279 | Tragic 14.9% |
| Haitians | 0.0 /100 | #280 | Tragic 14.9% |
| Immigrants | Barbados | 0.0 /100 | #281 | Tragic 14.9% |
| Comanche | 0.0 /100 | #282 | Tragic 15.0% |
| Immigrants | Haiti | 0.0 /100 | #283 | Tragic 15.0% |
| West Indians | 0.0 /100 | #284 | Tragic 15.0% |
| Vietnamese | 0.0 /100 | #285 | Tragic 15.0% |
| Immigrants | Latin America | 0.0 /100 | #286 | Tragic 15.0% |
| Inupiat | 0.0 /100 | #287 | Tragic 15.1% |
| Yaqui | 0.0 /100 | #288 | Tragic 15.1% |
| Immigrants | Belize | 0.0 /100 | #289 | Tragic 15.1% |