Chickasaw vs Hopi Householder Income Ages 45 - 64 years
COMPARE
Chickasaw
Hopi
Householder Income Ages 45 - 64 years
Householder Income Ages 45 - 64 years Comparison
Chickasaw
Hopi
$82,193
HOUSEHOLDER INCOME AGES 45 - 64 YEARS
0.0/ 100
METRIC RATING
319th/ 347
METRIC RANK
$75,562
HOUSEHOLDER INCOME AGES 45 - 64 YEARS
0.0/ 100
METRIC RATING
338th/ 347
METRIC RANK
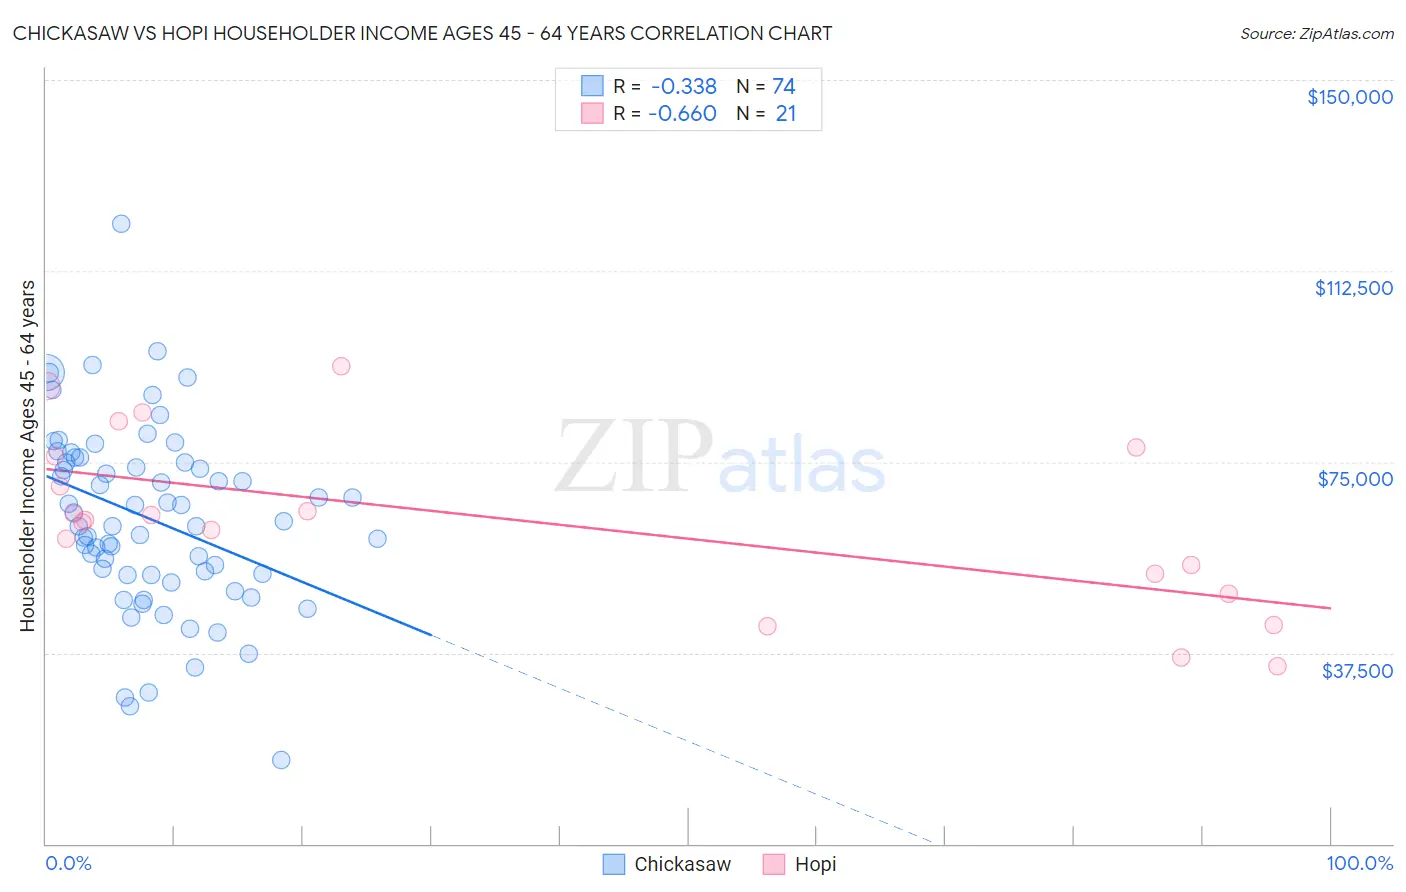
Chickasaw vs Hopi Householder Income Ages 45 - 64 years Correlation Chart
The statistical analysis conducted on geographies consisting of 147,555,811 people shows a mild negative correlation between the proportion of Chickasaw and household income with householder between the ages 45 and 64 in the United States with a correlation coefficient (R) of -0.338 and weighted average of $82,193. Similarly, the statistical analysis conducted on geographies consisting of 74,685,429 people shows a significant negative correlation between the proportion of Hopi and household income with householder between the ages 45 and 64 in the United States with a correlation coefficient (R) of -0.660 and weighted average of $75,562, a difference of 8.8%.
Householder Income Ages 45 - 64 years Correlation Summary
| Measurement | Chickasaw | Hopi |
| Minimum | $16,544 | $34,950 |
| Maximum | $121,667 | $93,766 |
| Range | $105,123 | $58,816 |
| Mean | $63,806 | $63,454 |
| Median | $62,897 | $63,663 |
| Interquartile 25% (IQ1) | $52,874 | $51,066 |
| Interquartile 75% (IQ3) | $75,000 | $76,979 |
| Interquartile Range (IQR) | $22,126 | $25,913 |
| Standard Deviation (Sample) | $18,170 | $16,805 |
| Standard Deviation (Population) | $18,046 | $16,400 |
Demographics Similar to Chickasaw and Hopi by Householder Income Ages 45 - 64 years
In terms of householder income ages 45 - 64 years, the demographic groups most similar to Chickasaw are Apache ($82,184, a difference of 0.010%), Yuman ($82,139, a difference of 0.070%), Choctaw ($82,287, a difference of 0.11%), Sioux ($81,750, a difference of 0.54%), and Bahamian ($81,369, a difference of 1.0%). Similarly, the demographic groups most similar to Hopi are Pueblo ($75,601, a difference of 0.050%), Arapaho ($75,945, a difference of 0.51%), Cheyenne ($76,362, a difference of 1.1%), Menominee ($76,903, a difference of 1.8%), and Immigrants from Congo ($77,850, a difference of 3.0%).
| Demographics | Rating | Rank | Householder Income Ages 45 - 64 years |
| Choctaw | 0.0 /100 | #318 | Tragic $82,287 |
| Chickasaw | 0.0 /100 | #319 | Tragic $82,193 |
| Apache | 0.0 /100 | #320 | Tragic $82,184 |
| Yuman | 0.0 /100 | #321 | Tragic $82,139 |
| Sioux | 0.0 /100 | #322 | Tragic $81,750 |
| Bahamians | 0.0 /100 | #323 | Tragic $81,369 |
| Yup'ik | 0.0 /100 | #324 | Tragic $81,000 |
| Immigrants | Cuba | 0.0 /100 | #325 | Tragic $80,662 |
| Dominicans | 0.0 /100 | #326 | Tragic $80,623 |
| Seminole | 0.0 /100 | #327 | Tragic $80,077 |
| Natives/Alaskans | 0.0 /100 | #328 | Tragic $79,816 |
| Dutch West Indians | 0.0 /100 | #329 | Tragic $79,171 |
| Creek | 0.0 /100 | #330 | Tragic $78,960 |
| Immigrants | Dominican Republic | 0.0 /100 | #331 | Tragic $78,836 |
| Blacks/African Americans | 0.0 /100 | #332 | Tragic $78,556 |
| Immigrants | Congo | 0.0 /100 | #333 | Tragic $77,850 |
| Menominee | 0.0 /100 | #334 | Tragic $76,903 |
| Cheyenne | 0.0 /100 | #335 | Tragic $76,362 |
| Arapaho | 0.0 /100 | #336 | Tragic $75,945 |
| Pueblo | 0.0 /100 | #337 | Tragic $75,601 |
| Hopi | 0.0 /100 | #338 | Tragic $75,562 |