Zip Codes with the Highest Percentage of Population Employed in Accommodation & Food Services in Lebanon, PA
RELATED REPORTS & OPTIONS
Accommodation & Food Services
Lebanon
Compare Zip Codes
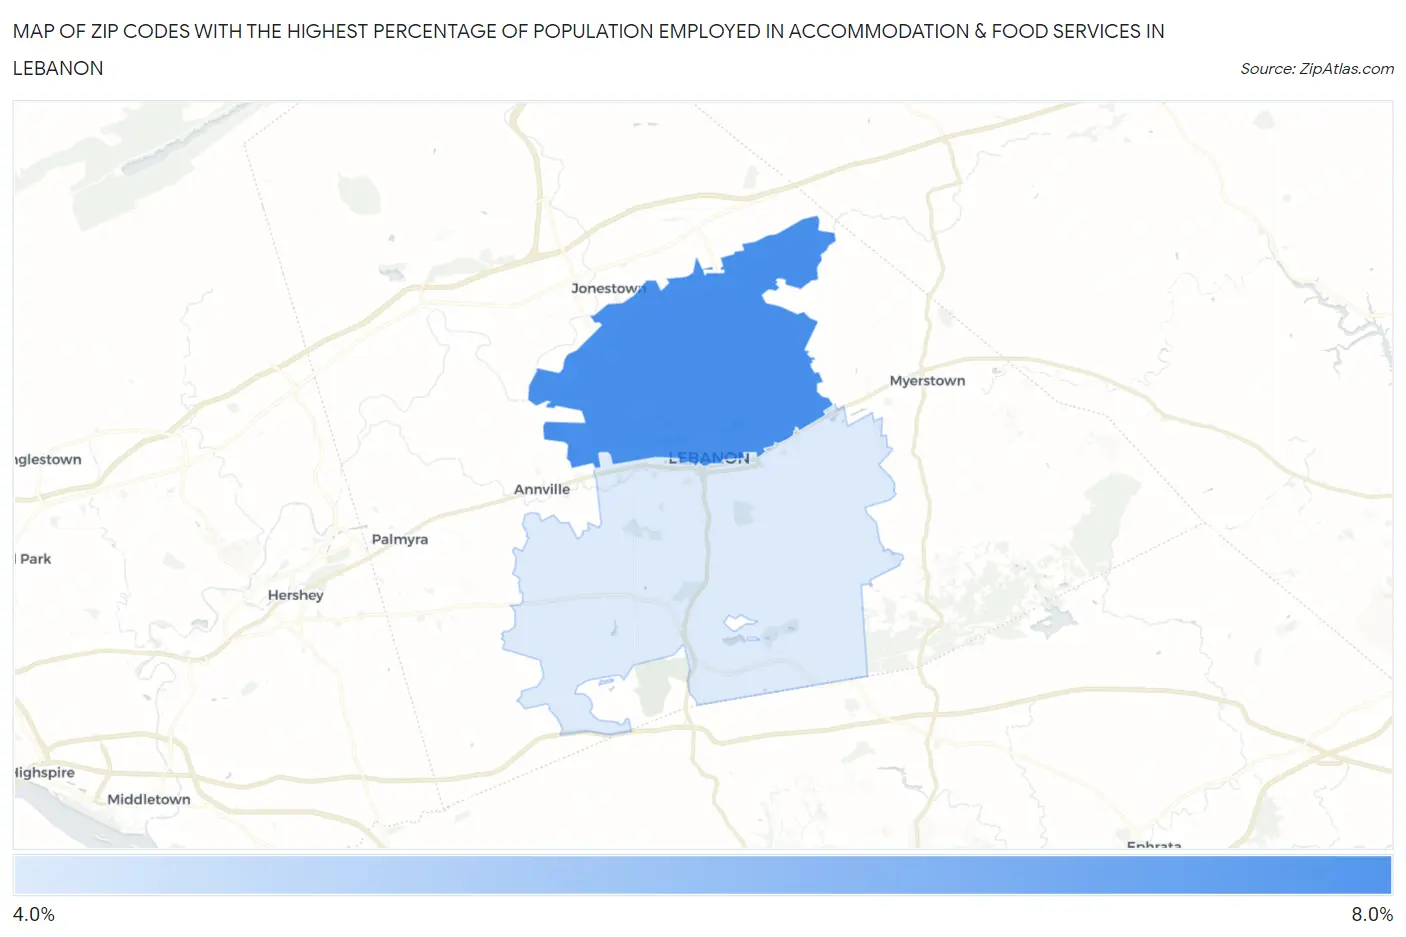
Map of Zip Codes with the Highest Percentage of Population Employed in Accommodation & Food Services in Lebanon
4.8%
7.2%
Zip Codes with the Highest Percentage of Population Employed in Accommodation & Food Services in Lebanon, PA
| Zip Code | % Employed | vs State | vs National | |
| 1. | 17046 | 7.2% | 5.9%(+1.28)#444 | 6.9%(+0.293)#9,871 |
| 2. | 17042 | 4.8% | 5.9%(-1.10)#918 | 6.9%(-2.09)#17,531 |
1
Common Questions
What are the Top Zip Codes with the Highest Percentage of Population Employed in Accommodation & Food Services in Lebanon, PA?
Top Zip Codes with the Highest Percentage of Population Employed in Accommodation & Food Services in Lebanon, PA are:
What zip code has the Highest Percentage of Population Employed in Accommodation & Food Services in Lebanon, PA?
17046 has the Highest Percentage of Population Employed in Accommodation & Food Services in Lebanon, PA with 7.2%.
What is the Percentage of Population Employed in Accommodation & Food Services in Lebanon, PA?
Percentage of Population Employed in Accommodation & Food Services in Lebanon is 7.0%.
What is the Percentage of Population Employed in Accommodation & Food Services in Pennsylvania?
Percentage of Population Employed in Accommodation & Food Services in Pennsylvania is 5.9%.
What is the Percentage of Population Employed in Accommodation & Food Services in the United States?
Percentage of Population Employed in Accommodation & Food Services in the United States is 6.9%.