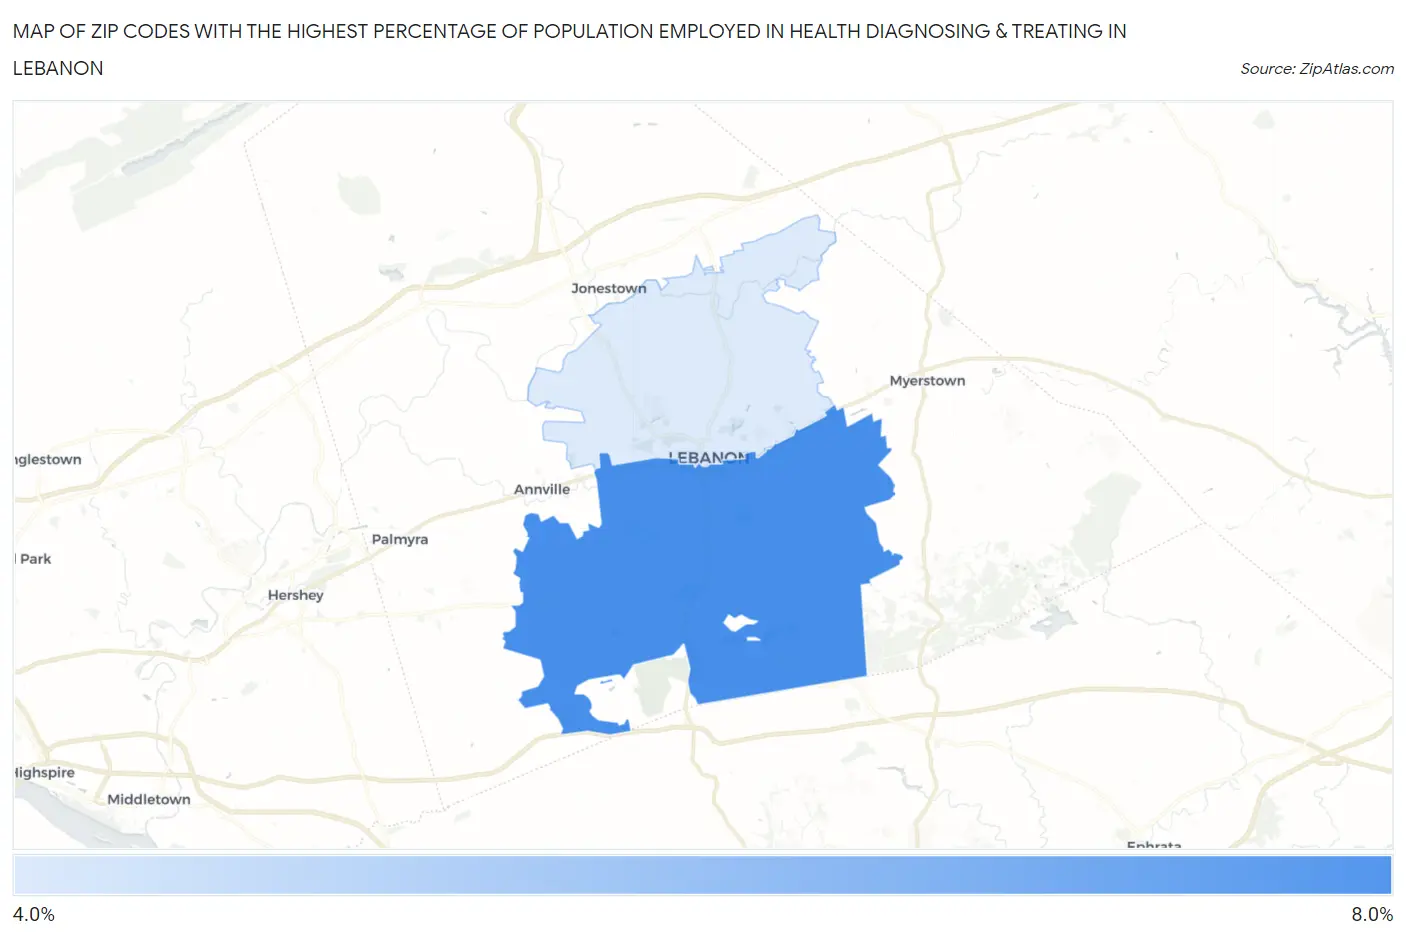
Zip Codes with the Highest Percentage of Population Employed in Health Diagnosing & Treating in Lebanon, PA
RELATED REPORTS & OPTIONS
Health Diagnosing & Treating
Lebanon
Compare Zip Codes
Map of Zip Codes with the Highest Percentage of Population Employed in Health Diagnosing & Treating in Lebanon
4.4%
7.3%
Zip Codes with the Highest Percentage of Population Employed in Health Diagnosing & Treating in Lebanon, PA
| Zip Code | % Employed | vs State | vs National | |
| 1. | 17042 | 7.3% | 7.4%(-0.058)#680 | 6.2%(+1.05)#9,439 |
| 2. | 17046 | 4.4% | 7.4%(-2.91)#1,273 | 6.2%(-1.81)#19,878 |
1
Common Questions
What are the Top Zip Codes with the Highest Percentage of Population Employed in Health Diagnosing & Treating in Lebanon, PA?
Top Zip Codes with the Highest Percentage of Population Employed in Health Diagnosing & Treating in Lebanon, PA are:
What zip code has the Highest Percentage of Population Employed in Health Diagnosing & Treating in Lebanon, PA?
17042 has the Highest Percentage of Population Employed in Health Diagnosing & Treating in Lebanon, PA with 7.3%.
What is the Percentage of Population Employed in Health Diagnosing & Treating in Lebanon, PA?
Percentage of Population Employed in Health Diagnosing & Treating in Lebanon is 5.6%.
What is the Percentage of Population Employed in Health Diagnosing & Treating in Pennsylvania?
Percentage of Population Employed in Health Diagnosing & Treating in Pennsylvania is 7.4%.
What is the Percentage of Population Employed in Health Diagnosing & Treating in the United States?
Percentage of Population Employed in Health Diagnosing & Treating in the United States is 6.2%.