Zip Codes with the Highest Percentage of Population Employed in Legal Services & Support in Lebanon, PA
RELATED REPORTS & OPTIONS
Legal Services & Support
Lebanon
Compare Zip Codes
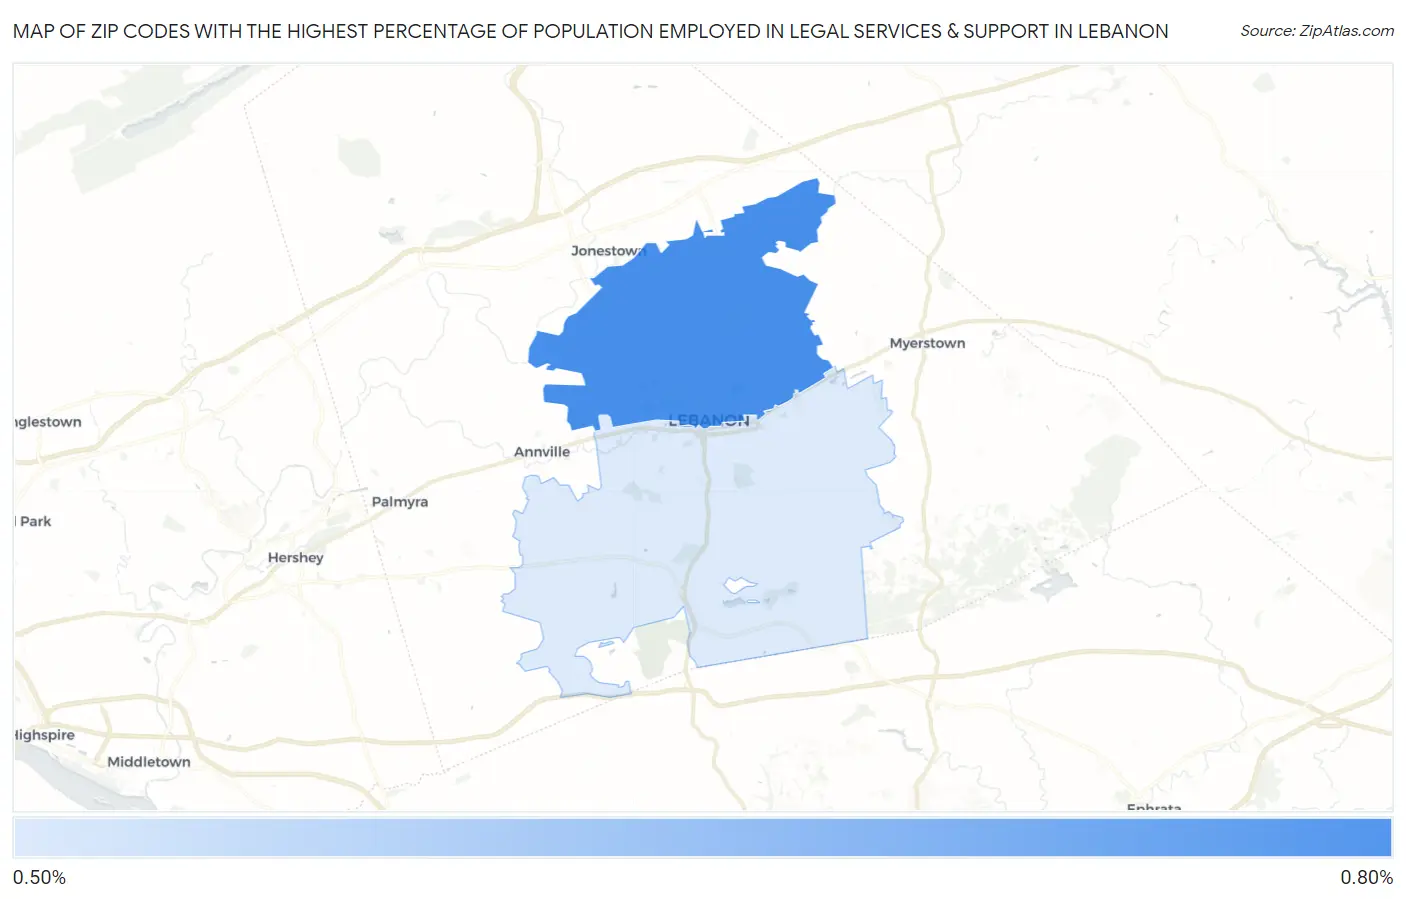
Map of Zip Codes with the Highest Percentage of Population Employed in Legal Services & Support in Lebanon
0.59%
0.63%
Zip Codes with the Highest Percentage of Population Employed in Legal Services & Support in Lebanon, PA
| Zip Code | % Employed | vs State | vs National | |
| 1. | 17046 | 0.63% | 1.1%(-0.519)#539 | 1.2%(-0.556)#11,159 |
| 2. | 17042 | 0.59% | 1.1%(-0.556)#559 | 1.2%(-0.592)#11,545 |
1
Common Questions
What are the Top Zip Codes with the Highest Percentage of Population Employed in Legal Services & Support in Lebanon, PA?
Top Zip Codes with the Highest Percentage of Population Employed in Legal Services & Support in Lebanon, PA are:
What zip code has the Highest Percentage of Population Employed in Legal Services & Support in Lebanon, PA?
17046 has the Highest Percentage of Population Employed in Legal Services & Support in Lebanon, PA with 0.63%.
What is the Percentage of Population Employed in Legal Services & Support in Lebanon, PA?
Percentage of Population Employed in Legal Services & Support in Lebanon is 0.19%.
What is the Percentage of Population Employed in Legal Services & Support in Pennsylvania?
Percentage of Population Employed in Legal Services & Support in Pennsylvania is 1.1%.
What is the Percentage of Population Employed in Legal Services & Support in the United States?
Percentage of Population Employed in Legal Services & Support in the United States is 1.2%.