Zip Codes with the Highest Percentage of Hispanic or Latino Population in Grants Pass, OR
RELATED REPORTS & OPTIONS
Hispanic or Latino
Grants Pass
Compare Zip Codes
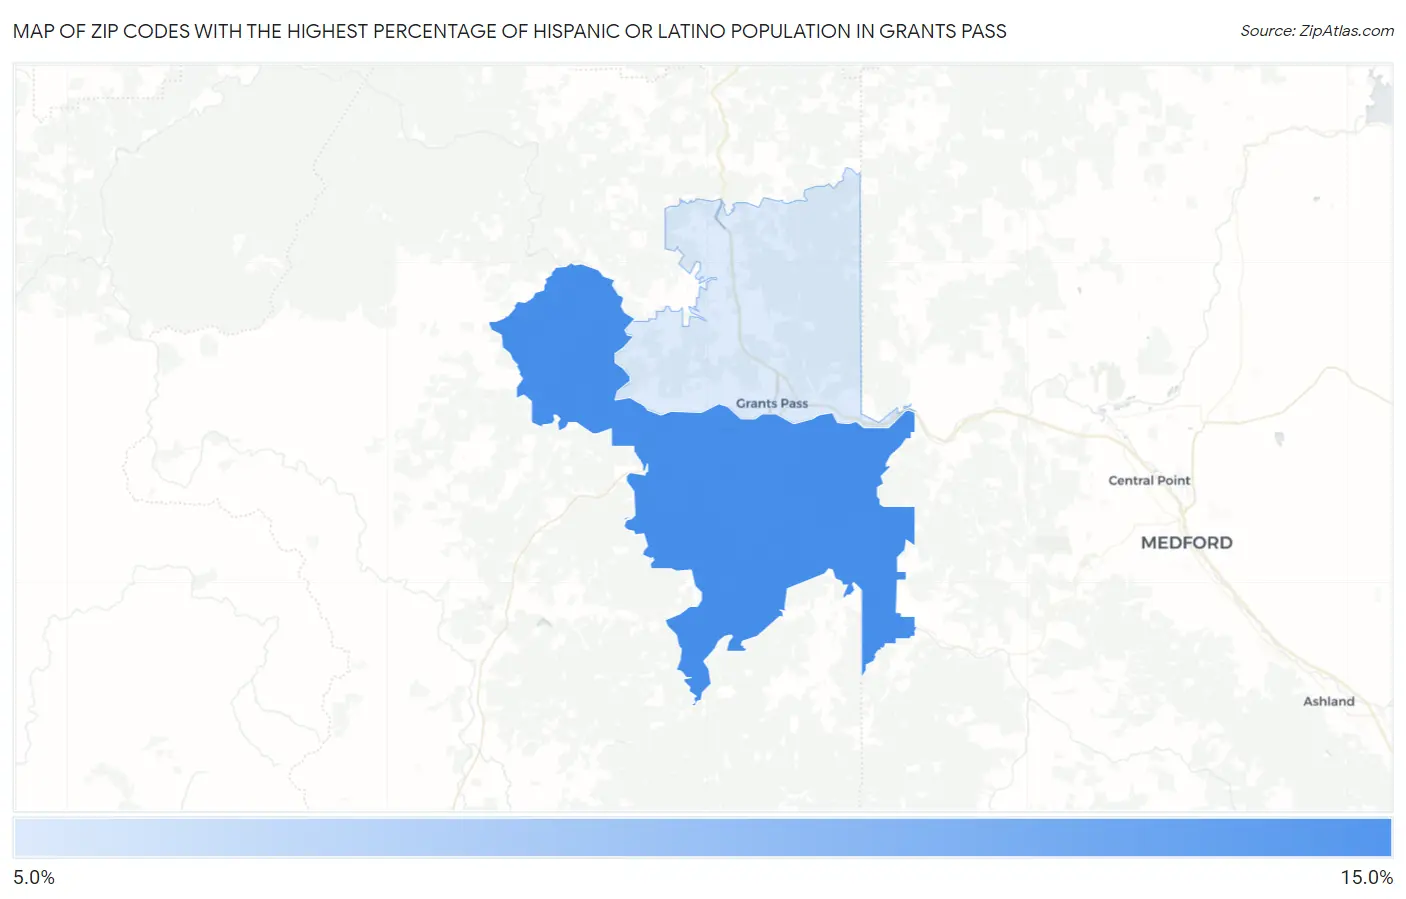
Map of Zip Codes with the Highest Percentage of Hispanic or Latino Population in Grants Pass
7.4%
10.3%
Zip Codes with the Highest Percentage of Hispanic or Latino Population in Grants Pass, OR
| Zip Code | Hispanic or Latino | vs State | vs National | |
| 1. | 97527 | 10.3% | 13.8%(-3.47)#141 | 18.7%(-8.34)#8,685 |
| 2. | 97526 | 7.4% | 13.8%(-6.42)#202 | 18.7%(-11.3)#11,208 |
1
Common Questions
What are the Top Zip Codes with the Highest Percentage of Hispanic or Latino Population in Grants Pass, OR?
Top Zip Codes with the Highest Percentage of Hispanic or Latino Population in Grants Pass, OR are:
What zip code has the Highest Percentage of Hispanic or Latino Population in Grants Pass, OR?
97527 has the Highest Percentage of Hispanic or Latino Population in Grants Pass, OR with 10.3%.
What is the Percentage of Hispanic or Latino Population in Grants Pass, OR?
Percentage of Hispanic or Latino Population in Grants Pass is 10.2%.
What is the Percentage of Hispanic or Latino Population in Oregon?
Percentage of Hispanic or Latino Population in Oregon is 13.8%.
What is the Percentage of Hispanic or Latino Population in the United States?
Percentage of Hispanic or Latino Population in the United States is 18.7%.