Zip Codes with the Highest Percentage of Population with a Degree in Science and Engineering in Grants Pass, OR
RELATED REPORTS & OPTIONS
Science and Engineering
Grants Pass
Compare Zip Codes
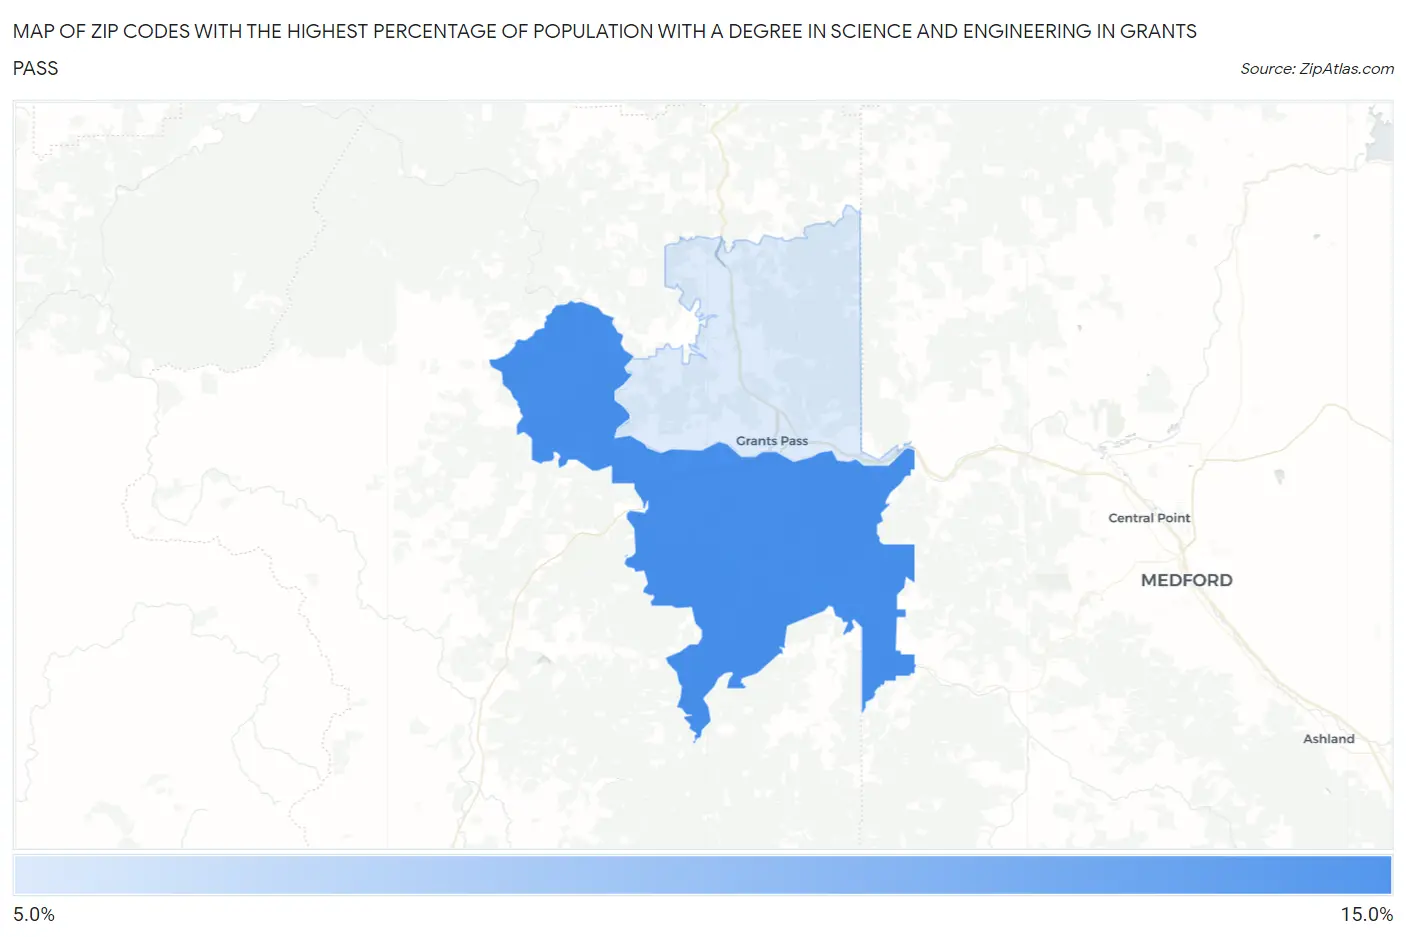
Map of Zip Codes with the Highest Percentage of Population with a Degree in Science and Engineering in Grants Pass
6.7%
12.0%
Zip Codes with the Highest Percentage of Population with a Degree in Science and Engineering in Grants Pass, OR
| Zip Code | % Graduates | vs State | vs National | |
| 1. | 97527 | 12.0% | 8.9%(+3.15)#99 | 9.8%(+2.23)#10,867 |
| 2. | 97526 | 6.7% | 8.9%(-2.12)#264 | 9.8%(-3.04)#22,164 |
1
Common Questions
What are the Top Zip Codes with the Highest Percentage of Population with a Degree in Science and Engineering in Grants Pass, OR?
Top Zip Codes with the Highest Percentage of Population with a Degree in Science and Engineering in Grants Pass, OR are:
What zip code has the Highest Percentage of Population with a Degree in Science and Engineering in Grants Pass, OR?
97527 has the Highest Percentage of Population with a Degree in Science and Engineering in Grants Pass, OR with 12.0%.
What is the Percentage of Population with a Degree in Science and Engineering in Grants Pass, OR?
Percentage of Population with a Degree in Science and Engineering in Grants Pass is 6.3%.
What is the Percentage of Population with a Degree in Science and Engineering in Oregon?
Percentage of Population with a Degree in Science and Engineering in Oregon is 8.9%.
What is the Percentage of Population with a Degree in Science and Engineering in the United States?
Percentage of Population with a Degree in Science and Engineering in the United States is 9.8%.