Zip Codes with the Highest Percentage of Population with a Degree in Visual and Performing Arts in Mansfield, OH
RELATED REPORTS & OPTIONS
Visual and Performing Arts
Mansfield
Compare Zip Codes
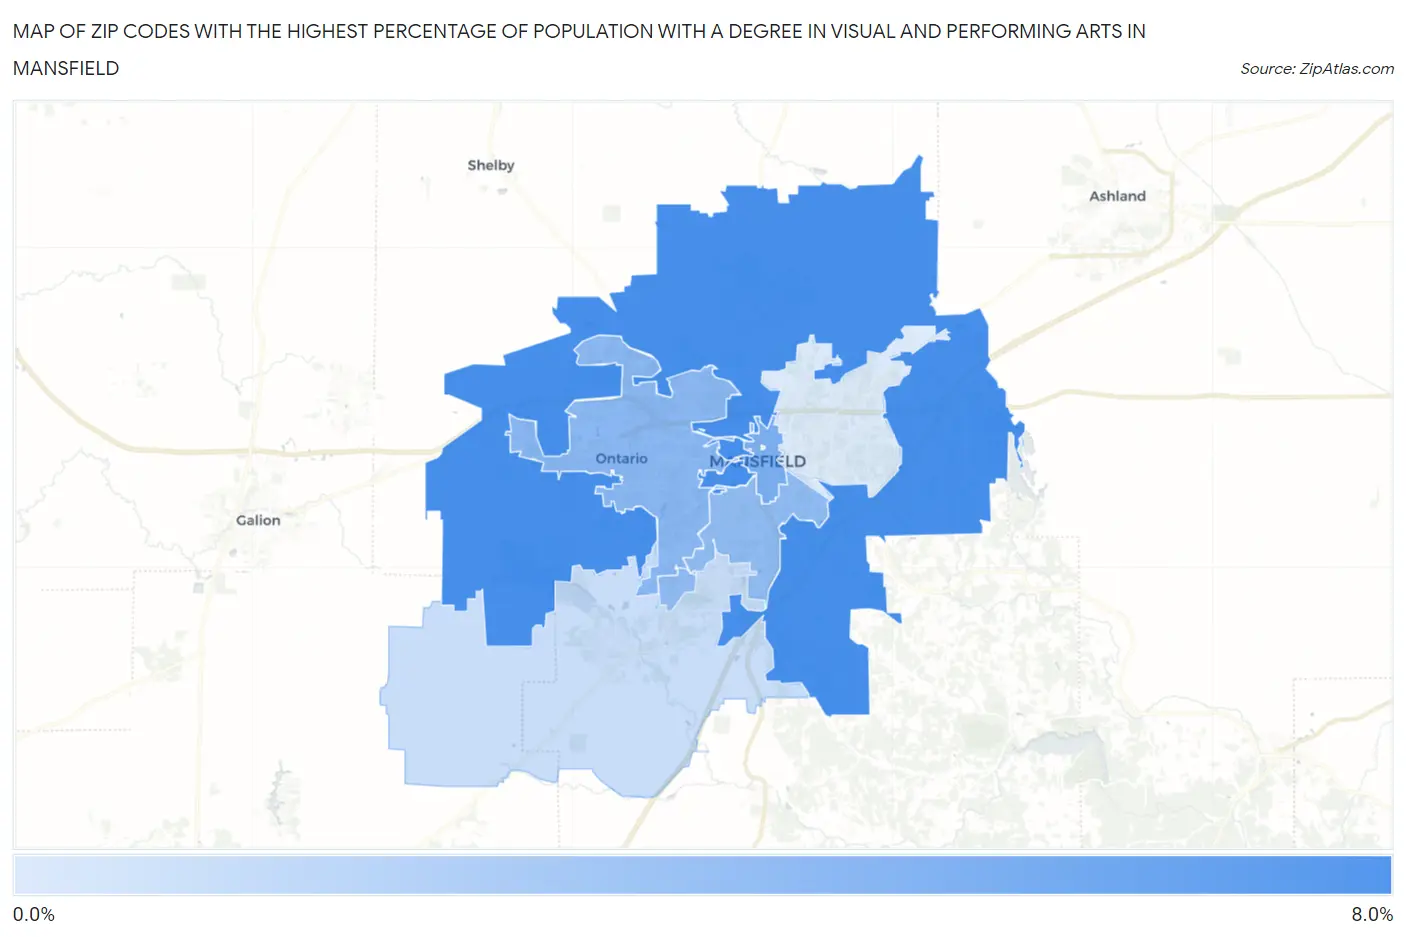
Map of Zip Codes with the Highest Percentage of Population with a Degree in Visual and Performing Arts in Mansfield
0.73%
6.3%
Zip Codes with the Highest Percentage of Population with a Degree in Visual and Performing Arts in Mansfield, OH
| Zip Code | % Graduates | vs State | vs National | |
| 1. | 44903 | 6.3% | 3.7%(+2.63)#159 | 4.3%(+2.08)#4,428 |
| 2. | 44902 | 4.3% | 3.7%(+0.563)#304 | 4.3%(+0.021)#8,429 |
| 3. | 44906 | 3.8% | 3.7%(+0.087)#351 | 4.3%(-0.455)#9,861 |
| 4. | 44907 | 3.5% | 3.7%(-0.170)#383 | 4.3%(-0.711)#10,739 |
| 5. | 44904 | 1.5% | 3.7%(-2.20)#663 | 4.3%(-2.74)#18,123 |
| 6. | 44905 | 0.73% | 3.7%(-2.98)#755 | 4.3%(-3.53)#20,304 |
1
Common Questions
What are the Top 5 Zip Codes with the Highest Percentage of Population with a Degree in Visual and Performing Arts in Mansfield, OH?
Top 5 Zip Codes with the Highest Percentage of Population with a Degree in Visual and Performing Arts in Mansfield, OH are:
What zip code has the Highest Percentage of Population with a Degree in Visual and Performing Arts in Mansfield, OH?
44903 has the Highest Percentage of Population with a Degree in Visual and Performing Arts in Mansfield, OH with 6.3%.
What is the Percentage of Population with a Degree in Visual and Performing Arts in Mansfield, OH?
Percentage of Population with a Degree in Visual and Performing Arts in Mansfield is 5.0%.
What is the Percentage of Population with a Degree in Visual and Performing Arts in Ohio?
Percentage of Population with a Degree in Visual and Performing Arts in Ohio is 3.7%.
What is the Percentage of Population with a Degree in Visual and Performing Arts in the United States?
Percentage of Population with a Degree in Visual and Performing Arts in the United States is 4.3%.