Zip Codes with the Highest Percentage of Population with a Degree in Visual and Performing Arts in Columbus, OH
RELATED REPORTS & OPTIONS
Visual and Performing Arts
Columbus
Compare Zip Codes
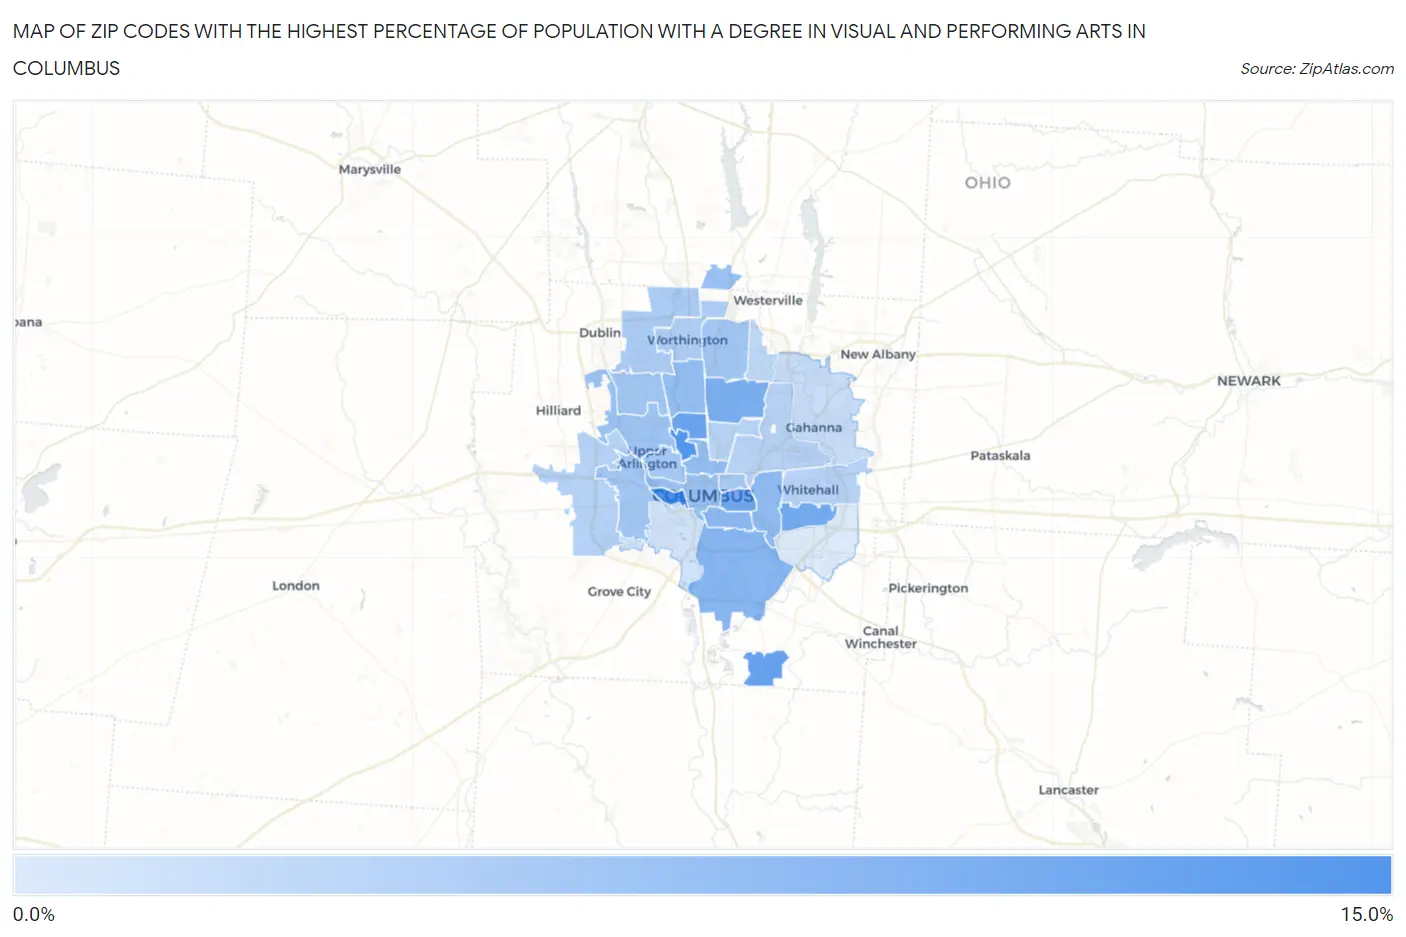
Map of Zip Codes with the Highest Percentage of Population with a Degree in Visual and Performing Arts in Columbus
1.1%
11.2%
Zip Codes with the Highest Percentage of Population with a Degree in Visual and Performing Arts in Columbus, OH
| Zip Code | % Graduates | vs State | vs National | |
| 1. | 43222 | 11.2% | 3.7%(+7.48)#58 | 4.3%(+6.94)#1,470 |
| 2. | 43210 | 10.4% | 3.7%(+6.66)#64 | 4.3%(+6.12)#1,715 |
| 3. | 43217 | 9.0% | 3.7%(+5.29)#89 | 4.3%(+4.75)#2,264 |
| 4. | 43202 | 8.7% | 3.7%(+4.97)#98 | 4.3%(+4.43)#2,433 |
| 5. | 43205 | 8.4% | 3.7%(+4.65)#105 | 4.3%(+4.11)#2,617 |
| 6. | 43227 | 8.0% | 3.7%(+4.33)#112 | 4.3%(+3.79)#2,818 |
| 7. | 43224 | 7.5% | 3.7%(+3.77)#117 | 4.3%(+3.22)#3,230 |
| 8. | 43207 | 6.8% | 3.7%(+3.06)#144 | 4.3%(+2.52)#3,910 |
| 9. | 43206 | 6.4% | 3.7%(+2.67)#156 | 4.3%(+2.13)#4,367 |
| 10. | 43209 | 6.1% | 3.7%(+2.35)#170 | 4.3%(+1.81)#4,780 |
| 11. | 43201 | 5.9% | 3.7%(+2.18)#176 | 4.3%(+1.64)#5,020 |
| 12. | 43214 | 5.9% | 3.7%(+2.17)#178 | 4.3%(+1.63)#5,044 |
| 13. | 43240 | 5.5% | 3.7%(+1.84)#199 | 4.3%(+1.30)#5,599 |
| 14. | 43215 | 5.3% | 3.7%(+1.63)#211 | 4.3%(+1.09)#5,956 |
| 15. | 43221 | 5.2% | 3.7%(+1.47)#218 | 4.3%(+0.930)#6,277 |
| 16. | 43220 | 5.0% | 3.7%(+1.25)#239 | 4.3%(+0.706)#6,742 |
| 17. | 43204 | 5.0% | 3.7%(+1.24)#241 | 4.3%(+0.699)#6,763 |
| 18. | 43229 | 4.9% | 3.7%(+1.16)#245 | 4.3%(+0.620)#6,918 |
| 19. | 43212 | 4.8% | 3.7%(+1.06)#254 | 4.3%(+0.514)#7,138 |
| 20. | 43203 | 4.6% | 3.7%(+0.905)#267 | 4.3%(+0.364)#7,509 |
| 21. | 43235 | 4.3% | 3.7%(+0.597)#301 | 4.3%(+0.056)#8,332 |
| 22. | 43085 | 4.0% | 3.7%(+0.241)#333 | 4.3%(-0.301)#9,393 |
| 23. | 43228 | 3.7% | 3.7%(+0.003)#363 | 4.3%(-0.538)#10,115 |
| 24. | 43219 | 3.5% | 3.7%(-0.221)#388 | 4.3%(-0.763)#10,919 |
| 25. | 43213 | 3.5% | 3.7%(-0.235)#395 | 4.3%(-0.776)#10,977 |
| 26. | 43211 | 3.4% | 3.7%(-0.297)#405 | 4.3%(-0.838)#11,198 |
| 27. | 43231 | 3.1% | 3.7%(-0.658)#443 | 4.3%(-1.20)#12,532 |
| 28. | 43230 | 2.5% | 3.7%(-1.24)#527 | 4.3%(-1.78)#14,711 |
| 29. | 43223 | 1.8% | 3.7%(-1.87)#623 | 4.3%(-2.41)#16,999 |
| 30. | 43232 | 1.1% | 3.7%(-2.57)#709 | 4.3%(-3.11)#19,264 |
1
Common Questions
What are the Top 10 Zip Codes with the Highest Percentage of Population with a Degree in Visual and Performing Arts in Columbus, OH?
Top 10 Zip Codes with the Highest Percentage of Population with a Degree in Visual and Performing Arts in Columbus, OH are:
What zip code has the Highest Percentage of Population with a Degree in Visual and Performing Arts in Columbus, OH?
43222 has the Highest Percentage of Population with a Degree in Visual and Performing Arts in Columbus, OH with 11.2%.
What is the Percentage of Population with a Degree in Visual and Performing Arts in Columbus, OH?
Percentage of Population with a Degree in Visual and Performing Arts in Columbus is 4.8%.
What is the Percentage of Population with a Degree in Visual and Performing Arts in Ohio?
Percentage of Population with a Degree in Visual and Performing Arts in Ohio is 3.7%.
What is the Percentage of Population with a Degree in Visual and Performing Arts in the United States?
Percentage of Population with a Degree in Visual and Performing Arts in the United States is 4.3%.