Zip Codes with the Highest Percentage of Population Employed in Firefighting & Prevention in Columbus, OH

RELATED REPORTS & OPTIONS

Firefighting & Prevention
Population
Families and Households
Female Fertility
Female Fertility (Unmarried)
Race (Community Size)
Race (Percentage)
Ancestry (Community Size)
AfghanAfricanAlbanianAlsatianAmericanApacheArabArgentineanArmenianAustralianAustrianBahamianBangladeshiBarbadianBasqueBelgianBelizeanBhutaneseBlackfeetBolivianBrazilianBritishBritish West IndianBulgarianBurmeseCambodianCanadianCape VerdeanCarpatho RusynCelticCentral AmericanCentral American IndianCherokeeChileanChippewaChoctawColombianCosta RicanCreeCreekCroatianCrowCubanCzechCzechoslovakianDanishDelawareDominicanDutchDutch West IndianEastern EuropeanEcuadorianEgyptianEnglishEstonianEthiopianEuropeanFilipinoFinnishFrenchFrench American IndianFrench CanadianGermanGerman RussianGhanaianGreekGuamanian / ChamorroGuatemalanGuyaneseHaitianHonduranHungarianIcelanderIndian (Asian)IndonesianInupiatIranianIraqiIrishIroquoisIsraeliItalianJamaicanJapaneseJordanianKenyanKoreanLaotianLatvianLebaneseLiberianLithuanianLumbeeLuxembourgerMacedonianMalaysianMalteseMexicanMexican American IndianMongolianMoroccanNative HawaiianNavajoNew ZealanderNicaraguanNigerianNorthern EuropeanNorwegianPakistaniPalestinianPanamanianParaguayanPennsylvania GermanPeruvianPolishPortuguesePuerto RicanRomanianRussianSalvadoranSamoanScandinavianScotch-IrishScottishSeminoleSenegaleseSerbianSierra LeoneanSiouxSlavicSlovakSloveneSomaliSouth AfricanSouth AmericanSouth American IndianSpaniardSpanishSri LankanSubsaharan AfricanSudaneseSwedishSwissSyrianThaiTrinidadian and TobagonianTurkishUgandanUkrainianUruguayanVenezuelanVietnameseWelshWest IndianYaquiYugoslavianZimbabwean
Ancestry (Percentage)
AfghanAfricanAlbanianAlsatianAmericanApacheArabArgentineanArmenianAustralianAustrianBahamianBangladeshiBarbadianBasqueBelgianBelizeanBhutaneseBlackfeetBolivianBrazilianBritishBritish West IndianBulgarianBurmeseCambodianCanadianCape VerdeanCarpatho RusynCelticCentral AmericanCentral American IndianCherokeeChileanChippewaChoctawColombianCosta RicanCreeCreekCroatianCrowCubanCzechCzechoslovakianDanishDelawareDominicanDutchDutch West IndianEastern EuropeanEcuadorianEgyptianEnglishEstonianEthiopianEuropeanFilipinoFinnishFrenchFrench American IndianFrench CanadianGermanGerman RussianGhanaianGreekGuamanian / ChamorroGuatemalanGuyaneseHaitianHonduranHungarianIcelanderIndian (Asian)IndonesianInupiatIranianIraqiIrishIroquoisIsraeliItalianJamaicanJapaneseJordanianKenyanKoreanLaotianLatvianLebaneseLiberianLithuanianLumbeeLuxembourgerMacedonianMalaysianMalteseMexicanMexican American IndianMongolianMoroccanNative HawaiianNavajoNew ZealanderNicaraguanNigerianNorthern EuropeanNorwegianPakistaniPalestinianPanamanianParaguayanPennsylvania GermanPeruvianPolishPortuguesePuerto RicanRomanianRussianSalvadoranSamoanScandinavianScotch-IrishScottishSeminoleSenegaleseSerbianSierra LeoneanSiouxSlavicSlovakSloveneSomaliSouth AfricanSouth AmericanSouth American IndianSpaniardSpanishSri LankanSubsaharan AfricanSudaneseSwedishSwissSyrianThaiTrinidadian and TobagonianTurkishUgandanUkrainianUruguayanVenezuelanVietnameseWelshWest IndianYaquiYugoslavianZimbabwean
Immigrant Origin (Total)
AfghanistanAfricaAlbaniaArgentinaArmeniaAsiaAustraliaBahamasBangladeshBarbadosBelarusBelgiumBelizeBosnia and HerzegovinaBrazilBulgariaBurma / MyanmarCambodiaCameroonCanadaCaribbeanCentral AmericaChileChinaColombiaCongoCosta RicaCubaCzechoslovakiaDominican RepublicEastern AfricaEastern AsiaEastern EuropeEcuadorEgyptEl SalvadorEnglandEritreaEthiopiaEuropeFranceGermanyGhanaGreeceGuatemalaGuyanaHaitiHondurasHong KongHungaryIndiaIndonesiaIranIraqIrelandIsraelItalyJamaicaJapanJordanKazakhstanKenyaKoreaKuwaitLaosLatin AmericaLatviaLebanonLiberiaLithuaniaMalaysiaMexicoMiddle AfricaMoroccoNepalNetherlandsNigeriaNorth MacedoniaNorthern AfricaNorthern EuropeOceaniaPakistanPanamaPeruPhilippinesPolandRomaniaRussiaSaudi ArabiaScotlandSenegalSerbiaSierra LeoneSingaporeSomaliaSouth AfricaSouth AmericaSouth Central AsiaSouth Eastern AsiaSouthern EuropeSpainSri LankaSudanSwitzerlandSyriaTaiwanThailandTrinidad and TobagoTurkeyUgandaUkraineUruguayUzbekistanVenezuelaVietnamWestern AfricaWestern AsiaWestern EuropeZaireZimbabwe
Immigrant Origin (Percentage)
AfghanistanAfricaAlbaniaArgentinaArmeniaAsiaAustraliaBahamasBangladeshBarbadosBelarusBelgiumBelizeBosnia and HerzegovinaBrazilBulgariaBurma / MyanmarCambodiaCameroonCanadaCaribbeanCentral AmericaChileChinaColombiaCongoCosta RicaCubaCzechoslovakiaDominican RepublicEastern AfricaEastern AsiaEastern EuropeEcuadorEgyptEl SalvadorEnglandEritreaEthiopiaEuropeFranceGermanyGhanaGreeceGuatemalaGuyanaHaitiHondurasHong KongHungaryIndiaIndonesiaIranIraqIrelandIsraelItalyJamaicaJapanJordanKazakhstanKenyaKoreaKuwaitLaosLatin AmericaLatviaLebanonLiberiaLithuaniaMalaysiaMexicoMiddle AfricaMoroccoNepalNetherlandsNigeriaNorth MacedoniaNorthern AfricaNorthern EuropeOceaniaPakistanPanamaPeruPhilippinesPolandRomaniaRussiaSaudi ArabiaScotlandSenegalSerbiaSierra LeoneSingaporeSomaliaSouth AfricaSouth AmericaSouth Central AsiaSouth Eastern AsiaSouthern EuropeSpainSri LankaSudanSwitzerlandSyriaTaiwanThailandTrinidad and TobagoTurkeyUgandaUkraineUruguayUzbekistanVenezuelaVietnamWestern AfricaWestern AsiaWestern EuropeZaireZimbabwe
Income
Income (Families)
Income (Households)
Poverty
Poverty (Families)
Unemployment
Employment Occupations
Employment Industries
Employer Class
Commute Time
Commute Means
School Enrollment
Education by Degree Field
Occupancy
Finances
Physical Characteristics
Columbus
Compare Zip Codes
Comparison Subject

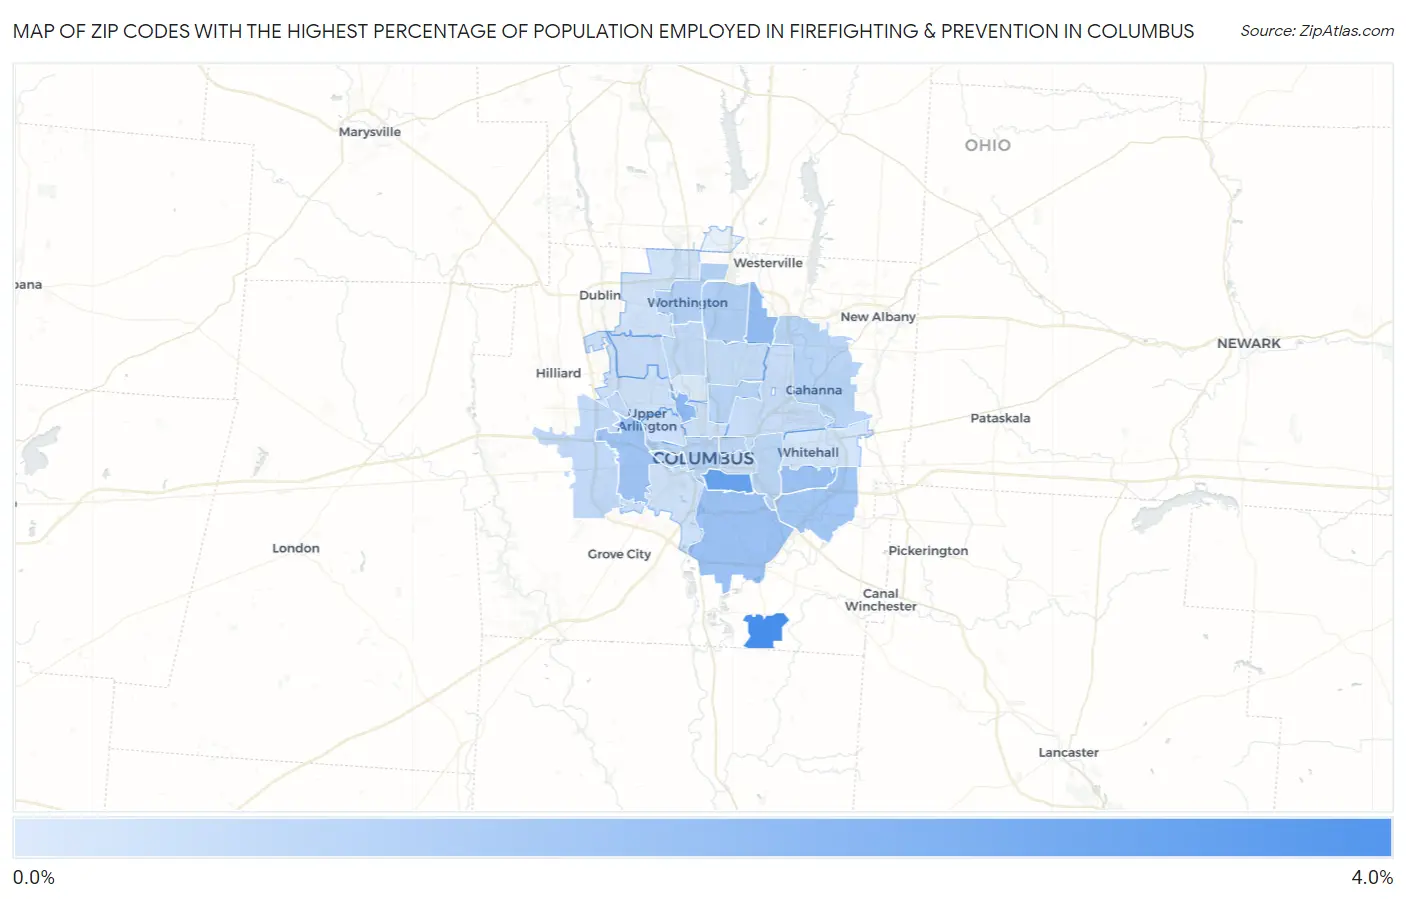
Map of Zip Codes with the Highest Percentage of Population Employed in Firefighting & Prevention in Columbus

0.0%
4.0%
Zip Codes with the Highest Percentage of Population Employed in Firefighting & Prevention in Columbus Map

Zip Codes with the Highest Percentage of Population Employed in Firefighting & Prevention in Columbus, OH

Zip Code % Employed vs State vs National
1.432173.9%1.1%(+2.88)#371.2%(+2.76)#1,387
2.432063.1%1.1%(+2.03)#551.2%(+1.91)#2,134
3.432102.1%1.1%(+1.03)#1191.2%(+0.913)#4,152
4.432312.0%1.1%(+0.948)#1281.2%(+0.829)#4,462
5.432071.8%1.1%(+0.751)#1481.2%(+0.631)#5,273
6.432271.8%1.1%(+0.745)#1511.2%(+0.625)#5,299
7.432041.7%1.1%(+0.606)#1831.2%(+0.486)#5,987
8.432321.6%1.1%(+0.510)#2031.2%(+0.390)#6,514
9.432291.3%1.1%(+0.198)#2801.2%(+0.078)#8,627
10.430851.1%1.1%(+0.073)#3281.2%(-0.047)#9,736
11.432301.0%1.1%(-0.033)#3741.2%(-0.153)#10,745
12.432111.0%1.1%(-0.058)#3891.2%(-0.178)#11,018
13.432151.0%1.1%(-0.061)#3901.2%(-0.180)#11,040
14.432090.96%1.1%(-0.102)#4181.2%(-0.221)#11,481
15.432030.94%1.1%(-0.121)#4271.2%(-0.241)#11,693
16.432220.93%1.1%(-0.138)#4341.2%(-0.258)#11,869
17.432280.83%1.1%(-0.232)#4781.2%(-0.352)#12,827
18.432140.80%1.1%(-0.268)#5021.2%(-0.388)#13,236
19.432240.74%1.1%(-0.323)#5231.2%(-0.443)#13,843
20.432200.69%1.1%(-0.373)#5521.2%(-0.493)#14,417
21.432190.67%1.1%(-0.397)#5641.2%(-0.517)#14,680
22.432010.57%1.1%(-0.498)#6081.2%(-0.618)#15,757
23.432120.57%1.1%(-0.499)#6101.2%(-0.619)#15,769
24.432050.55%1.1%(-0.518)#6221.2%(-0.637)#15,982
25.432210.49%1.1%(-0.576)#6481.2%(-0.696)#16,669
26.432230.49%1.1%(-0.579)#6501.2%(-0.698)#16,702
27.432350.44%1.1%(-0.626)#6761.2%(-0.746)#17,213
28.432130.37%1.1%(-0.694)#7031.2%(-0.814)#17,968
29.432020.17%1.1%(-0.900)#7681.2%(-1.02)#19,935

Common Questions

What are the Top 10 Zip Codes with the Highest Percentage of Population Employed in Firefighting & Prevention in Columbus, OH?
Top 10 Zip Codes with the Highest Percentage of Population Employed in Firefighting & Prevention in Columbus, OH are:
#1
3.9%
#2
3.1%
#3
2.1%
#4
2.0%
#5
1.8%
#6
1.8%
#7
1.7%
#8
1.6%
#9
1.3%
#10
1.1%
What zip code has the Highest Percentage of Population Employed in Firefighting & Prevention in Columbus, OH?
43217 has the Highest Percentage of Population Employed in Firefighting & Prevention in Columbus, OH with 3.9%.
What is the Percentage of Population Employed in Firefighting & Prevention in Columbus, OH?
Percentage of Population Employed in Firefighting & Prevention in Columbus is 1.2%.
What is the Percentage of Population Employed in Firefighting & Prevention in Ohio?
Percentage of Population Employed in Firefighting & Prevention in Ohio is 1.1%.
What is the Percentage of Population Employed in Firefighting & Prevention in the United States?
Percentage of Population Employed in Firefighting & Prevention in the United States is 1.2%.