Zip Codes with the Highest Percentage of Population with a Degree in Social Sciences in Billings, MT
RELATED REPORTS & OPTIONS
Social Sciences
Billings
Compare Zip Codes
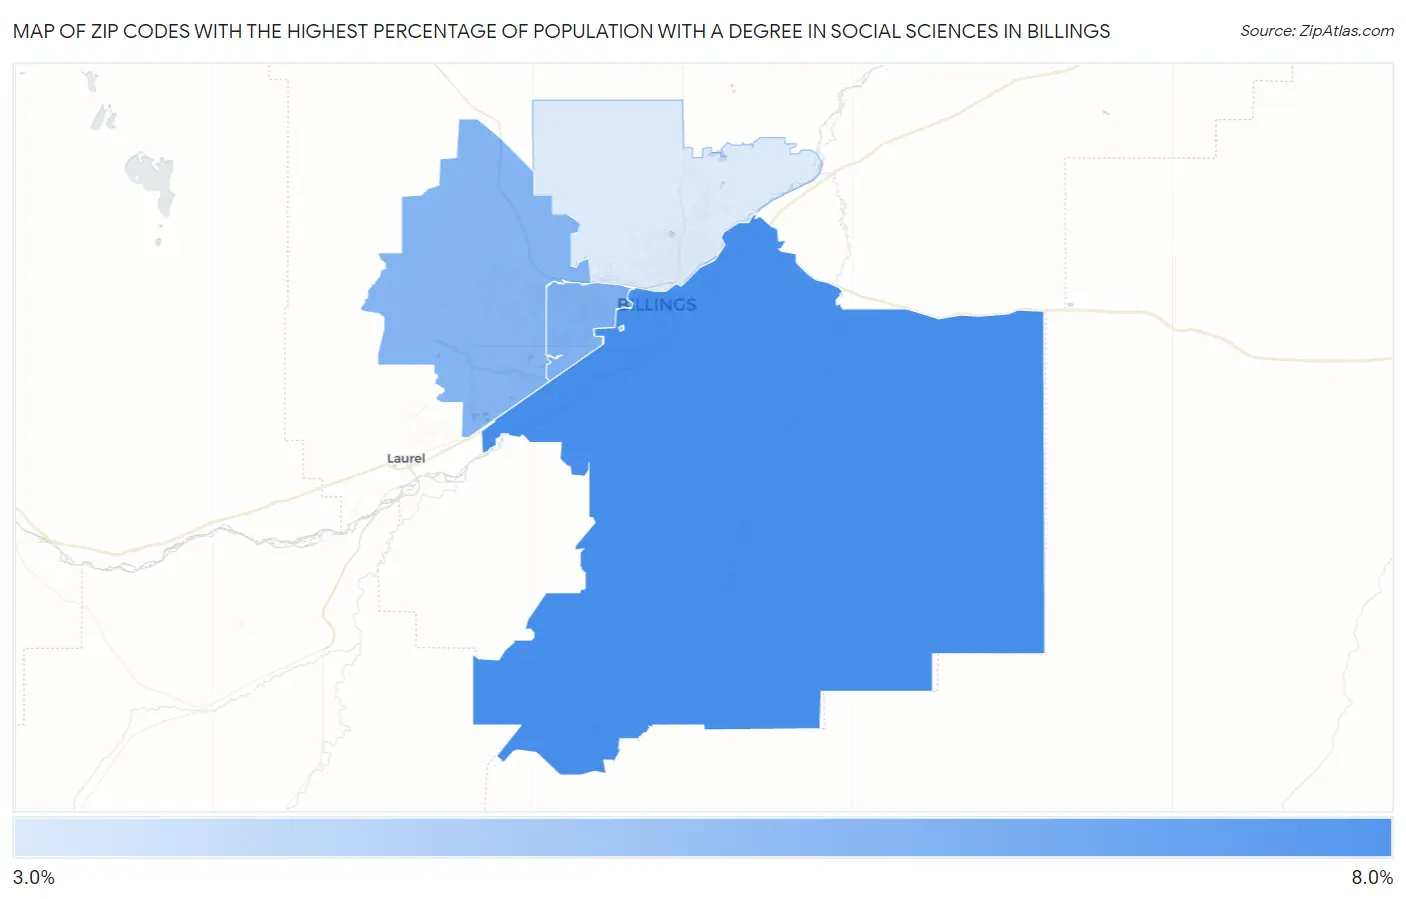
Map of Zip Codes with the Highest Percentage of Population with a Degree in Social Sciences in Billings
3.2%
7.9%
Zip Codes with the Highest Percentage of Population with a Degree in Social Sciences in Billings, MT
| Zip Code | % Graduates | vs State | vs National | |
| 1. | 59101 | 7.9% | 7.1%(+0.829)#78 | 8.1%(-0.146)#8,897 |
| 2. | 59102 | 6.2% | 7.1%(-0.930)#112 | 8.1%(-1.90)#12,933 |
| 3. | 59106 | 6.0% | 7.1%(-1.09)#115 | 8.1%(-2.07)#13,326 |
| 4. | 59105 | 3.2% | 7.1%(-3.88)#177 | 8.1%(-4.86)#19,907 |
1
Common Questions
What are the Top 3 Zip Codes with the Highest Percentage of Population with a Degree in Social Sciences in Billings, MT?
Top 3 Zip Codes with the Highest Percentage of Population with a Degree in Social Sciences in Billings, MT are:
What zip code has the Highest Percentage of Population with a Degree in Social Sciences in Billings, MT?
59101 has the Highest Percentage of Population with a Degree in Social Sciences in Billings, MT with 7.9%.
What is the Percentage of Population with a Degree in Social Sciences in Billings, MT?
Percentage of Population with a Degree in Social Sciences in Billings is 5.8%.
What is the Percentage of Population with a Degree in Social Sciences in Montana?
Percentage of Population with a Degree in Social Sciences in Montana is 7.1%.
What is the Percentage of Population with a Degree in Social Sciences in the United States?
Percentage of Population with a Degree in Social Sciences in the United States is 8.1%.