Zip Codes with the Highest Percentage of Families with Income Below $10,000 in Billings, MT
RELATED REPORTS & OPTIONS
Family Income | $0-10k
Billings
Compare Zip Codes
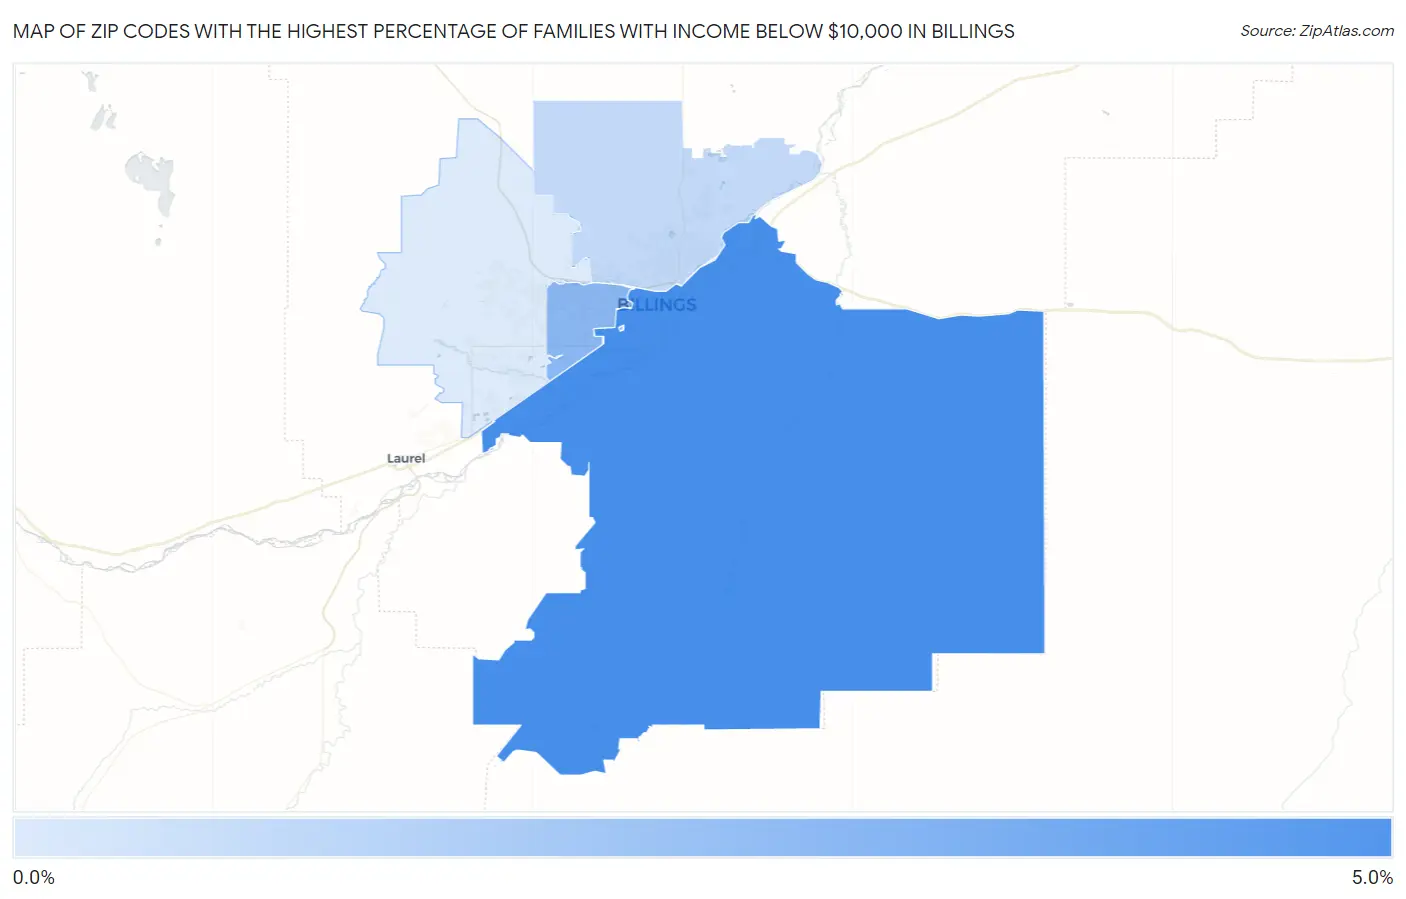
Map of Zip Codes with the Highest Percentage of Families with Income Below $10,000 in Billings
0.40%
4.2%
Zip Codes with the Highest Percentage of Families with Income Below $10,000 in Billings, MT
| Zip Code | Families with Income < $10k | vs State | vs National | |
| 1. | 59101 | 4.2% | 2.5%(+1.70)#79 | 3.1%(+1.10)#7,642 |
| 2. | 59102 | 2.5% | 2.5%(=0.000)#119 | 3.1%(-0.600)#13,037 |
| 3. | 59105 | 1.1% | 2.5%(-1.40)#159 | 3.1%(-2.00)#19,733 |
| 4. | 59106 | 0.40% | 2.5%(-2.10)#191 | 3.1%(-2.70)#23,052 |
1
Common Questions
What are the Top 3 Zip Codes with the Highest Percentage of Families with Income Below $10,000 in Billings, MT?
Top 3 Zip Codes with the Highest Percentage of Families with Income Below $10,000 in Billings, MT are:
What zip code has the Highest Percentage of Families with Income Below $10,000 in Billings, MT?
59101 has the Highest Percentage of Families with Income Below $10,000 in Billings, MT with 4.2%.
What is the Percentage of Families with Income Below $10,000 in Billings, MT?
Percentage of Families with Income Below $10,000 in Billings is 2.5%.
What is the Percentage of Families with Income Below $10,000 in Montana?
Percentage of Families with Income Below $10,000 in Montana is 2.5%.
What is the Percentage of Families with Income Below $10,000 in the United States?
Percentage of Families with Income Below $10,000 in the United States is 3.1%.