Zip Codes with the Highest Percentage of Population Taking Public Transit to Work in Billings, MT
RELATED REPORTS & OPTIONS
Public Transit
Billings
Compare Zip Codes
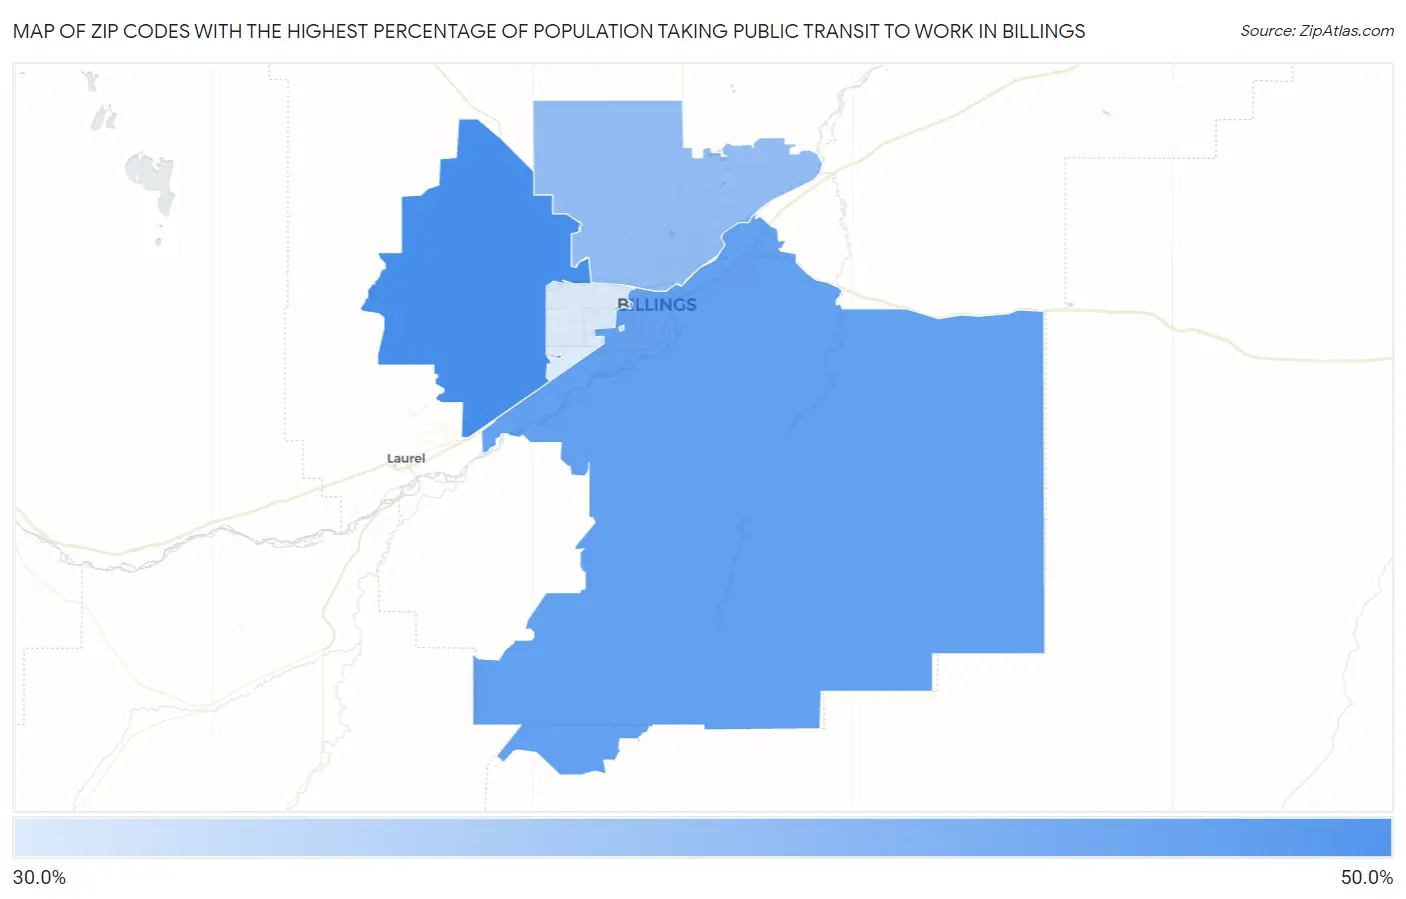
Map of Zip Codes with the Highest Percentage of Population Taking Public Transit to Work in Billings
32.3%
47.6%
Zip Codes with the Highest Percentage of Population Taking Public Transit to Work in Billings, MT
| Zip Code | % Public Transit | vs State | vs National | |
| 1. | 59106 | 47.6% | 39.4%(+8.20)#9 | 38.5%(+9.10)#2,068 |
| 2. | 59101 | 44.6% | 39.4%(+5.20)#12 | 38.5%(+6.10)#2,819 |
| 3. | 59105 | 39.8% | 39.4%(+0.400)#17 | 38.5%(+1.30)#4,254 |
| 4. | 59102 | 32.3% | 39.4%(-7.10)#20 | 38.5%(-6.20)#6,378 |
1
Common Questions
What are the Top 3 Zip Codes with the Highest Percentage of Population Taking Public Transit to Work in Billings, MT?
Top 3 Zip Codes with the Highest Percentage of Population Taking Public Transit to Work in Billings, MT are:
What zip code has the Highest Percentage of Population Taking Public Transit to Work in Billings, MT?
59106 has the Highest Percentage of Population Taking Public Transit to Work in Billings, MT with 47.6%.
What is the Percentage of Population Taking Public Transit to Work in Billings, MT?
Percentage of Population Taking Public Transit to Work in Billings is 44.1%.
What is the Percentage of Population Taking Public Transit to Work in Montana?
Percentage of Population Taking Public Transit to Work in Montana is 39.4%.
What is the Percentage of Population Taking Public Transit to Work in the United States?
Percentage of Population Taking Public Transit to Work in the United States is 38.5%.