Zip Codes with the Highest Percentage of Households with Income Below $10,000 in Billings, MT
RELATED REPORTS & OPTIONS
Household Income | $0-10k
Billings
Compare Zip Codes
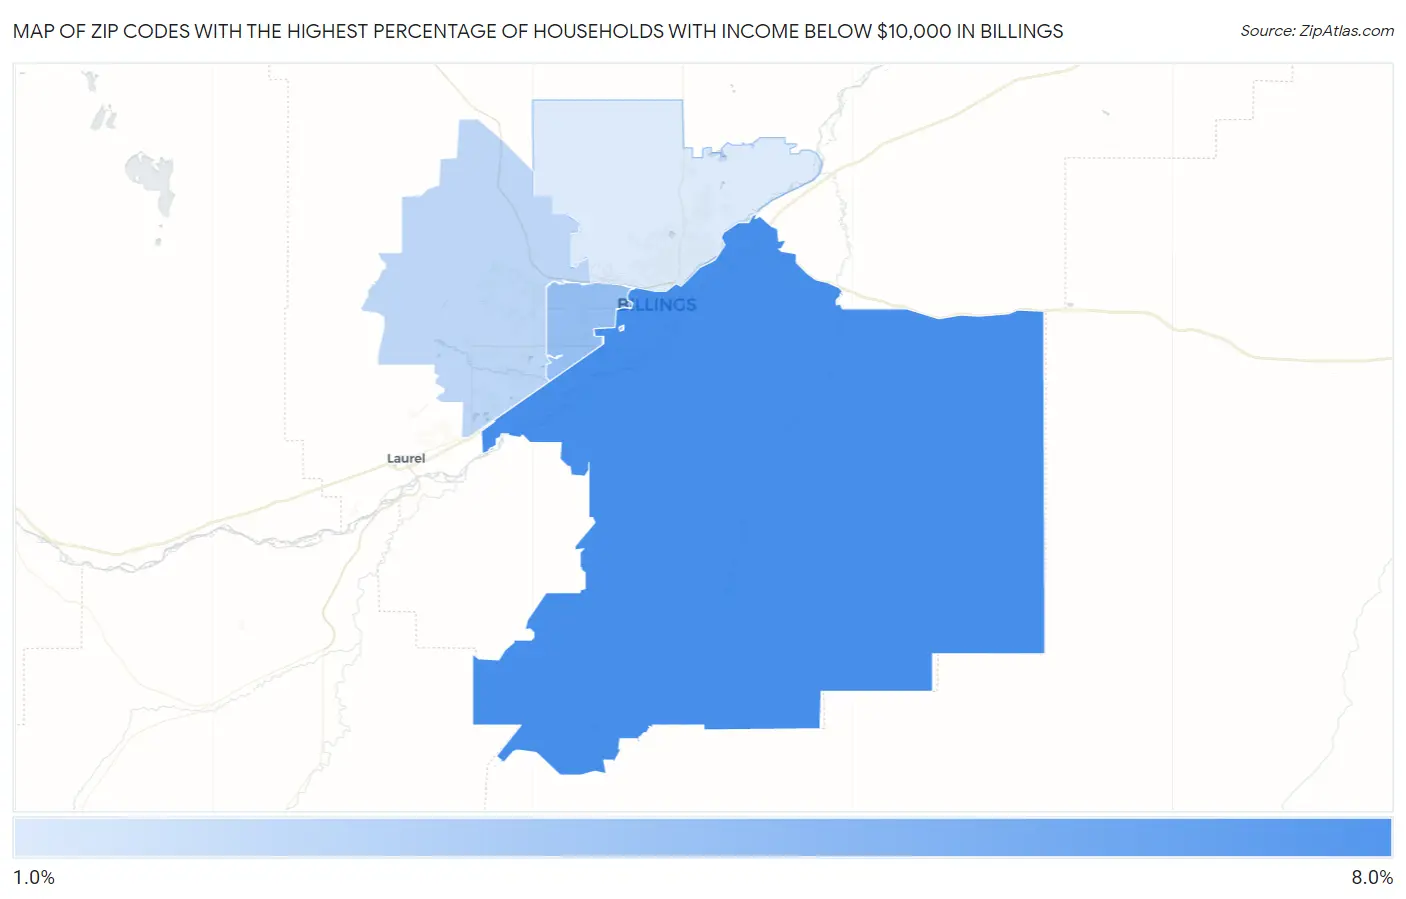
Map of Zip Codes with the Highest Percentage of Households with Income Below $10,000 in Billings
1.7%
6.1%
Zip Codes with the Highest Percentage of Households with Income Below $10,000 in Billings, MT
| Zip Code | Households with Income < $10k | vs State | vs National | |
| 1. | 59101 | 6.1% | 4.6%(+1.50)#107 | 4.9%(+1.20)#8,723 |
| 2. | 59102 | 3.8% | 4.6%(-0.800)#177 | 4.9%(-1.10)#15,978 |
| 3. | 59106 | 2.6% | 4.6%(-2.00)#212 | 4.9%(-2.30)#21,165 |
| 4. | 59105 | 1.7% | 4.6%(-2.90)#249 | 4.9%(-3.20)#24,700 |
1
Common Questions
What are the Top 3 Zip Codes with the Highest Percentage of Households with Income Below $10,000 in Billings, MT?
Top 3 Zip Codes with the Highest Percentage of Households with Income Below $10,000 in Billings, MT are:
What zip code has the Highest Percentage of Households with Income Below $10,000 in Billings, MT?
59101 has the Highest Percentage of Households with Income Below $10,000 in Billings, MT with 6.1%.
What is the Percentage of Households with Income Below $10,000 in Billings, MT?
Percentage of Households with Income Below $10,000 in Billings is 4.1%.
What is the Percentage of Households with Income Below $10,000 in Montana?
Percentage of Households with Income Below $10,000 in Montana is 4.6%.
What is the Percentage of Households with Income Below $10,000 in the United States?
Percentage of Households with Income Below $10,000 in the United States is 4.9%.