Zip Codes with the Most Immigrants from Kenya in Berrien Springs, MI
RELATED REPORTS & OPTIONS
Kenya
Berrien Springs
Compare Zip Codes
Map of Zip Codes with the Most Immigrants from Kenya in Berrien Springs
6
81
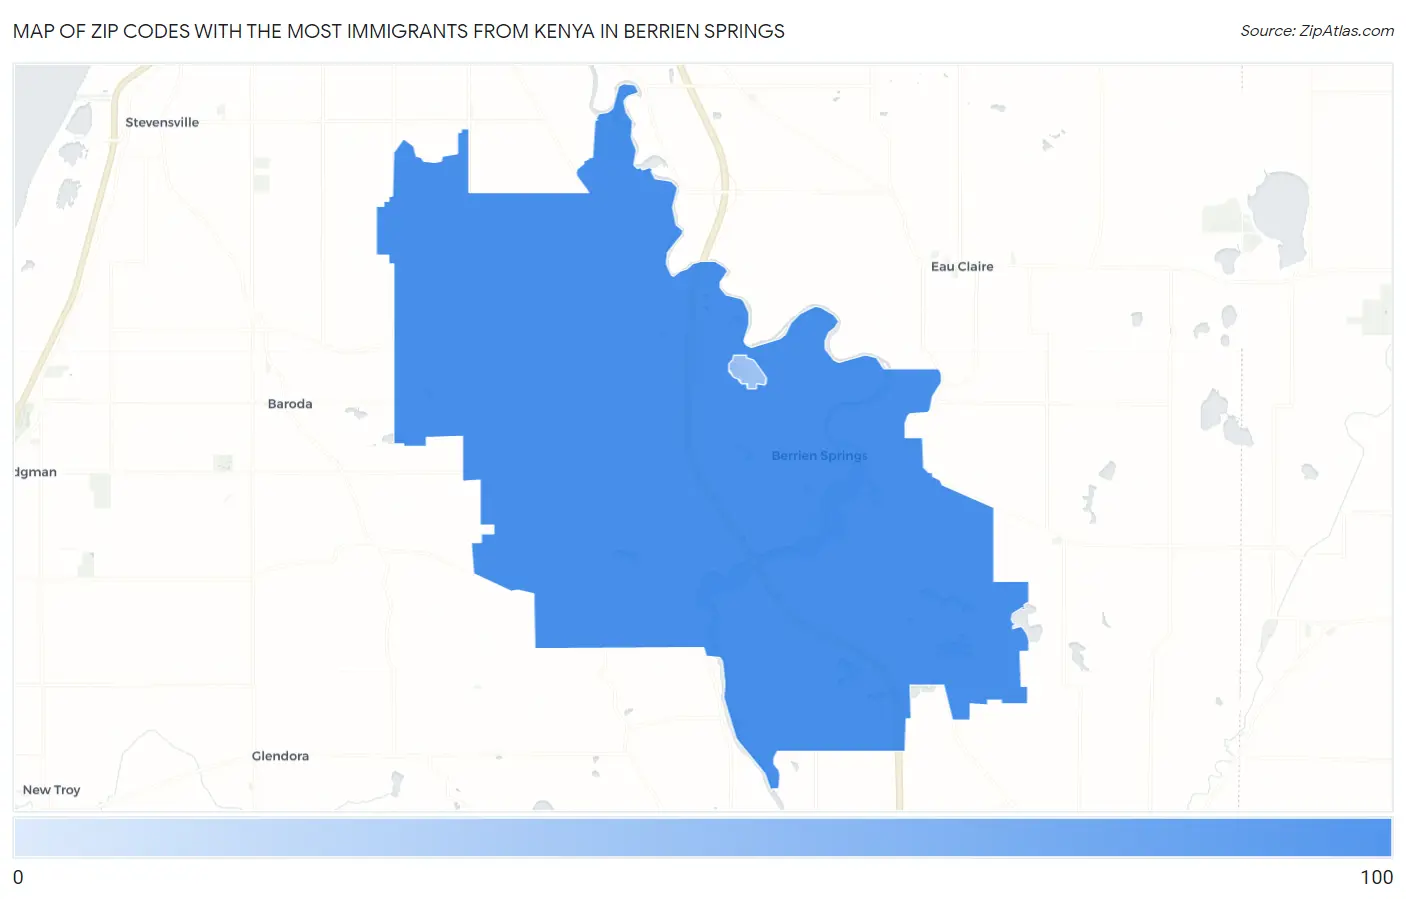
Zip Codes with the Most Immigrants from Kenya in Berrien Springs, MI
| Zip Code | Kenya | vs State | vs National | |
| 1. | 49103 | 81 | 1,965(4.12%)#5 | 158,590(0.05%)#525 |
| 2. | 49104 | 6 | 1,965(0.31%)#62 | 158,590(0.00%)#2,522 |
1
Common Questions
What are the Top Zip Codes with the Most Immigrants from Kenya in Berrien Springs, MI?
Top Zip Codes with the Most Immigrants from Kenya in Berrien Springs, MI are:
What zip code has the Most Immigrants from Kenya in Berrien Springs, MI?
49103 has the Most Immigrants from Kenya in Berrien Springs, MI with 81.
What is the Total Immigrants from Kenya in Berrien Springs, MI?
Total Immigrants from Kenya in Berrien Springs is 28.
What is the Total Immigrants from Kenya in Michigan?
Total Immigrants from Kenya in Michigan is 1,965.
What is the Total Immigrants from Kenya in the United States?
Total Immigrants from Kenya in the United States is 158,590.