Zip Codes with the Most Immigrants from Korea in Berrien Springs, MI
RELATED REPORTS & OPTIONS
Korea
Berrien Springs
Compare Zip Codes
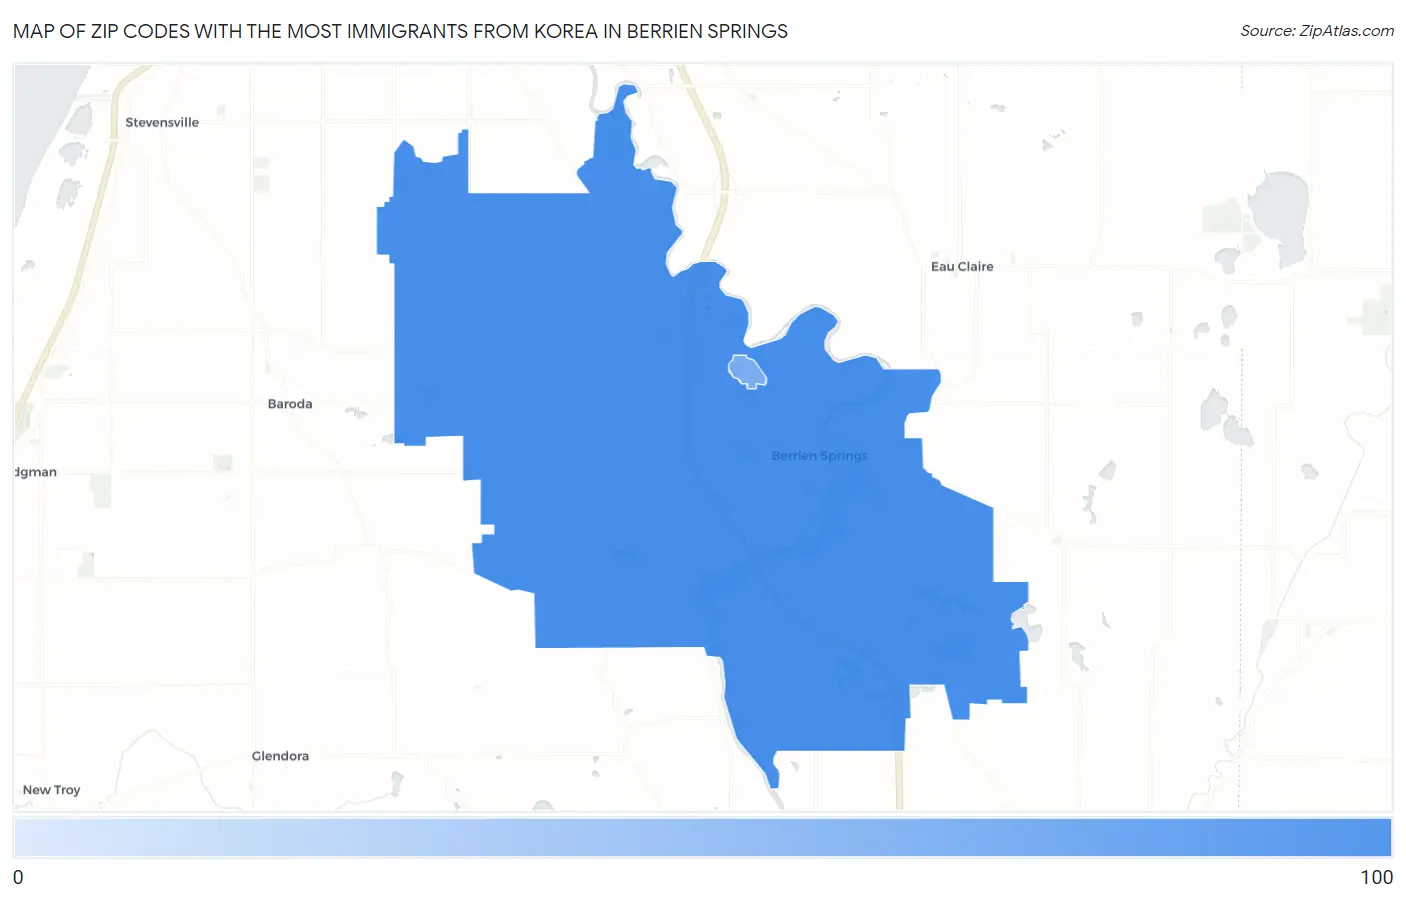
Map of Zip Codes with the Most Immigrants from Korea in Berrien Springs
19
89
Zip Codes with the Most Immigrants from Korea in Berrien Springs, MI
| Zip Code | Korea | vs State | vs National | |
| 1. | 49103 | 89 | 20,884(0.43%)#60 | 1,034,299(0.01%)#2,427 |
| 2. | 49104 | 19 | 20,884(0.09%)#185 | 1,034,299(0.00%)#5,855 |
1
Common Questions
What are the Top Zip Codes with the Most Immigrants from Korea in Berrien Springs, MI?
Top Zip Codes with the Most Immigrants from Korea in Berrien Springs, MI are:
What zip code has the Most Immigrants from Korea in Berrien Springs, MI?
49103 has the Most Immigrants from Korea in Berrien Springs, MI with 89.
What is the Total Immigrants from Korea in Berrien Springs, MI?
Total Immigrants from Korea in Berrien Springs is 64.
What is the Total Immigrants from Korea in Michigan?
Total Immigrants from Korea in Michigan is 20,884.
What is the Total Immigrants from Korea in the United States?
Total Immigrants from Korea in the United States is 1,034,299.