Zip Codes with the Highest Percentage of Population with a Degree in Physical and Health Sciences in Gretna, LA
RELATED REPORTS & OPTIONS
Physical and Health Sciences
Gretna
Compare Zip Codes
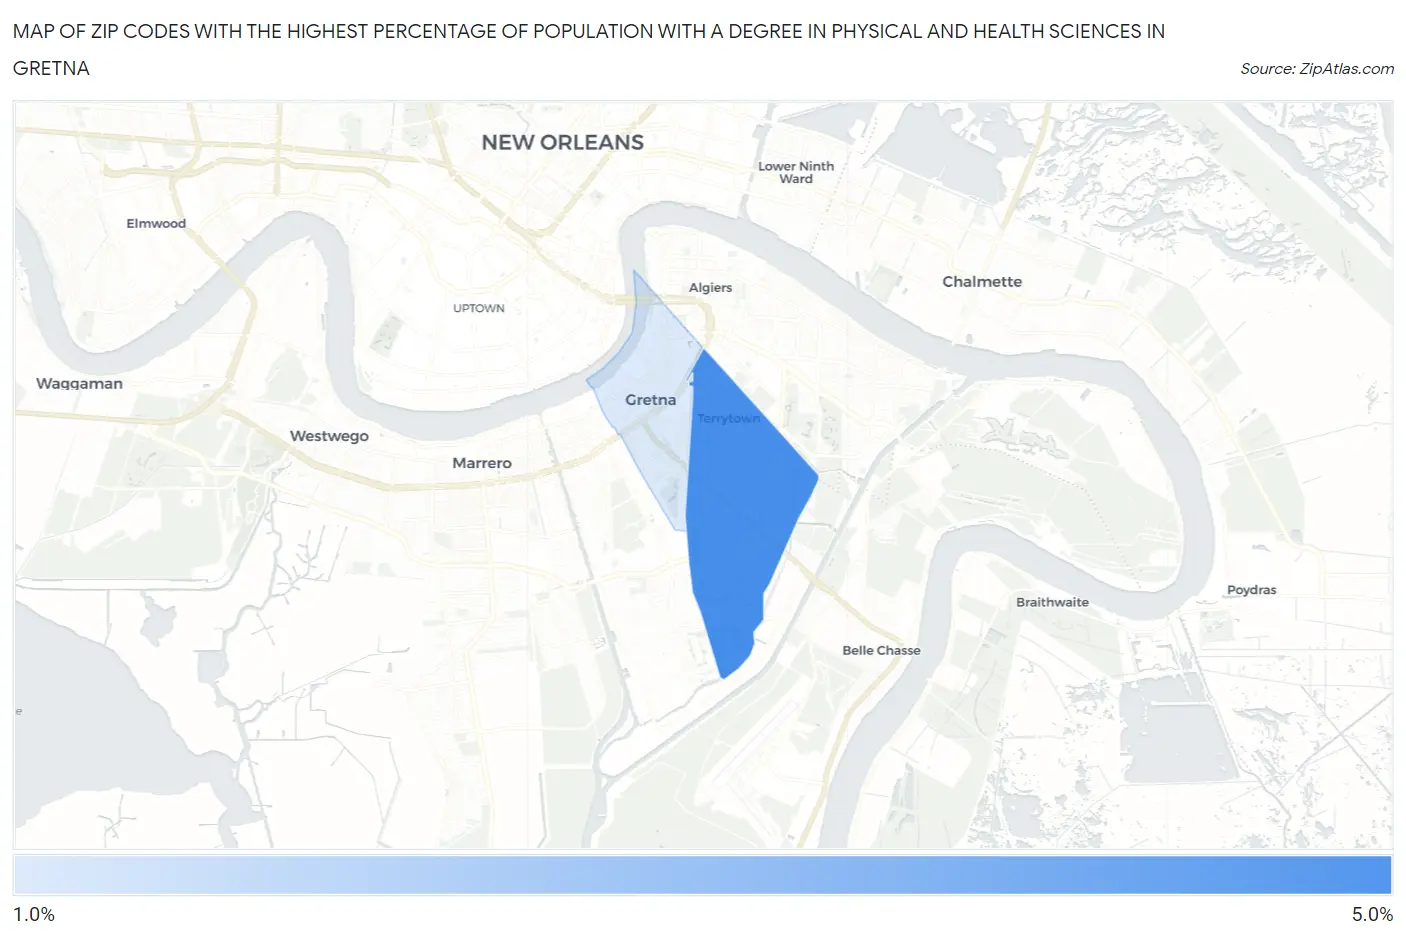
Map of Zip Codes with the Highest Percentage of Population with a Degree in Physical and Health Sciences in Gretna
1.6%
4.7%
Zip Codes with the Highest Percentage of Population with a Degree in Physical and Health Sciences in Gretna, LA
| Zip Code | % Graduates | vs State | vs National | |
| 1. | 70056 | 4.7% | 3.1%(+1.60)#76 | 3.1%(+1.59)#5,146 |
| 2. | 70053 | 1.6% | 3.1%(-1.46)#207 | 3.1%(-1.48)#16,779 |
1
Common Questions
What are the Top Zip Codes with the Highest Percentage of Population with a Degree in Physical and Health Sciences in Gretna, LA?
Top Zip Codes with the Highest Percentage of Population with a Degree in Physical and Health Sciences in Gretna, LA are:
What zip code has the Highest Percentage of Population with a Degree in Physical and Health Sciences in Gretna, LA?
70056 has the Highest Percentage of Population with a Degree in Physical and Health Sciences in Gretna, LA with 4.7%.
What is the Percentage of Population with a Degree in Physical and Health Sciences in Gretna, LA?
Percentage of Population with a Degree in Physical and Health Sciences in Gretna is 1.4%.
What is the Percentage of Population with a Degree in Physical and Health Sciences in Louisiana?
Percentage of Population with a Degree in Physical and Health Sciences in Louisiana is 3.1%.
What is the Percentage of Population with a Degree in Physical and Health Sciences in the United States?
Percentage of Population with a Degree in Physical and Health Sciences in the United States is 3.1%.