Zip Codes with the Highest Percentage of Households Without a Vehicle in Gretna, LA
RELATED REPORTS & OPTIONS
Households without a Cars
Gretna
Compare Zip Codes
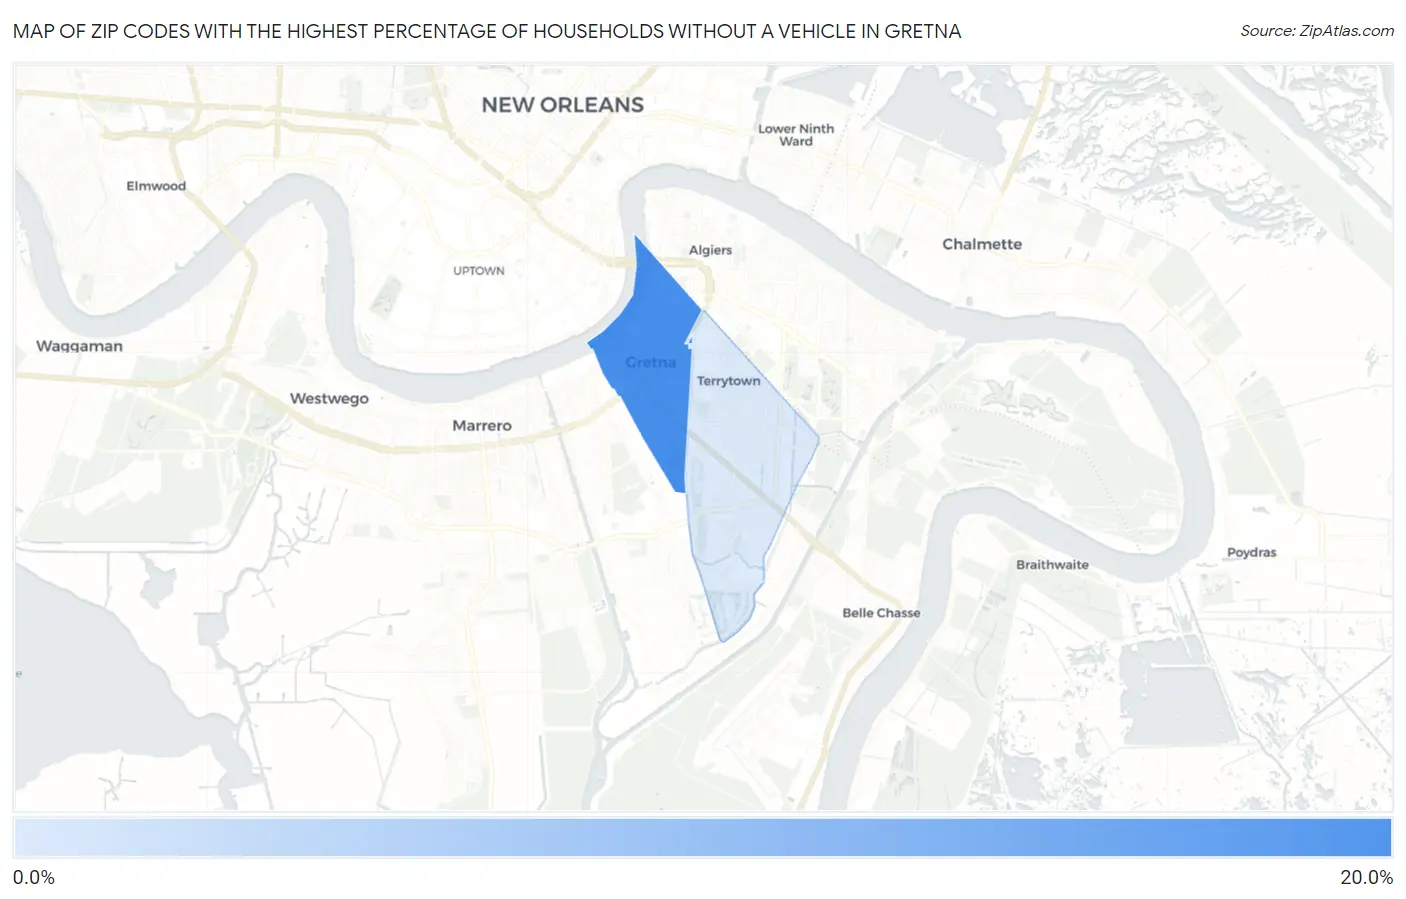
Map of Zip Codes with the Highest Percentage of Households Without a Vehicle in Gretna
7.4%
18.2%
Zip Codes with the Highest Percentage of Households Without a Vehicle in Gretna, LA
| Zip Code | Housholds Without a Car | vs State | vs National | |
| 1. | 70053 | 18.2% | 8.3%(+9.90)#41 | 8.3%(+9.90)#1,751 |
| 2. | 70056 | 7.4% | 8.3%(-0.900)#212 | 8.3%(-0.900)#7,850 |
1
Common Questions
What are the Top Zip Codes with the Highest Percentage of Households Without a Vehicle in Gretna, LA?
Top Zip Codes with the Highest Percentage of Households Without a Vehicle in Gretna, LA are:
What zip code has the Highest Percentage of Households Without a Vehicle in Gretna, LA?
70053 has the Highest Percentage of Households Without a Vehicle in Gretna, LA with 18.2%.
What is the Percentage of Households Without a Vehicle in Gretna, LA?
Percentage of Households Without a Vehicle in Gretna is 17.4%.
What is the Percentage of Households Without a Vehicle in Louisiana?
Percentage of Households Without a Vehicle in Louisiana is 8.3%.
What is the Percentage of Households Without a Vehicle in the United States?
Percentage of Households Without a Vehicle in the United States is 8.3%.