Zip Codes with the Highest Percentage of Population Employed in Health Diagnosing & Treating in Gretna, LA
RELATED REPORTS & OPTIONS
Health Diagnosing & Treating
Gretna
Compare Zip Codes
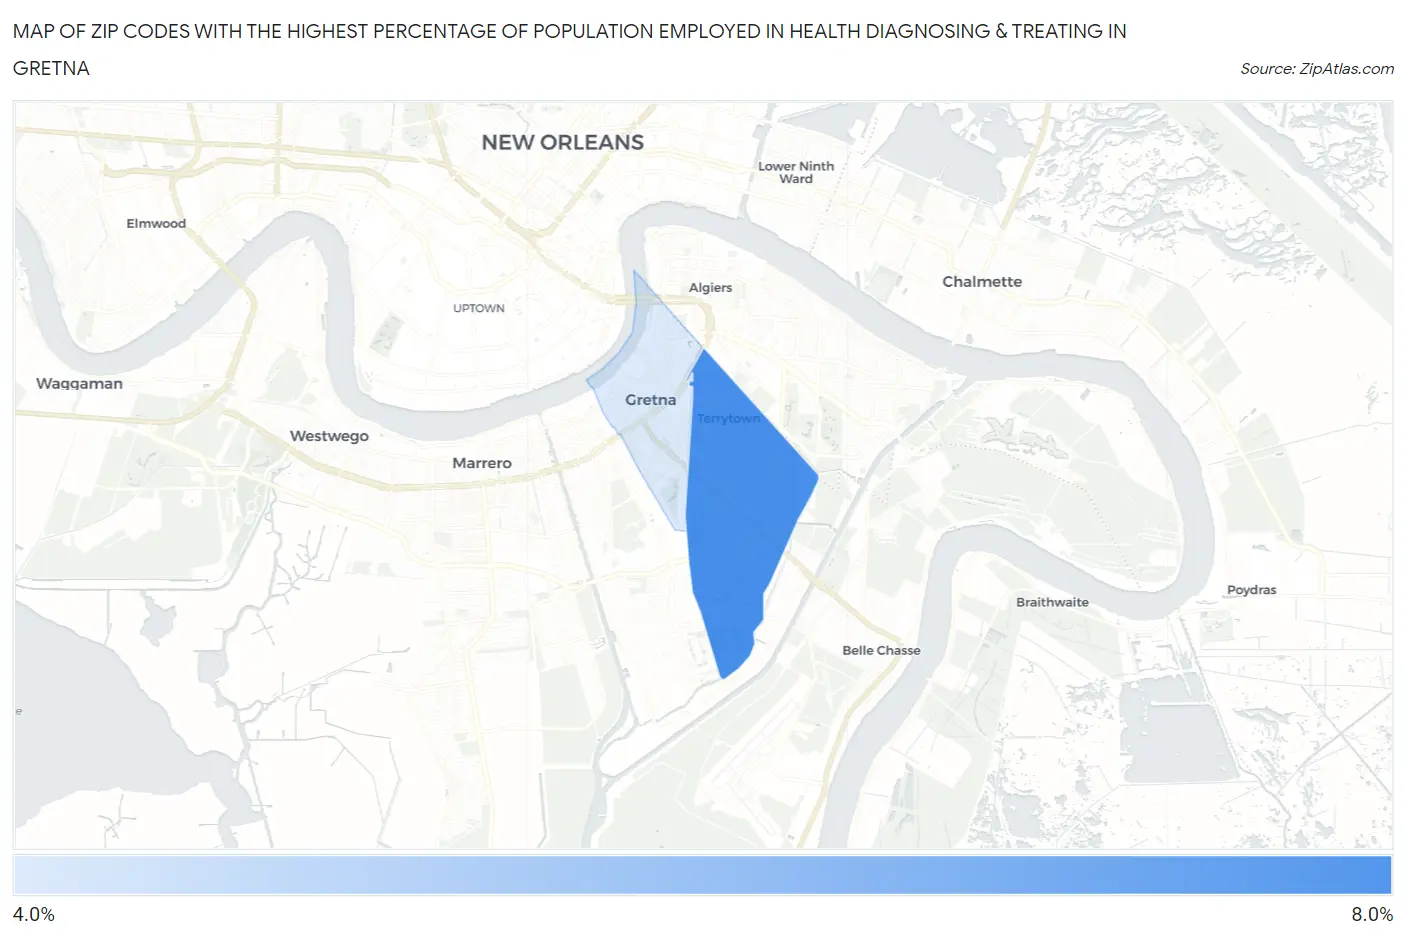
Map of Zip Codes with the Highest Percentage of Population Employed in Health Diagnosing & Treating in Gretna
4.3%
6.0%
Zip Codes with the Highest Percentage of Population Employed in Health Diagnosing & Treating in Gretna, LA
| Zip Code | % Employed | vs State | vs National | |
| 1. | 70056 | 6.0% | 7.2%(-1.15)#252 | 6.2%(-0.229)#13,815 |
| 2. | 70053 | 4.3% | 7.2%(-2.86)#345 | 6.2%(-1.94)#20,316 |
1
Common Questions
What are the Top Zip Codes with the Highest Percentage of Population Employed in Health Diagnosing & Treating in Gretna, LA?
Top Zip Codes with the Highest Percentage of Population Employed in Health Diagnosing & Treating in Gretna, LA are:
What zip code has the Highest Percentage of Population Employed in Health Diagnosing & Treating in Gretna, LA?
70056 has the Highest Percentage of Population Employed in Health Diagnosing & Treating in Gretna, LA with 6.0%.
What is the Percentage of Population Employed in Health Diagnosing & Treating in Gretna, LA?
Percentage of Population Employed in Health Diagnosing & Treating in Gretna is 5.9%.
What is the Percentage of Population Employed in Health Diagnosing & Treating in Louisiana?
Percentage of Population Employed in Health Diagnosing & Treating in Louisiana is 7.2%.
What is the Percentage of Population Employed in Health Diagnosing & Treating in the United States?
Percentage of Population Employed in Health Diagnosing & Treating in the United States is 6.2%.