Zip Codes with the Highest Percentage of Population with a Degree in Business in Gretna, LA
RELATED REPORTS & OPTIONS
Business
Gretna
Compare Zip Codes
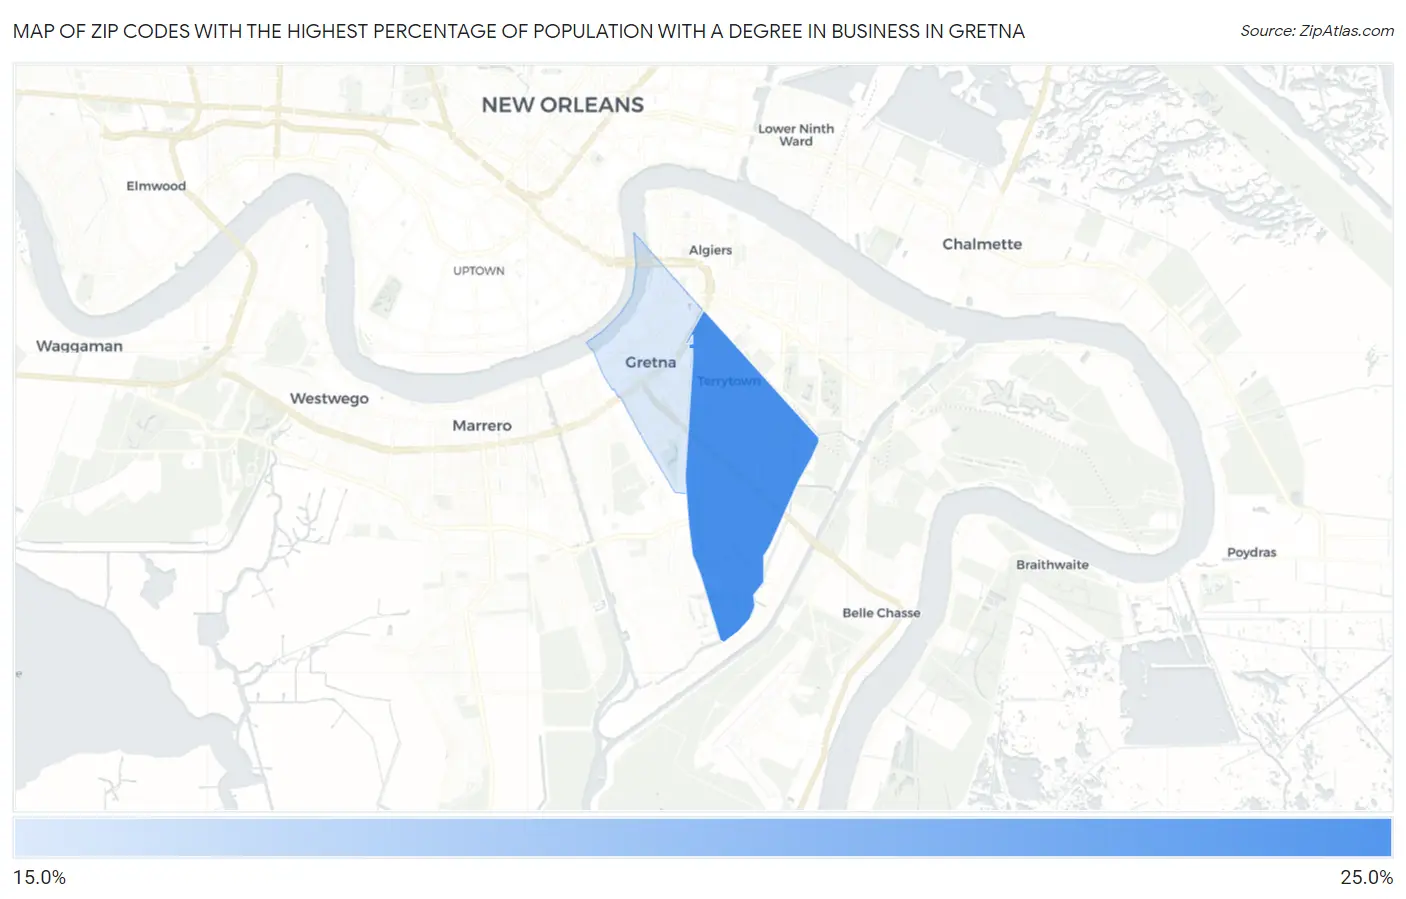
Map of Zip Codes with the Highest Percentage of Population with a Degree in Business in Gretna
21.6%
23.5%
Zip Codes with the Highest Percentage of Population with a Degree in Business in Gretna, LA
| Zip Code | % Graduates | vs State | vs National | |
| 1. | 70056 | 23.5% | 18.9%(+4.55)#105 | 19.5%(+3.98)#7,147 |
| 2. | 70053 | 21.6% | 18.9%(+2.65)#132 | 19.5%(+2.09)#9,361 |
1
Common Questions
What are the Top Zip Codes with the Highest Percentage of Population with a Degree in Business in Gretna, LA?
Top Zip Codes with the Highest Percentage of Population with a Degree in Business in Gretna, LA are:
What zip code has the Highest Percentage of Population with a Degree in Business in Gretna, LA?
70056 has the Highest Percentage of Population with a Degree in Business in Gretna, LA with 23.5%.
What is the Percentage of Population with a Degree in Business in Gretna, LA?
Percentage of Population with a Degree in Business in Gretna is 21.5%.
What is the Percentage of Population with a Degree in Business in Louisiana?
Percentage of Population with a Degree in Business in Louisiana is 18.9%.
What is the Percentage of Population with a Degree in Business in the United States?
Percentage of Population with a Degree in Business in the United States is 19.5%.