Zip Codes with the Highest Percentage of Population Employed in Office & Administration in Gretna, LA
RELATED REPORTS & OPTIONS
Office & Administration
Gretna
Compare Zip Codes
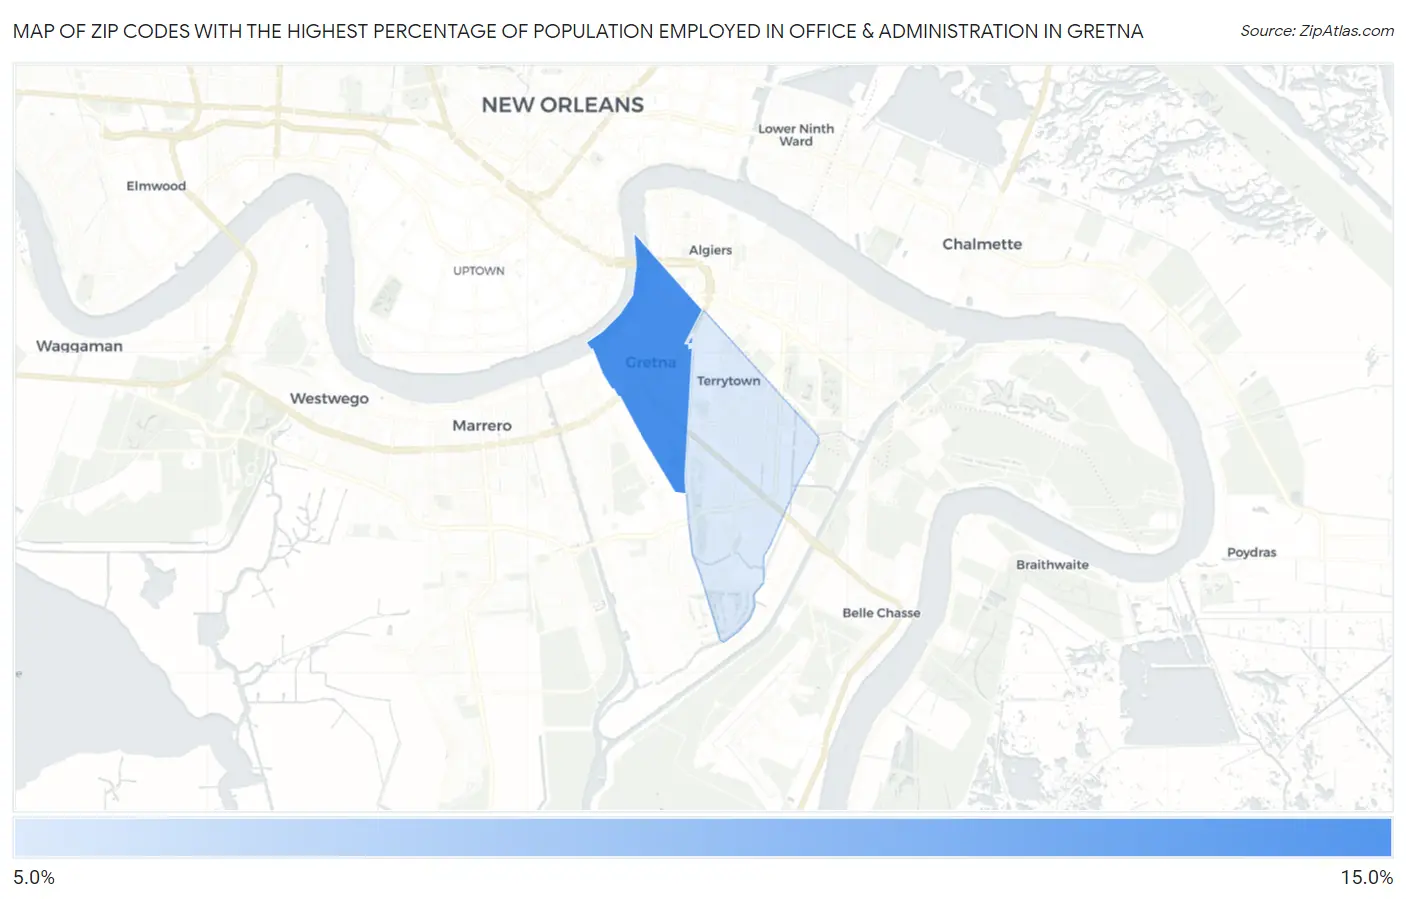
Map of Zip Codes with the Highest Percentage of Population Employed in Office & Administration in Gretna
9.1%
12.7%
Zip Codes with the Highest Percentage of Population Employed in Office & Administration in Gretna, LA
| Zip Code | % Employed | vs State | vs National | |
| 1. | 70053 | 12.7% | 10.6%(+2.08)#152 | 10.9%(+1.82)#8,839 |
| 2. | 70056 | 9.1% | 10.6%(-1.48)#304 | 10.9%(-1.73)#19,866 |
1
Common Questions
What are the Top Zip Codes with the Highest Percentage of Population Employed in Office & Administration in Gretna, LA?
Top Zip Codes with the Highest Percentage of Population Employed in Office & Administration in Gretna, LA are:
What zip code has the Highest Percentage of Population Employed in Office & Administration in Gretna, LA?
70053 has the Highest Percentage of Population Employed in Office & Administration in Gretna, LA with 12.7%.
What is the Percentage of Population Employed in Office & Administration in Gretna, LA?
Percentage of Population Employed in Office & Administration in Gretna is 12.0%.
What is the Percentage of Population Employed in Office & Administration in Louisiana?
Percentage of Population Employed in Office & Administration in Louisiana is 10.6%.
What is the Percentage of Population Employed in Office & Administration in the United States?
Percentage of Population Employed in Office & Administration in the United States is 10.9%.