Zip Codes with the Highest Percentage of Population Employed in Installation, Maintenance & Repair in Gretna, LA
RELATED REPORTS & OPTIONS
Installation, Maintenance & Repair
Gretna
Compare Zip Codes
Map of Zip Codes with the Highest Percentage of Population Employed in Installation, Maintenance & Repair in Gretna
4.4%
4.7%
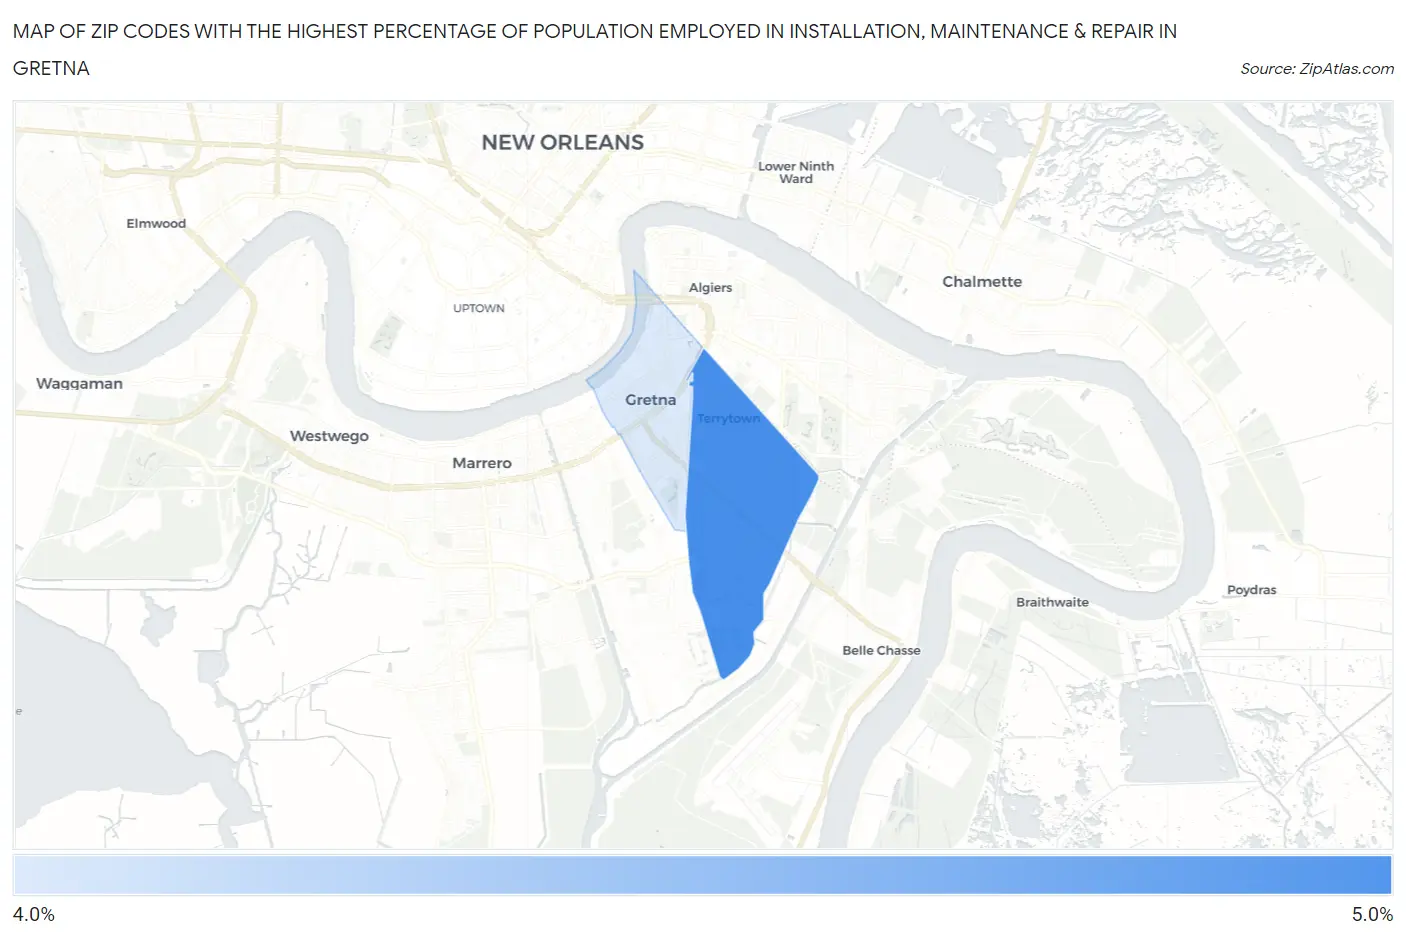
Zip Codes with the Highest Percentage of Population Employed in Installation, Maintenance & Repair in Gretna, LA
| Zip Code | % Employed | vs State | vs National | |
| 1. | 70056 | 4.7% | 3.7%(+0.998)#197 | 3.1%(+1.61)#9,761 |
| 2. | 70053 | 4.4% | 3.7%(+0.726)#212 | 3.1%(+1.34)#10,744 |
1
Common Questions
What are the Top Zip Codes with the Highest Percentage of Population Employed in Installation, Maintenance & Repair in Gretna, LA?
Top Zip Codes with the Highest Percentage of Population Employed in Installation, Maintenance & Repair in Gretna, LA are:
What zip code has the Highest Percentage of Population Employed in Installation, Maintenance & Repair in Gretna, LA?
70056 has the Highest Percentage of Population Employed in Installation, Maintenance & Repair in Gretna, LA with 4.7%.
What is the Percentage of Population Employed in Installation, Maintenance & Repair in Gretna, LA?
Percentage of Population Employed in Installation, Maintenance & Repair in Gretna is 4.3%.
What is the Percentage of Population Employed in Installation, Maintenance & Repair in Louisiana?
Percentage of Population Employed in Installation, Maintenance & Repair in Louisiana is 3.7%.
What is the Percentage of Population Employed in Installation, Maintenance & Repair in the United States?
Percentage of Population Employed in Installation, Maintenance & Repair in the United States is 3.1%.