Zip Codes with the Highest Percentage of Population Employed in Installation, Maintenance & Repair in Olathe, KS
RELATED REPORTS & OPTIONS
Installation, Maintenance & Repair
Olathe
Compare Zip Codes
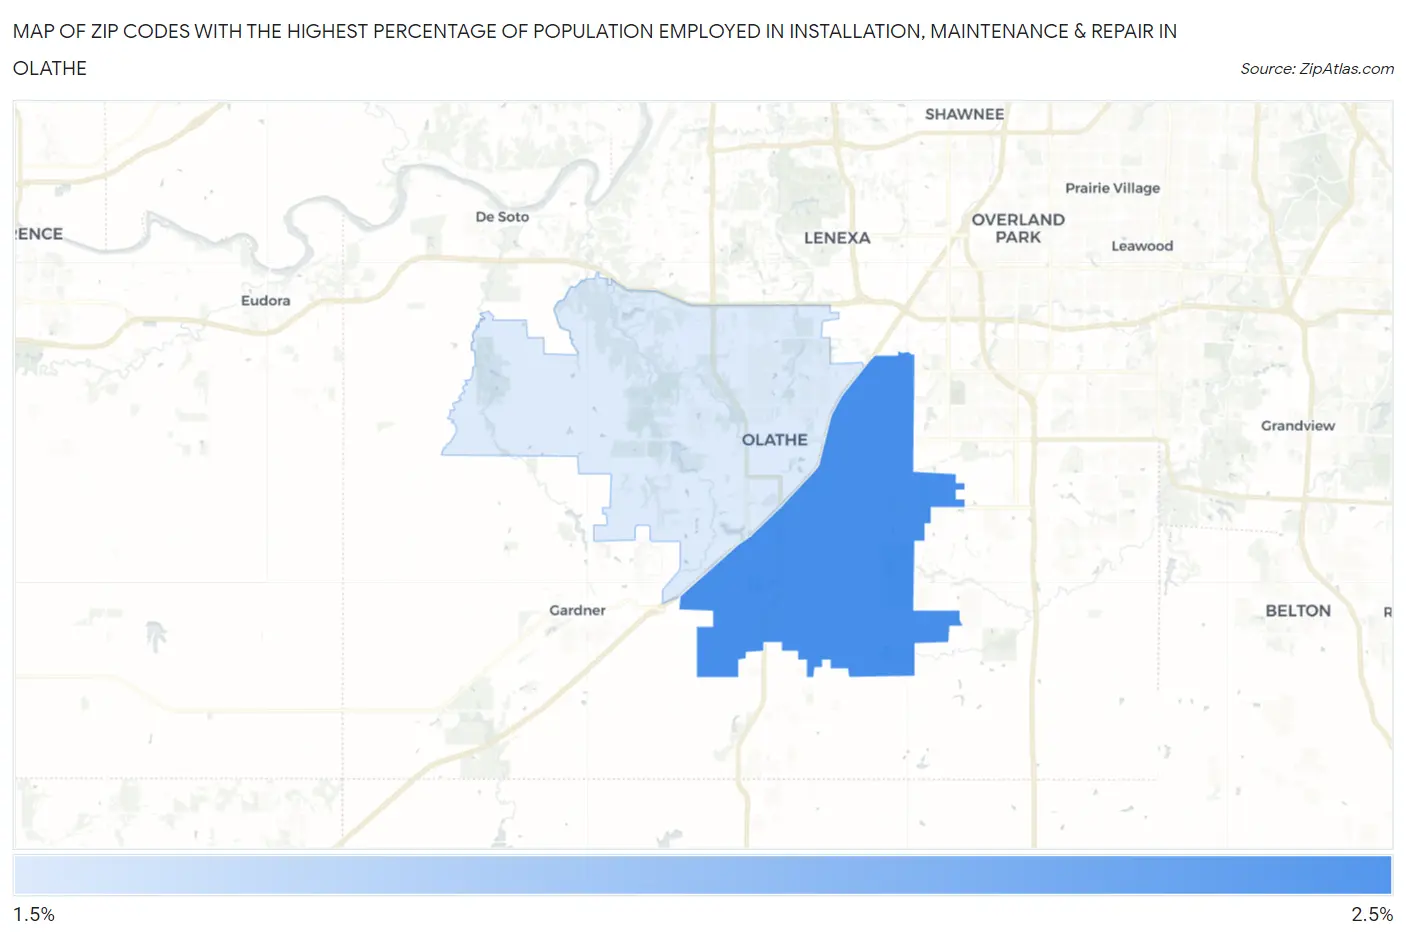
Map of Zip Codes with the Highest Percentage of Population Employed in Installation, Maintenance & Repair in Olathe
2.0%
2.4%
Zip Codes with the Highest Percentage of Population Employed in Installation, Maintenance & Repair in Olathe, KS
| Zip Code | % Employed | vs State | vs National | |
| 1. | 66062 | 2.4% | 3.6%(-1.22)#461 | 3.1%(-0.666)#20,052 |
| 2. | 66061 | 2.0% | 3.6%(-1.64)#487 | 3.1%(-1.09)#22,123 |
1
Common Questions
What are the Top Zip Codes with the Highest Percentage of Population Employed in Installation, Maintenance & Repair in Olathe, KS?
Top Zip Codes with the Highest Percentage of Population Employed in Installation, Maintenance & Repair in Olathe, KS are:
What zip code has the Highest Percentage of Population Employed in Installation, Maintenance & Repair in Olathe, KS?
66062 has the Highest Percentage of Population Employed in Installation, Maintenance & Repair in Olathe, KS with 2.4%.
What is the Percentage of Population Employed in Installation, Maintenance & Repair in Olathe, KS?
Percentage of Population Employed in Installation, Maintenance & Repair in Olathe is 2.2%.
What is the Percentage of Population Employed in Installation, Maintenance & Repair in Kansas?
Percentage of Population Employed in Installation, Maintenance & Repair in Kansas is 3.6%.
What is the Percentage of Population Employed in Installation, Maintenance & Repair in the United States?
Percentage of Population Employed in Installation, Maintenance & Repair in the United States is 3.1%.