Ukrainian vs Italian Male Disability
COMPARE
Ukrainian
Italian
Male Disability
Male Disability Comparison
Ukrainians
Italians
11.5%
MALE DISABILITY
10.6/ 100
METRIC RATING
206th/ 347
METRIC RANK
11.9%
MALE DISABILITY
1.2/ 100
METRIC RATING
239th/ 347
METRIC RANK
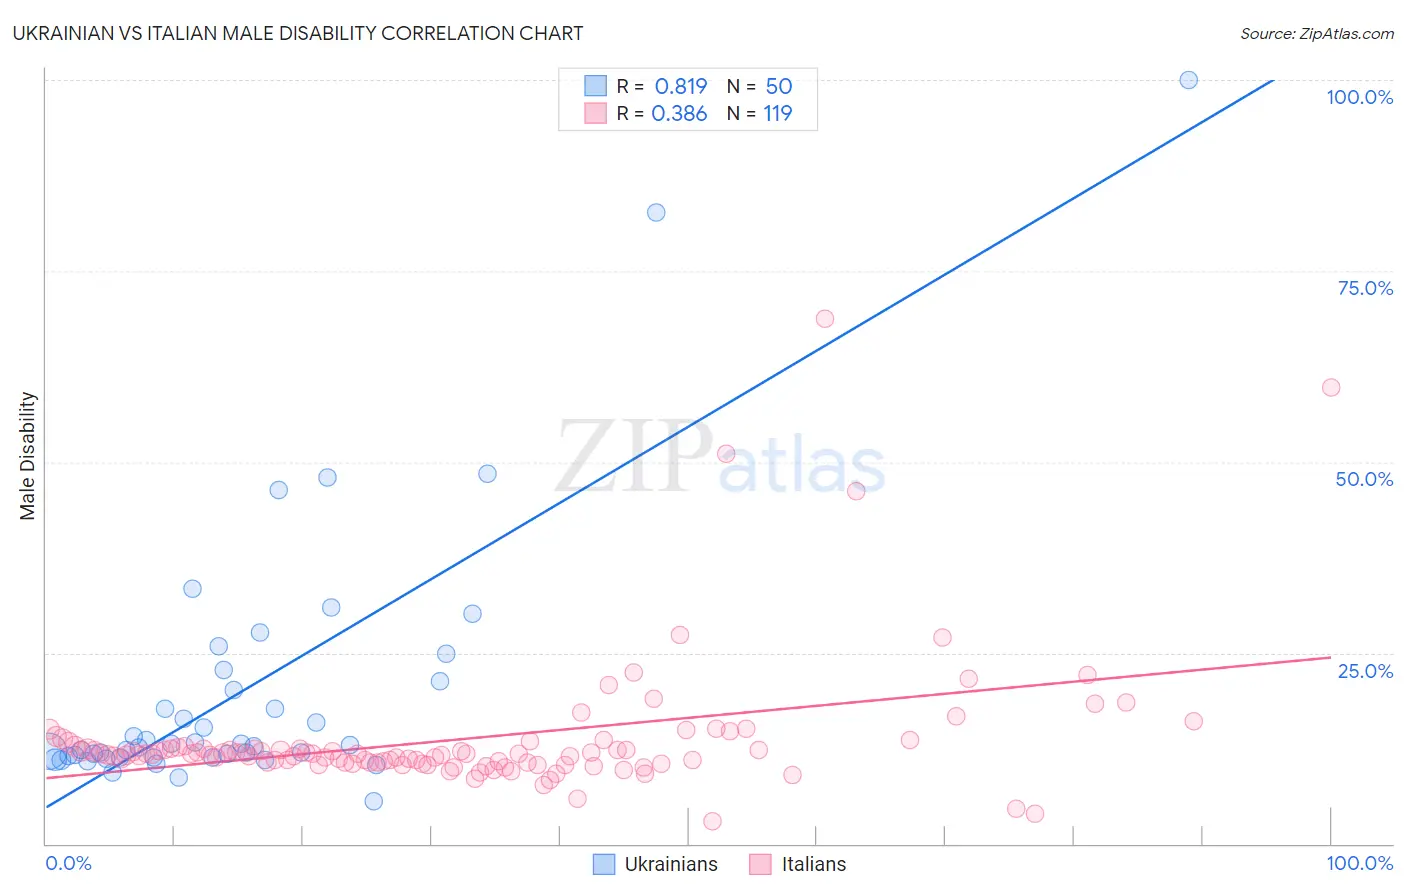
Ukrainian vs Italian Male Disability Correlation Chart
The statistical analysis conducted on geographies consisting of 448,602,749 people shows a very strong positive correlation between the proportion of Ukrainians and percentage of males with a disability in the United States with a correlation coefficient (R) of 0.819 and weighted average of 11.5%. Similarly, the statistical analysis conducted on geographies consisting of 574,737,677 people shows a mild positive correlation between the proportion of Italians and percentage of males with a disability in the United States with a correlation coefficient (R) of 0.386 and weighted average of 11.9%, a difference of 3.1%.
Male Disability Correlation Summary
| Measurement | Ukrainian | Italian |
| Minimum | 5.6% | 3.0% |
| Maximum | 100.0% | 68.8% |
| Range | 94.4% | 65.8% |
| Mean | 20.0% | 13.7% |
| Median | 12.8% | 11.7% |
| Interquartile 25% (IQ1) | 11.3% | 10.6% |
| Interquartile 75% (IQ3) | 21.2% | 12.7% |
| Interquartile Range (IQR) | 9.9% | 2.1% |
| Standard Deviation (Sample) | 17.8% | 8.9% |
| Standard Deviation (Population) | 17.6% | 8.9% |
Similar Demographics by Male Disability
Demographics Similar to Ukrainians by Male Disability
In terms of male disability, the demographic groups most similar to Ukrainians are Immigrants from Cambodia (11.5%, a difference of 0.010%), Serbian (11.5%, a difference of 0.010%), Jamaican (11.5%, a difference of 0.030%), Immigrants from Somalia (11.5%, a difference of 0.030%), and Icelander (11.6%, a difference of 0.070%).
| Demographics | Rating | Rank | Male Disability |
| Lebanese | 15.4 /100 | #199 | Poor 11.5% |
| Immigrants | Iraq | 13.0 /100 | #200 | Poor 11.5% |
| Immigrants | Panama | 13.0 /100 | #201 | Poor 11.5% |
| Immigrants | Mexico | 12.6 /100 | #202 | Poor 11.5% |
| Jamaicans | 10.9 /100 | #203 | Poor 11.5% |
| Immigrants | Cambodia | 10.8 /100 | #204 | Poor 11.5% |
| Serbians | 10.7 /100 | #205 | Poor 11.5% |
| Ukrainians | 10.6 /100 | #206 | Poor 11.5% |
| Immigrants | Somalia | 10.4 /100 | #207 | Poor 11.5% |
| Icelanders | 10.1 /100 | #208 | Poor 11.6% |
| Spanish American Indians | 10.1 /100 | #209 | Poor 11.6% |
| Ute | 9.4 /100 | #210 | Tragic 11.6% |
| Immigrants | Thailand | 8.4 /100 | #211 | Tragic 11.6% |
| Immigrants | Scotland | 8.2 /100 | #212 | Tragic 11.6% |
| Mexican American Indians | 7.8 /100 | #213 | Tragic 11.6% |
Demographics Similar to Italians by Male Disability
In terms of male disability, the demographic groups most similar to Italians are Yugoslavian (11.9%, a difference of 0.050%), Czech (11.9%, a difference of 0.050%), Bahamian (11.9%, a difference of 0.080%), Northern European (11.9%, a difference of 0.10%), and Samoan (11.9%, a difference of 0.13%).
| Demographics | Rating | Rank | Male Disability |
| Malaysians | 1.8 /100 | #232 | Tragic 11.8% |
| Mexicans | 1.7 /100 | #233 | Tragic 11.8% |
| Immigrants | Canada | 1.6 /100 | #234 | Tragic 11.9% |
| Immigrants | North America | 1.5 /100 | #235 | Tragic 11.9% |
| U.S. Virgin Islanders | 1.3 /100 | #236 | Tragic 11.9% |
| Carpatho Rusyns | 1.3 /100 | #237 | Tragic 11.9% |
| Yugoslavians | 1.2 /100 | #238 | Tragic 11.9% |
| Italians | 1.2 /100 | #239 | Tragic 11.9% |
| Czechs | 1.1 /100 | #240 | Tragic 11.9% |
| Bahamians | 1.1 /100 | #241 | Tragic 11.9% |
| Northern Europeans | 1.1 /100 | #242 | Tragic 11.9% |
| Samoans | 1.1 /100 | #243 | Tragic 11.9% |
| Immigrants | Laos | 1.0 /100 | #244 | Tragic 11.9% |
| Immigrants | Liberia | 1.0 /100 | #245 | Tragic 11.9% |
| Danes | 0.9 /100 | #246 | Tragic 11.9% |