Ukrainian vs Crow Male Disability
COMPARE
Ukrainian
Crow
Male Disability
Male Disability Comparison
Ukrainians
Crow
11.5%
MALE DISABILITY
10.6/ 100
METRIC RATING
206th/ 347
METRIC RANK
13.1%
MALE DISABILITY
0.0/ 100
METRIC RATING
302nd/ 347
METRIC RANK
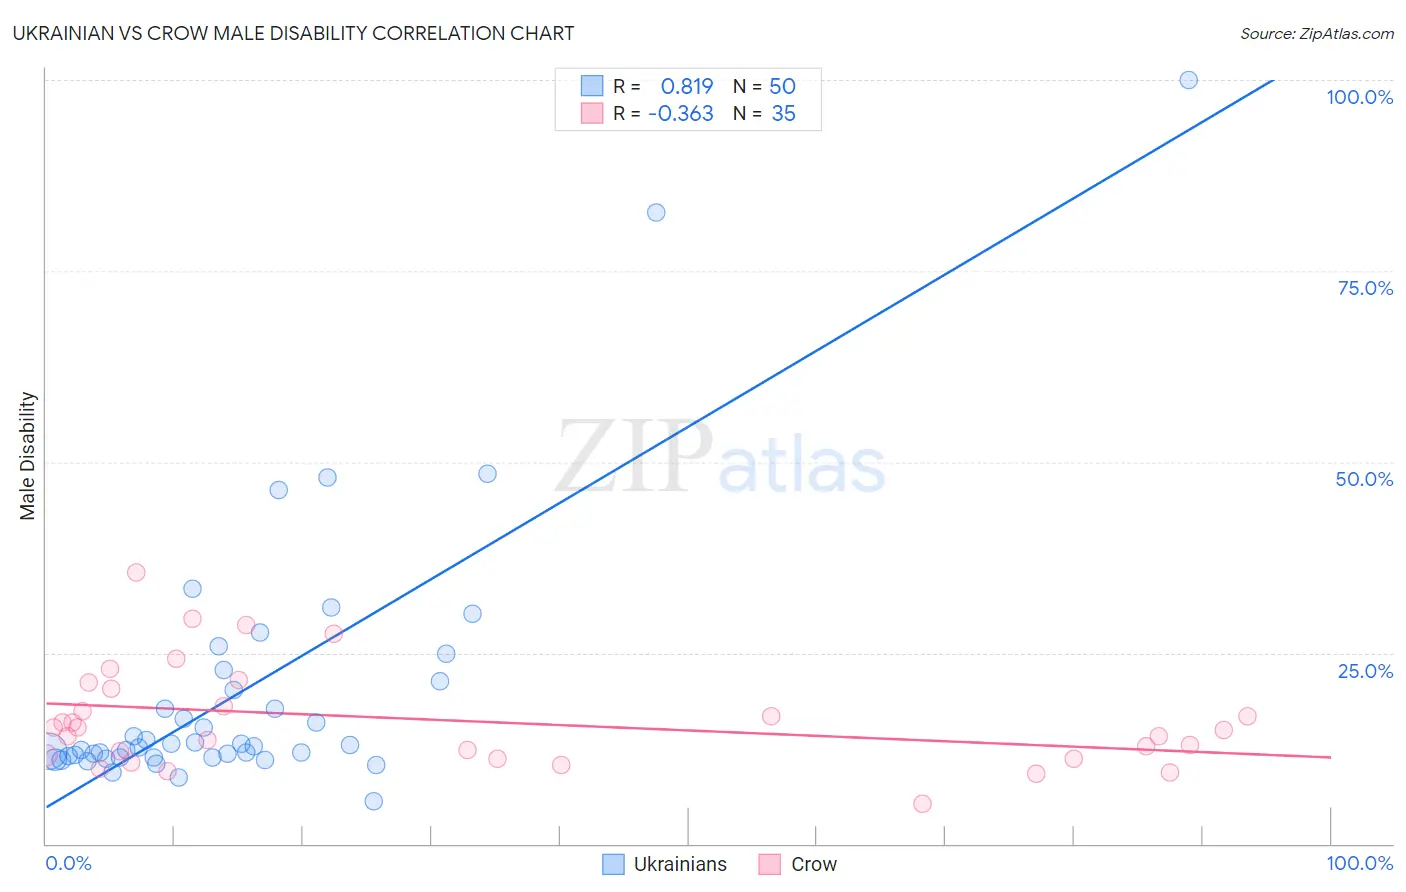
Ukrainian vs Crow Male Disability Correlation Chart
The statistical analysis conducted on geographies consisting of 448,602,749 people shows a very strong positive correlation between the proportion of Ukrainians and percentage of males with a disability in the United States with a correlation coefficient (R) of 0.819 and weighted average of 11.5%. Similarly, the statistical analysis conducted on geographies consisting of 59,204,441 people shows a mild negative correlation between the proportion of Crow and percentage of males with a disability in the United States with a correlation coefficient (R) of -0.363 and weighted average of 13.1%, a difference of 13.6%.
Male Disability Correlation Summary
| Measurement | Ukrainian | Crow |
| Minimum | 5.6% | 5.2% |
| Maximum | 100.0% | 35.5% |
| Range | 94.4% | 30.2% |
| Mean | 20.0% | 16.2% |
| Median | 12.8% | 14.9% |
| Interquartile 25% (IQ1) | 11.3% | 11.2% |
| Interquartile 75% (IQ3) | 21.2% | 20.3% |
| Interquartile Range (IQR) | 9.9% | 9.1% |
| Standard Deviation (Sample) | 17.8% | 6.7% |
| Standard Deviation (Population) | 17.6% | 6.6% |
Similar Demographics by Male Disability
Demographics Similar to Ukrainians by Male Disability
In terms of male disability, the demographic groups most similar to Ukrainians are Immigrants from Cambodia (11.5%, a difference of 0.010%), Serbian (11.5%, a difference of 0.010%), Jamaican (11.5%, a difference of 0.030%), Immigrants from Somalia (11.5%, a difference of 0.030%), and Icelander (11.6%, a difference of 0.070%).
| Demographics | Rating | Rank | Male Disability |
| Lebanese | 15.4 /100 | #199 | Poor 11.5% |
| Immigrants | Iraq | 13.0 /100 | #200 | Poor 11.5% |
| Immigrants | Panama | 13.0 /100 | #201 | Poor 11.5% |
| Immigrants | Mexico | 12.6 /100 | #202 | Poor 11.5% |
| Jamaicans | 10.9 /100 | #203 | Poor 11.5% |
| Immigrants | Cambodia | 10.8 /100 | #204 | Poor 11.5% |
| Serbians | 10.7 /100 | #205 | Poor 11.5% |
| Ukrainians | 10.6 /100 | #206 | Poor 11.5% |
| Immigrants | Somalia | 10.4 /100 | #207 | Poor 11.5% |
| Icelanders | 10.1 /100 | #208 | Poor 11.6% |
| Spanish American Indians | 10.1 /100 | #209 | Poor 11.6% |
| Ute | 9.4 /100 | #210 | Tragic 11.6% |
| Immigrants | Thailand | 8.4 /100 | #211 | Tragic 11.6% |
| Immigrants | Scotland | 8.2 /100 | #212 | Tragic 11.6% |
| Mexican American Indians | 7.8 /100 | #213 | Tragic 11.6% |
Demographics Similar to Crow by Male Disability
In terms of male disability, the demographic groups most similar to Crow are Scotch-Irish (13.2%, a difference of 0.54%), French (13.0%, a difference of 0.58%), Cheyenne (13.0%, a difference of 0.63%), Celtic (13.0%, a difference of 0.72%), and Black/African American (13.2%, a difference of 0.87%).
| Demographics | Rating | Rank | Male Disability |
| Immigrants | Micronesia | 0.0 /100 | #295 | Tragic 12.9% |
| Immigrants | Nonimmigrants | 0.0 /100 | #296 | Tragic 12.9% |
| Inupiat | 0.0 /100 | #297 | Tragic 13.0% |
| Pennsylvania Germans | 0.0 /100 | #298 | Tragic 13.0% |
| Celtics | 0.0 /100 | #299 | Tragic 13.0% |
| Cheyenne | 0.0 /100 | #300 | Tragic 13.0% |
| French | 0.0 /100 | #301 | Tragic 13.0% |
| Crow | 0.0 /100 | #302 | Tragic 13.1% |
| Scotch-Irish | 0.0 /100 | #303 | Tragic 13.2% |
| Blacks/African Americans | 0.0 /100 | #304 | Tragic 13.2% |
| French Canadians | 0.0 /100 | #305 | Tragic 13.3% |
| Spanish Americans | 0.0 /100 | #306 | Tragic 13.3% |
| Arapaho | 0.0 /100 | #307 | Tragic 13.3% |
| French American Indians | 0.0 /100 | #308 | Tragic 13.4% |
| Blackfeet | 0.0 /100 | #309 | Tragic 13.4% |