Hungarian vs Immigrants from Hong Kong Female Disability
COMPARE
Hungarian
Immigrants from Hong Kong
Female Disability
Female Disability Comparison
Hungarians
Immigrants from Hong Kong
12.5%
FEMALE DISABILITY
7.2/ 100
METRIC RATING
229th/ 347
METRIC RANK
10.6%
FEMALE DISABILITY
100.0/ 100
METRIC RATING
10th/ 347
METRIC RANK
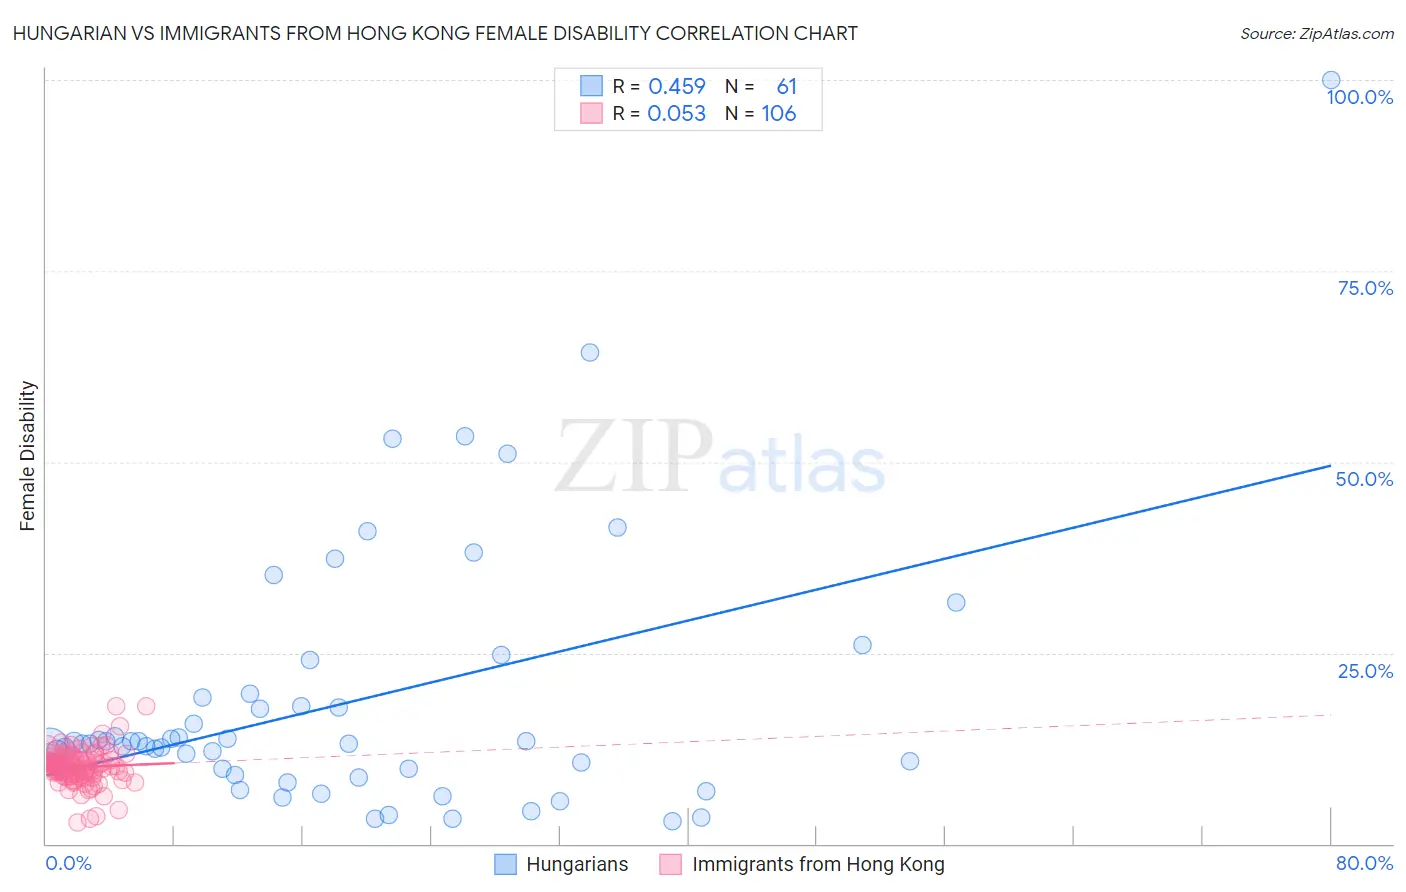
Hungarian vs Immigrants from Hong Kong Female Disability Correlation Chart
The statistical analysis conducted on geographies consisting of 486,134,772 people shows a moderate positive correlation between the proportion of Hungarians and percentage of females with a disability in the United States with a correlation coefficient (R) of 0.459 and weighted average of 12.5%. Similarly, the statistical analysis conducted on geographies consisting of 253,994,726 people shows a slight positive correlation between the proportion of Immigrants from Hong Kong and percentage of females with a disability in the United States with a correlation coefficient (R) of 0.053 and weighted average of 10.6%, a difference of 17.6%.
Female Disability Correlation Summary
| Measurement | Hungarian | Immigrants from Hong Kong |
| Minimum | 2.9% | 2.9% |
| Maximum | 100.0% | 18.1% |
| Range | 97.1% | 15.2% |
| Mean | 18.7% | 10.0% |
| Median | 13.1% | 10.1% |
| Interquartile 25% (IQ1) | 9.4% | 9.0% |
| Interquartile 75% (IQ3) | 19.4% | 11.0% |
| Interquartile Range (IQR) | 10.0% | 2.0% |
| Standard Deviation (Sample) | 17.3% | 2.3% |
| Standard Deviation (Population) | 17.2% | 2.3% |
Similar Demographics by Female Disability
Demographics Similar to Hungarians by Female Disability
In terms of female disability, the demographic groups most similar to Hungarians are Immigrants from Belize (12.5%, a difference of 0.030%), Immigrants from Cambodia (12.5%, a difference of 0.070%), Assyrian/Chaldean/Syriac (12.5%, a difference of 0.10%), Hispanic or Latino (12.5%, a difference of 0.11%), and Belgian (12.5%, a difference of 0.11%).
| Demographics | Rating | Rank | Female Disability |
| Italians | 10.7 /100 | #222 | Poor 12.4% |
| Guamanians/Chamorros | 9.5 /100 | #223 | Tragic 12.5% |
| Belizeans | 9.3 /100 | #224 | Tragic 12.5% |
| Poles | 8.4 /100 | #225 | Tragic 12.5% |
| Hispanics or Latinos | 8.0 /100 | #226 | Tragic 12.5% |
| Assyrians/Chaldeans/Syriacs | 8.0 /100 | #227 | Tragic 12.5% |
| Immigrants | Cambodia | 7.8 /100 | #228 | Tragic 12.5% |
| Hungarians | 7.2 /100 | #229 | Tragic 12.5% |
| Immigrants | Belize | 7.0 /100 | #230 | Tragic 12.5% |
| Belgians | 6.5 /100 | #231 | Tragic 12.5% |
| Immigrants | Somalia | 5.9 /100 | #232 | Tragic 12.5% |
| Immigrants | Iraq | 5.3 /100 | #233 | Tragic 12.5% |
| Scandinavians | 5.3 /100 | #234 | Tragic 12.5% |
| Malaysians | 5.0 /100 | #235 | Tragic 12.5% |
| Immigrants | West Indies | 4.4 /100 | #236 | Tragic 12.6% |
Demographics Similar to Immigrants from Hong Kong by Female Disability
In terms of female disability, the demographic groups most similar to Immigrants from Hong Kong are Immigrants from Korea (10.6%, a difference of 0.17%), Immigrants from Israel (10.7%, a difference of 0.59%), Iranian (10.6%, a difference of 0.65%), Immigrants from Eastern Asia (10.7%, a difference of 0.66%), and Immigrants from China (10.7%, a difference of 0.69%).
| Demographics | Rating | Rank | Female Disability |
| Immigrants | Taiwan | 100.0 /100 | #3 | Exceptional 10.1% |
| Thais | 100.0 /100 | #4 | Exceptional 10.2% |
| Immigrants | Bolivia | 100.0 /100 | #5 | Exceptional 10.3% |
| Bolivians | 100.0 /100 | #6 | Exceptional 10.4% |
| Immigrants | Singapore | 100.0 /100 | #7 | Exceptional 10.4% |
| Immigrants | South Central Asia | 100.0 /100 | #8 | Exceptional 10.5% |
| Iranians | 100.0 /100 | #9 | Exceptional 10.6% |
| Immigrants | Hong Kong | 100.0 /100 | #10 | Exceptional 10.6% |
| Immigrants | Korea | 100.0 /100 | #11 | Exceptional 10.6% |
| Immigrants | Israel | 100.0 /100 | #12 | Exceptional 10.7% |
| Immigrants | Eastern Asia | 100.0 /100 | #13 | Exceptional 10.7% |
| Immigrants | China | 100.0 /100 | #14 | Exceptional 10.7% |
| Burmese | 100.0 /100 | #15 | Exceptional 10.7% |
| Okinawans | 100.0 /100 | #16 | Exceptional 10.8% |
| Indians (Asian) | 100.0 /100 | #17 | Exceptional 10.8% |