Hungarian vs Immigrants from Albania Female Disability
COMPARE
Hungarian
Immigrants from Albania
Female Disability
Female Disability Comparison
Hungarians
Immigrants from Albania
12.5%
FEMALE DISABILITY
7.2/ 100
METRIC RATING
229th/ 347
METRIC RANK
12.3%
FEMALE DISABILITY
31.6/ 100
METRIC RATING
189th/ 347
METRIC RANK
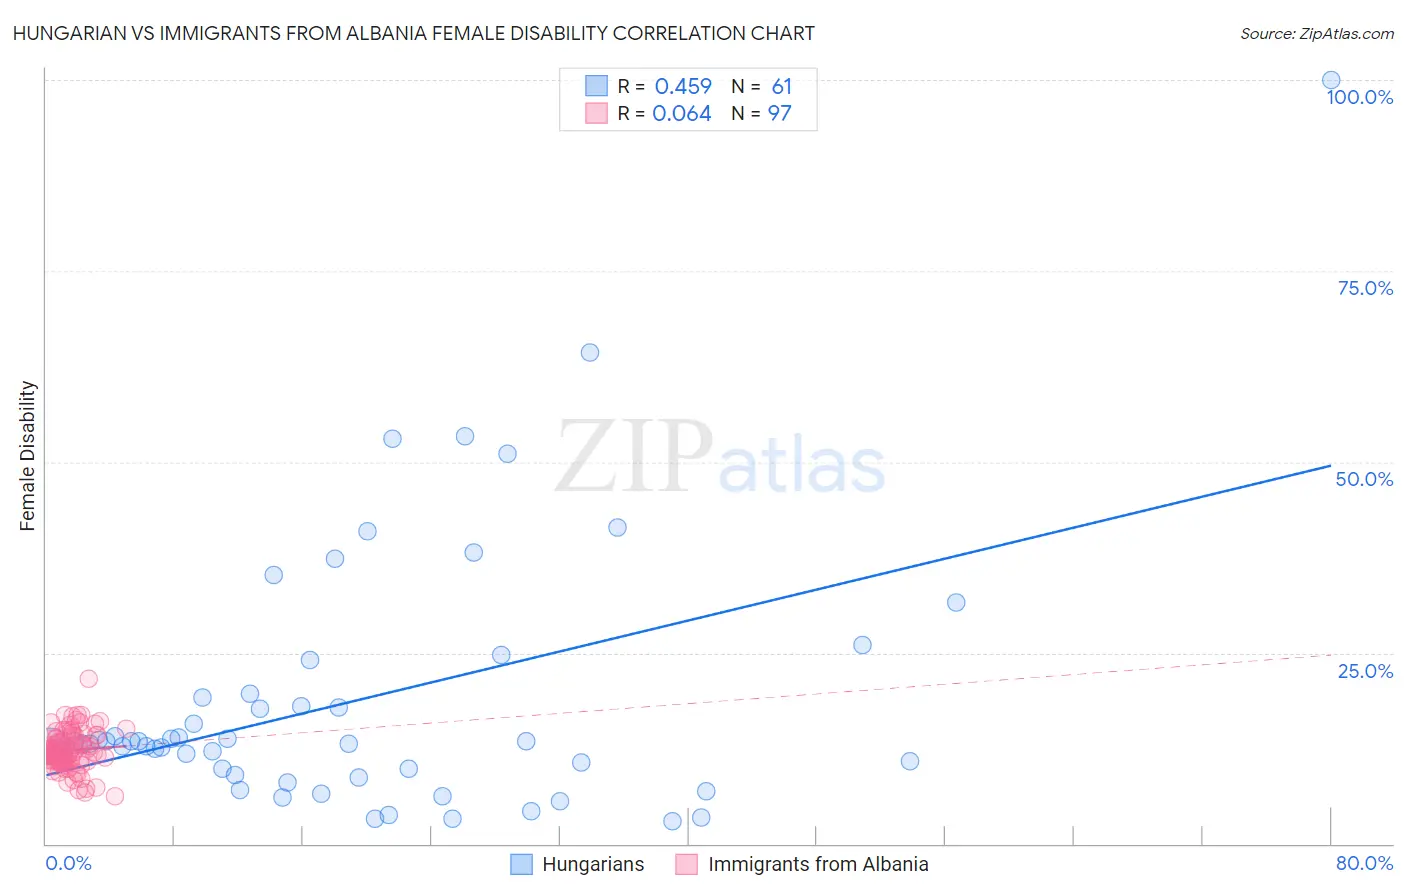
Hungarian vs Immigrants from Albania Female Disability Correlation Chart
The statistical analysis conducted on geographies consisting of 486,134,772 people shows a moderate positive correlation between the proportion of Hungarians and percentage of females with a disability in the United States with a correlation coefficient (R) of 0.459 and weighted average of 12.5%. Similarly, the statistical analysis conducted on geographies consisting of 119,399,114 people shows a slight positive correlation between the proportion of Immigrants from Albania and percentage of females with a disability in the United States with a correlation coefficient (R) of 0.064 and weighted average of 12.3%, a difference of 1.7%.
Female Disability Correlation Summary
| Measurement | Hungarian | Immigrants from Albania |
| Minimum | 2.9% | 6.2% |
| Maximum | 100.0% | 21.6% |
| Range | 97.1% | 15.4% |
| Mean | 18.7% | 12.2% |
| Median | 13.1% | 12.0% |
| Interquartile 25% (IQ1) | 9.4% | 10.8% |
| Interquartile 75% (IQ3) | 19.4% | 13.9% |
| Interquartile Range (IQR) | 10.0% | 3.1% |
| Standard Deviation (Sample) | 17.3% | 2.5% |
| Standard Deviation (Population) | 17.2% | 2.5% |
Similar Demographics by Female Disability
Demographics Similar to Hungarians by Female Disability
In terms of female disability, the demographic groups most similar to Hungarians are Immigrants from Belize (12.5%, a difference of 0.030%), Immigrants from Cambodia (12.5%, a difference of 0.070%), Assyrian/Chaldean/Syriac (12.5%, a difference of 0.10%), Hispanic or Latino (12.5%, a difference of 0.11%), and Belgian (12.5%, a difference of 0.11%).
| Demographics | Rating | Rank | Female Disability |
| Italians | 10.7 /100 | #222 | Poor 12.4% |
| Guamanians/Chamorros | 9.5 /100 | #223 | Tragic 12.5% |
| Belizeans | 9.3 /100 | #224 | Tragic 12.5% |
| Poles | 8.4 /100 | #225 | Tragic 12.5% |
| Hispanics or Latinos | 8.0 /100 | #226 | Tragic 12.5% |
| Assyrians/Chaldeans/Syriacs | 8.0 /100 | #227 | Tragic 12.5% |
| Immigrants | Cambodia | 7.8 /100 | #228 | Tragic 12.5% |
| Hungarians | 7.2 /100 | #229 | Tragic 12.5% |
| Immigrants | Belize | 7.0 /100 | #230 | Tragic 12.5% |
| Belgians | 6.5 /100 | #231 | Tragic 12.5% |
| Immigrants | Somalia | 5.9 /100 | #232 | Tragic 12.5% |
| Immigrants | Iraq | 5.3 /100 | #233 | Tragic 12.5% |
| Scandinavians | 5.3 /100 | #234 | Tragic 12.5% |
| Malaysians | 5.0 /100 | #235 | Tragic 12.5% |
| Immigrants | West Indies | 4.4 /100 | #236 | Tragic 12.6% |
Demographics Similar to Immigrants from Albania by Female Disability
In terms of female disability, the demographic groups most similar to Immigrants from Albania are Immigrants from Honduras (12.3%, a difference of 0.010%), Immigrants from North America (12.3%, a difference of 0.050%), Serbian (12.3%, a difference of 0.070%), Austrian (12.3%, a difference of 0.080%), and Armenian (12.3%, a difference of 0.080%).
| Demographics | Rating | Rank | Female Disability |
| Norwegians | 36.9 /100 | #182 | Fair 12.3% |
| Cubans | 36.5 /100 | #183 | Fair 12.3% |
| Iraqis | 36.0 /100 | #184 | Fair 12.3% |
| Immigrants | Uzbekistan | 33.9 /100 | #185 | Fair 12.3% |
| Austrians | 33.3 /100 | #186 | Fair 12.3% |
| Serbians | 33.1 /100 | #187 | Fair 12.3% |
| Immigrants | North America | 32.8 /100 | #188 | Fair 12.3% |
| Immigrants | Albania | 31.6 /100 | #189 | Fair 12.3% |
| Immigrants | Honduras | 31.3 /100 | #190 | Fair 12.3% |
| Armenians | 29.7 /100 | #191 | Fair 12.3% |
| Immigrants | Western Africa | 29.2 /100 | #192 | Fair 12.3% |
| Northern Europeans | 27.5 /100 | #193 | Fair 12.3% |
| Ukrainians | 27.2 /100 | #194 | Fair 12.3% |
| Swedes | 26.6 /100 | #195 | Fair 12.3% |
| Immigrants | Panama | 25.5 /100 | #196 | Fair 12.3% |