Hungarian vs Immigrants from Ecuador Female Disability
COMPARE
Hungarian
Immigrants from Ecuador
Female Disability
Female Disability Comparison
Hungarians
Immigrants from Ecuador
12.5%
FEMALE DISABILITY
7.2/ 100
METRIC RATING
229th/ 347
METRIC RANK
11.9%
FEMALE DISABILITY
91.5/ 100
METRIC RATING
141st/ 347
METRIC RANK
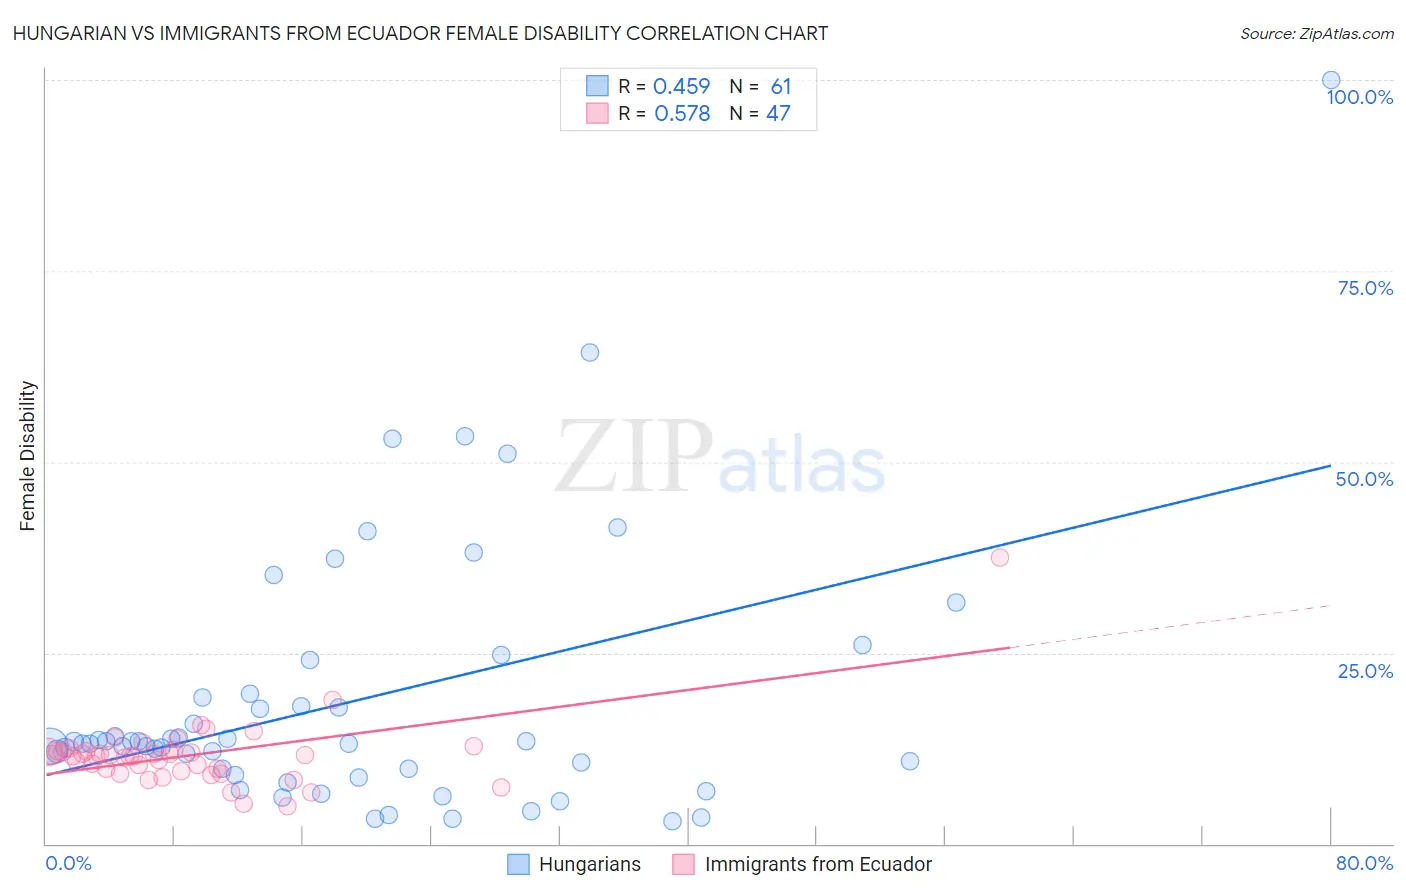
Hungarian vs Immigrants from Ecuador Female Disability Correlation Chart
The statistical analysis conducted on geographies consisting of 486,134,772 people shows a moderate positive correlation between the proportion of Hungarians and percentage of females with a disability in the United States with a correlation coefficient (R) of 0.459 and weighted average of 12.5%. Similarly, the statistical analysis conducted on geographies consisting of 270,971,790 people shows a substantial positive correlation between the proportion of Immigrants from Ecuador and percentage of females with a disability in the United States with a correlation coefficient (R) of 0.578 and weighted average of 11.9%, a difference of 4.8%.
Female Disability Correlation Summary
| Measurement | Hungarian | Immigrants from Ecuador |
| Minimum | 2.9% | 4.9% |
| Maximum | 100.0% | 37.5% |
| Range | 97.1% | 32.6% |
| Mean | 18.7% | 11.6% |
| Median | 13.1% | 11.5% |
| Interquartile 25% (IQ1) | 9.4% | 9.5% |
| Interquartile 75% (IQ3) | 19.4% | 12.2% |
| Interquartile Range (IQR) | 10.0% | 2.6% |
| Standard Deviation (Sample) | 17.3% | 4.6% |
| Standard Deviation (Population) | 17.2% | 4.6% |
Similar Demographics by Female Disability
Demographics Similar to Hungarians by Female Disability
In terms of female disability, the demographic groups most similar to Hungarians are Immigrants from Belize (12.5%, a difference of 0.030%), Immigrants from Cambodia (12.5%, a difference of 0.070%), Assyrian/Chaldean/Syriac (12.5%, a difference of 0.10%), Hispanic or Latino (12.5%, a difference of 0.11%), and Belgian (12.5%, a difference of 0.11%).
| Demographics | Rating | Rank | Female Disability |
| Italians | 10.7 /100 | #222 | Poor 12.4% |
| Guamanians/Chamorros | 9.5 /100 | #223 | Tragic 12.5% |
| Belizeans | 9.3 /100 | #224 | Tragic 12.5% |
| Poles | 8.4 /100 | #225 | Tragic 12.5% |
| Hispanics or Latinos | 8.0 /100 | #226 | Tragic 12.5% |
| Assyrians/Chaldeans/Syriacs | 8.0 /100 | #227 | Tragic 12.5% |
| Immigrants | Cambodia | 7.8 /100 | #228 | Tragic 12.5% |
| Hungarians | 7.2 /100 | #229 | Tragic 12.5% |
| Immigrants | Belize | 7.0 /100 | #230 | Tragic 12.5% |
| Belgians | 6.5 /100 | #231 | Tragic 12.5% |
| Immigrants | Somalia | 5.9 /100 | #232 | Tragic 12.5% |
| Immigrants | Iraq | 5.3 /100 | #233 | Tragic 12.5% |
| Scandinavians | 5.3 /100 | #234 | Tragic 12.5% |
| Malaysians | 5.0 /100 | #235 | Tragic 12.5% |
| Immigrants | West Indies | 4.4 /100 | #236 | Tragic 12.6% |
Demographics Similar to Immigrants from Ecuador by Female Disability
In terms of female disability, the demographic groups most similar to Immigrants from Ecuador are Romanian (11.9%, a difference of 0.020%), Immigrants from Africa (11.9%, a difference of 0.17%), Immigrants from Hungary (11.9%, a difference of 0.18%), Immigrants from Sudan (11.9%, a difference of 0.21%), and Ecuadorian (11.9%, a difference of 0.26%).
| Demographics | Rating | Rank | Female Disability |
| Immigrants | Nicaragua | 94.5 /100 | #134 | Exceptional 11.9% |
| Central Americans | 94.2 /100 | #135 | Exceptional 11.9% |
| Ugandans | 94.0 /100 | #136 | Exceptional 11.9% |
| Immigrants | Norway | 93.8 /100 | #137 | Exceptional 11.9% |
| Ecuadorians | 93.4 /100 | #138 | Exceptional 11.9% |
| Immigrants | Hungary | 92.8 /100 | #139 | Exceptional 11.9% |
| Romanians | 91.6 /100 | #140 | Exceptional 11.9% |
| Immigrants | Ecuador | 91.5 /100 | #141 | Exceptional 11.9% |
| Immigrants | Africa | 90.0 /100 | #142 | Excellent 11.9% |
| Immigrants | Sudan | 89.6 /100 | #143 | Excellent 11.9% |
| Immigrants | Austria | 87.9 /100 | #144 | Excellent 12.0% |
| Estonians | 87.8 /100 | #145 | Excellent 12.0% |
| Pakistanis | 84.6 /100 | #146 | Excellent 12.0% |
| Nigerians | 84.0 /100 | #147 | Excellent 12.0% |
| Immigrants | Kenya | 83.1 /100 | #148 | Excellent 12.0% |