Brazilian vs Apache Male Disability
COMPARE
Brazilian
Apache
Male Disability
Male Disability Comparison
Brazilians
Apache
10.9%
MALE DISABILITY
85.4/ 100
METRIC RATING
130th/ 347
METRIC RANK
14.0%
MALE DISABILITY
0.0/ 100
METRIC RATING
322nd/ 347
METRIC RANK
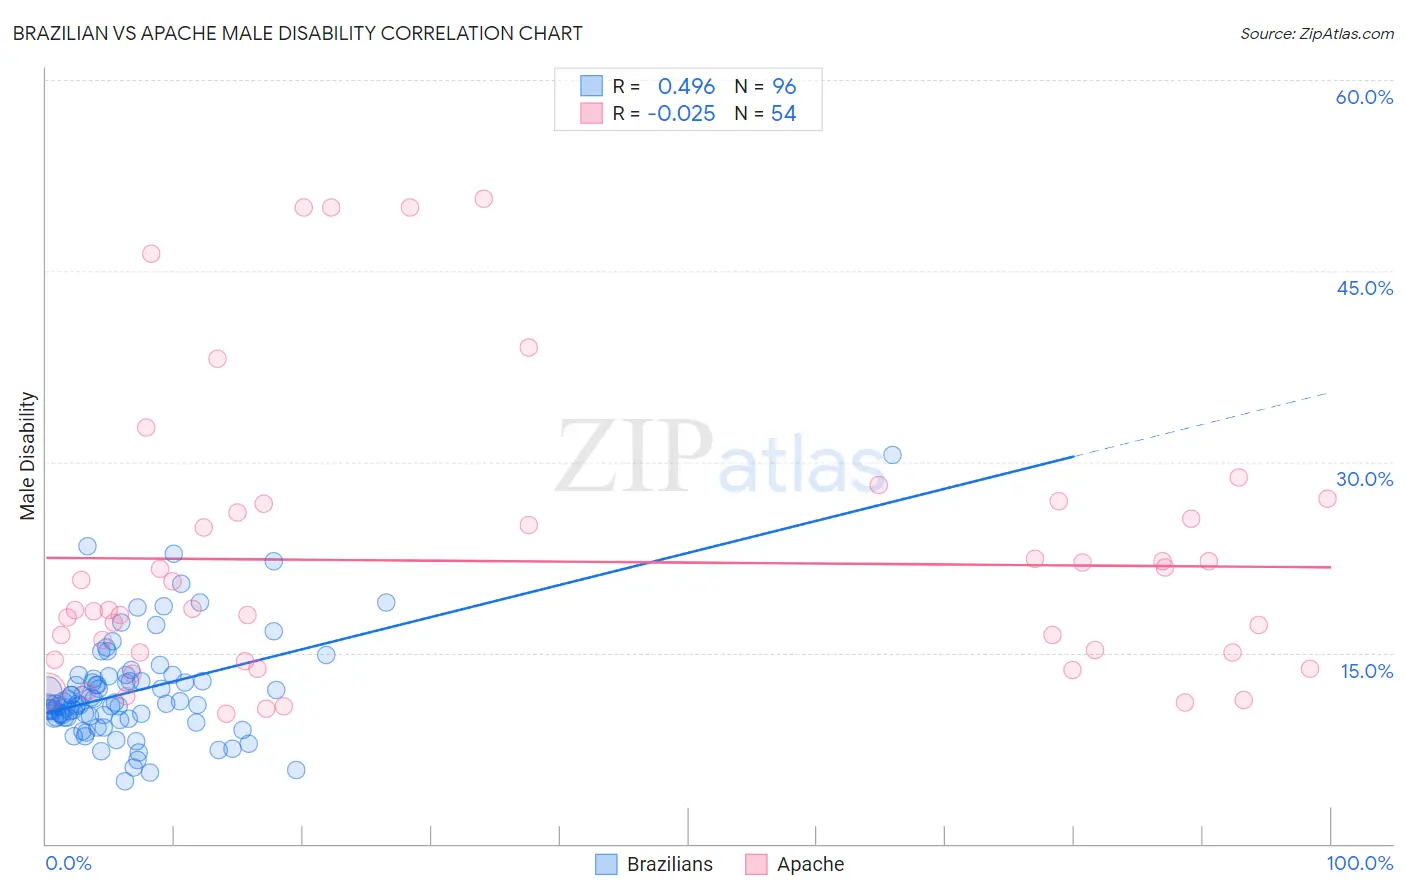
Brazilian vs Apache Male Disability Correlation Chart
The statistical analysis conducted on geographies consisting of 323,937,131 people shows a moderate positive correlation between the proportion of Brazilians and percentage of males with a disability in the United States with a correlation coefficient (R) of 0.496 and weighted average of 10.9%. Similarly, the statistical analysis conducted on geographies consisting of 231,062,399 people shows no correlation between the proportion of Apache and percentage of males with a disability in the United States with a correlation coefficient (R) of -0.025 and weighted average of 14.0%, a difference of 28.0%.
Male Disability Correlation Summary
| Measurement | Brazilian | Apache |
| Minimum | 4.9% | 10.2% |
| Maximum | 30.6% | 50.7% |
| Range | 25.7% | 40.5% |
| Mean | 12.0% | 22.2% |
| Median | 11.0% | 18.3% |
| Interquartile 25% (IQ1) | 9.9% | 14.5% |
| Interquartile 75% (IQ3) | 12.9% | 26.0% |
| Interquartile Range (IQR) | 2.9% | 11.6% |
| Standard Deviation (Sample) | 4.1% | 11.0% |
| Standard Deviation (Population) | 4.1% | 10.9% |
Similar Demographics by Male Disability
Demographics Similar to Brazilians by Male Disability
In terms of male disability, the demographic groups most similar to Brazilians are Immigrants from Latvia (10.9%, a difference of 0.0%), Immigrants from Philippines (10.9%, a difference of 0.0%), Macedonian (11.0%, a difference of 0.14%), Immigrants from Ukraine (10.9%, a difference of 0.16%), and Immigrants from Fiji (11.0%, a difference of 0.16%).
| Demographics | Rating | Rank | Male Disability |
| Immigrants | Czechoslovakia | 88.4 /100 | #123 | Excellent 10.9% |
| South American Indians | 88.1 /100 | #124 | Excellent 10.9% |
| Immigrants | North Macedonia | 88.1 /100 | #125 | Excellent 10.9% |
| Immigrants | Trinidad and Tobago | 86.9 /100 | #126 | Excellent 10.9% |
| Immigrants | Ukraine | 86.8 /100 | #127 | Excellent 10.9% |
| Immigrants | Latvia | 85.5 /100 | #128 | Excellent 10.9% |
| Immigrants | Philippines | 85.4 /100 | #129 | Excellent 10.9% |
| Brazilians | 85.4 /100 | #130 | Excellent 10.9% |
| Macedonians | 84.2 /100 | #131 | Excellent 11.0% |
| Immigrants | Fiji | 84.0 /100 | #132 | Excellent 11.0% |
| Ugandans | 83.9 /100 | #133 | Excellent 11.0% |
| Bhutanese | 83.4 /100 | #134 | Excellent 11.0% |
| Trinidadians and Tobagonians | 83.3 /100 | #135 | Excellent 11.0% |
| Immigrants | Costa Rica | 82.8 /100 | #136 | Excellent 11.0% |
| Immigrants | Europe | 82.0 /100 | #137 | Excellent 11.0% |
Demographics Similar to Apache by Male Disability
In terms of male disability, the demographic groups most similar to Apache are Osage (14.0%, a difference of 0.070%), Comanche (14.1%, a difference of 0.40%), Ottawa (14.1%, a difference of 0.51%), Shoshone (13.8%, a difference of 1.1%), and Tlingit-Haida (13.8%, a difference of 1.2%).
| Demographics | Rating | Rank | Male Disability |
| Iroquois | 0.0 /100 | #315 | Tragic 13.6% |
| Alaska Natives | 0.0 /100 | #316 | Tragic 13.6% |
| Paiute | 0.0 /100 | #317 | Tragic 13.7% |
| Cree | 0.0 /100 | #318 | Tragic 13.7% |
| Americans | 0.0 /100 | #319 | Tragic 13.8% |
| Tlingit-Haida | 0.0 /100 | #320 | Tragic 13.8% |
| Shoshone | 0.0 /100 | #321 | Tragic 13.8% |
| Apache | 0.0 /100 | #322 | Tragic 14.0% |
| Osage | 0.0 /100 | #323 | Tragic 14.0% |
| Comanche | 0.0 /100 | #324 | Tragic 14.1% |
| Ottawa | 0.0 /100 | #325 | Tragic 14.1% |
| Natives/Alaskans | 0.0 /100 | #326 | Tragic 14.2% |
| Potawatomi | 0.0 /100 | #327 | Tragic 14.2% |
| Chippewa | 0.0 /100 | #328 | Tragic 14.3% |
| Cajuns | 0.0 /100 | #329 | Tragic 14.4% |