Brazilian vs Immigrants from Eritrea Male Disability
COMPARE
Brazilian
Immigrants from Eritrea
Male Disability
Male Disability Comparison
Brazilians
Immigrants from Eritrea
10.9%
MALE DISABILITY
85.4/ 100
METRIC RATING
130th/ 347
METRIC RANK
10.4%
MALE DISABILITY
99.6/ 100
METRIC RATING
55th/ 347
METRIC RANK
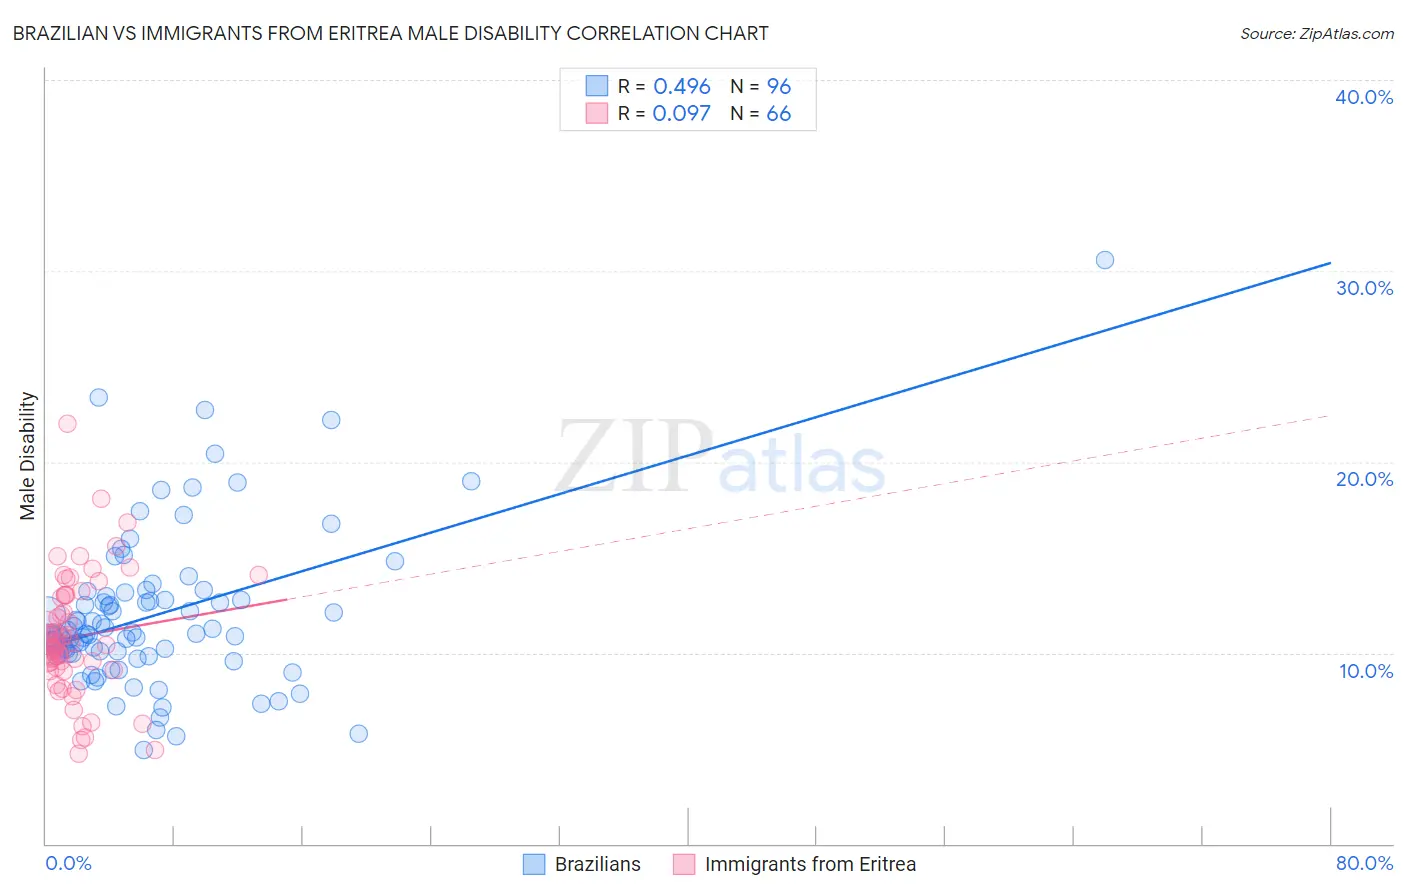
Brazilian vs Immigrants from Eritrea Male Disability Correlation Chart
The statistical analysis conducted on geographies consisting of 323,937,131 people shows a moderate positive correlation between the proportion of Brazilians and percentage of males with a disability in the United States with a correlation coefficient (R) of 0.496 and weighted average of 10.9%. Similarly, the statistical analysis conducted on geographies consisting of 104,852,788 people shows a slight positive correlation between the proportion of Immigrants from Eritrea and percentage of males with a disability in the United States with a correlation coefficient (R) of 0.097 and weighted average of 10.4%, a difference of 5.5%.
Male Disability Correlation Summary
| Measurement | Brazilian | Immigrants from Eritrea |
| Minimum | 4.9% | 4.7% |
| Maximum | 30.6% | 22.0% |
| Range | 25.7% | 17.3% |
| Mean | 12.0% | 10.8% |
| Median | 11.0% | 10.4% |
| Interquartile 25% (IQ1) | 9.9% | 9.2% |
| Interquartile 75% (IQ3) | 12.9% | 13.0% |
| Interquartile Range (IQR) | 2.9% | 3.8% |
| Standard Deviation (Sample) | 4.1% | 3.2% |
| Standard Deviation (Population) | 4.1% | 3.1% |
Similar Demographics by Male Disability
Demographics Similar to Brazilians by Male Disability
In terms of male disability, the demographic groups most similar to Brazilians are Immigrants from Latvia (10.9%, a difference of 0.0%), Immigrants from Philippines (10.9%, a difference of 0.0%), Macedonian (11.0%, a difference of 0.14%), Immigrants from Ukraine (10.9%, a difference of 0.16%), and Immigrants from Fiji (11.0%, a difference of 0.16%).
| Demographics | Rating | Rank | Male Disability |
| Immigrants | Czechoslovakia | 88.4 /100 | #123 | Excellent 10.9% |
| South American Indians | 88.1 /100 | #124 | Excellent 10.9% |
| Immigrants | North Macedonia | 88.1 /100 | #125 | Excellent 10.9% |
| Immigrants | Trinidad and Tobago | 86.9 /100 | #126 | Excellent 10.9% |
| Immigrants | Ukraine | 86.8 /100 | #127 | Excellent 10.9% |
| Immigrants | Latvia | 85.5 /100 | #128 | Excellent 10.9% |
| Immigrants | Philippines | 85.4 /100 | #129 | Excellent 10.9% |
| Brazilians | 85.4 /100 | #130 | Excellent 10.9% |
| Macedonians | 84.2 /100 | #131 | Excellent 11.0% |
| Immigrants | Fiji | 84.0 /100 | #132 | Excellent 11.0% |
| Ugandans | 83.9 /100 | #133 | Excellent 11.0% |
| Bhutanese | 83.4 /100 | #134 | Excellent 11.0% |
| Trinidadians and Tobagonians | 83.3 /100 | #135 | Excellent 11.0% |
| Immigrants | Costa Rica | 82.8 /100 | #136 | Excellent 11.0% |
| Immigrants | Europe | 82.0 /100 | #137 | Excellent 11.0% |
Demographics Similar to Immigrants from Eritrea by Male Disability
In terms of male disability, the demographic groups most similar to Immigrants from Eritrea are Peruvian (10.4%, a difference of 0.020%), Tongan (10.4%, a difference of 0.040%), Immigrants from Uzbekistan (10.4%, a difference of 0.060%), Immigrants from South America (10.4%, a difference of 0.060%), and Immigrants from Saudi Arabia (10.4%, a difference of 0.080%).
| Demographics | Rating | Rank | Male Disability |
| Israelis | 99.7 /100 | #48 | Exceptional 10.3% |
| Immigrants | Spain | 99.7 /100 | #49 | Exceptional 10.3% |
| South Americans | 99.6 /100 | #50 | Exceptional 10.3% |
| Salvadorans | 99.6 /100 | #51 | Exceptional 10.4% |
| Immigrants | Saudi Arabia | 99.6 /100 | #52 | Exceptional 10.4% |
| Immigrants | Uzbekistan | 99.6 /100 | #53 | Exceptional 10.4% |
| Peruvians | 99.6 /100 | #54 | Exceptional 10.4% |
| Immigrants | Eritrea | 99.6 /100 | #55 | Exceptional 10.4% |
| Tongans | 99.6 /100 | #56 | Exceptional 10.4% |
| Immigrants | South America | 99.6 /100 | #57 | Exceptional 10.4% |
| Immigrants | Japan | 99.5 /100 | #58 | Exceptional 10.4% |
| Immigrants | Australia | 99.5 /100 | #59 | Exceptional 10.4% |
| Immigrants | Colombia | 99.5 /100 | #60 | Exceptional 10.4% |
| Immigrants | Northern Africa | 99.4 /100 | #61 | Exceptional 10.4% |
| Immigrants | Ecuador | 99.3 /100 | #62 | Exceptional 10.4% |