Brazilian vs Chinese Male Disability
COMPARE
Brazilian
Chinese
Male Disability
Male Disability Comparison
Brazilians
Chinese
10.9%
MALE DISABILITY
85.4/ 100
METRIC RATING
130th/ 347
METRIC RANK
12.1%
MALE DISABILITY
0.4/ 100
METRIC RATING
255th/ 347
METRIC RANK
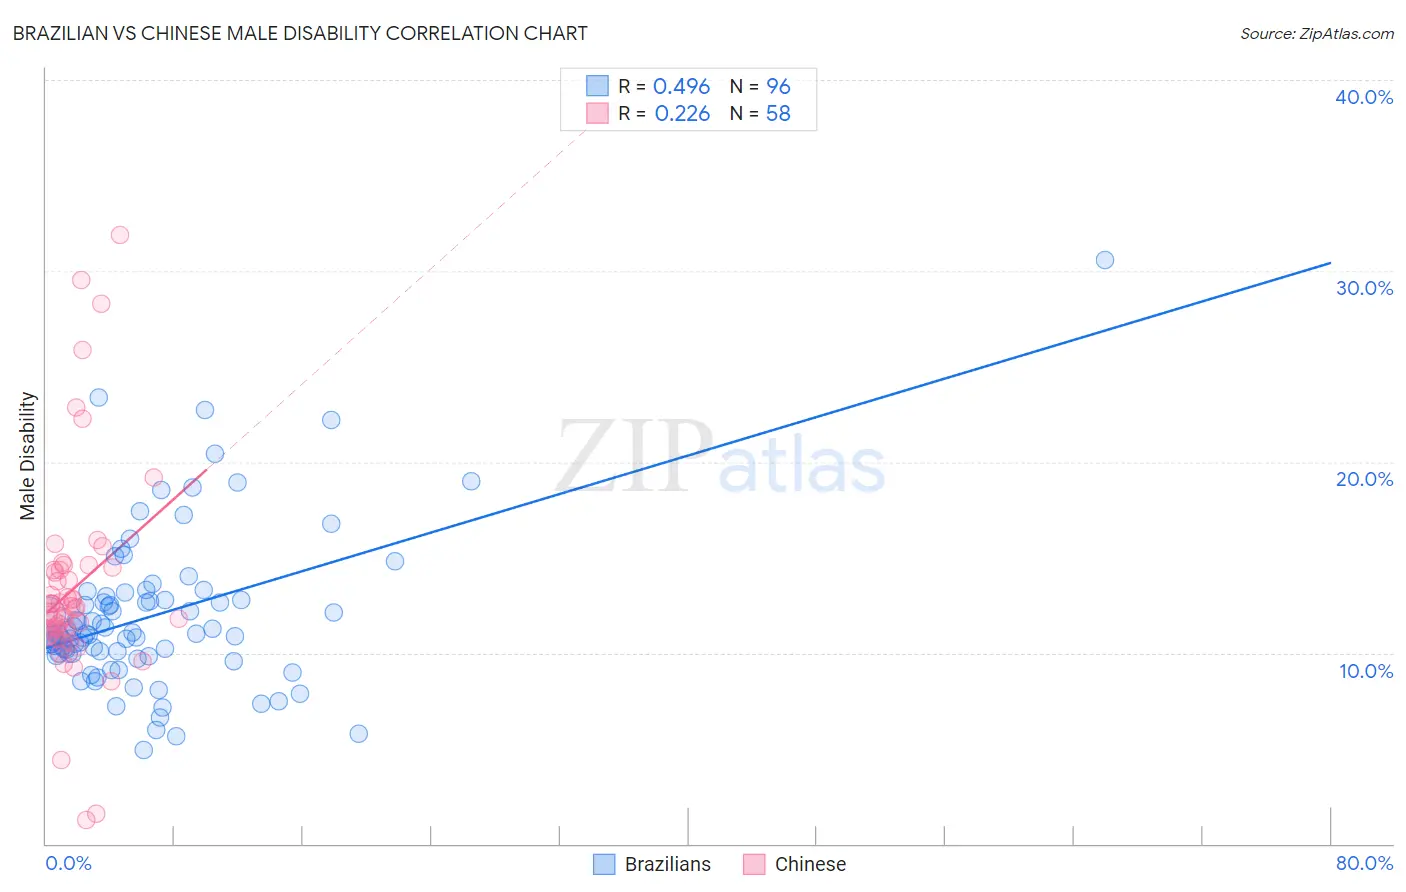
Brazilian vs Chinese Male Disability Correlation Chart
The statistical analysis conducted on geographies consisting of 323,937,131 people shows a moderate positive correlation between the proportion of Brazilians and percentage of males with a disability in the United States with a correlation coefficient (R) of 0.496 and weighted average of 10.9%. Similarly, the statistical analysis conducted on geographies consisting of 64,802,721 people shows a weak positive correlation between the proportion of Chinese and percentage of males with a disability in the United States with a correlation coefficient (R) of 0.226 and weighted average of 12.1%, a difference of 10.3%.
Male Disability Correlation Summary
| Measurement | Brazilian | Chinese |
| Minimum | 4.9% | 1.3% |
| Maximum | 30.6% | 31.9% |
| Range | 25.7% | 30.7% |
| Mean | 12.0% | 13.4% |
| Median | 11.0% | 12.4% |
| Interquartile 25% (IQ1) | 9.9% | 11.1% |
| Interquartile 75% (IQ3) | 12.9% | 14.4% |
| Interquartile Range (IQR) | 2.9% | 3.3% |
| Standard Deviation (Sample) | 4.1% | 5.6% |
| Standard Deviation (Population) | 4.1% | 5.5% |
Similar Demographics by Male Disability
Demographics Similar to Brazilians by Male Disability
In terms of male disability, the demographic groups most similar to Brazilians are Immigrants from Latvia (10.9%, a difference of 0.0%), Immigrants from Philippines (10.9%, a difference of 0.0%), Macedonian (11.0%, a difference of 0.14%), Immigrants from Ukraine (10.9%, a difference of 0.16%), and Immigrants from Fiji (11.0%, a difference of 0.16%).
| Demographics | Rating | Rank | Male Disability |
| Immigrants | Czechoslovakia | 88.4 /100 | #123 | Excellent 10.9% |
| South American Indians | 88.1 /100 | #124 | Excellent 10.9% |
| Immigrants | North Macedonia | 88.1 /100 | #125 | Excellent 10.9% |
| Immigrants | Trinidad and Tobago | 86.9 /100 | #126 | Excellent 10.9% |
| Immigrants | Ukraine | 86.8 /100 | #127 | Excellent 10.9% |
| Immigrants | Latvia | 85.5 /100 | #128 | Excellent 10.9% |
| Immigrants | Philippines | 85.4 /100 | #129 | Excellent 10.9% |
| Brazilians | 85.4 /100 | #130 | Excellent 10.9% |
| Macedonians | 84.2 /100 | #131 | Excellent 11.0% |
| Immigrants | Fiji | 84.0 /100 | #132 | Excellent 11.0% |
| Ugandans | 83.9 /100 | #133 | Excellent 11.0% |
| Bhutanese | 83.4 /100 | #134 | Excellent 11.0% |
| Trinidadians and Tobagonians | 83.3 /100 | #135 | Excellent 11.0% |
| Immigrants | Costa Rica | 82.8 /100 | #136 | Excellent 11.0% |
| Immigrants | Europe | 82.0 /100 | #137 | Excellent 11.0% |
Demographics Similar to Chinese by Male Disability
In terms of male disability, the demographic groups most similar to Chinese are British (12.1%, a difference of 0.010%), Slovene (12.0%, a difference of 0.20%), Guamanian/Chamorro (12.0%, a difference of 0.20%), Swiss (12.1%, a difference of 0.25%), and European (12.1%, a difference of 0.25%).
| Demographics | Rating | Rank | Male Disability |
| Poles | 0.7 /100 | #248 | Tragic 12.0% |
| Immigrants | Yemen | 0.5 /100 | #249 | Tragic 12.0% |
| Bangladeshis | 0.5 /100 | #250 | Tragic 12.0% |
| German Russians | 0.5 /100 | #251 | Tragic 12.0% |
| Slovenes | 0.5 /100 | #252 | Tragic 12.0% |
| Guamanians/Chamorros | 0.5 /100 | #253 | Tragic 12.0% |
| British | 0.4 /100 | #254 | Tragic 12.1% |
| Chinese | 0.4 /100 | #255 | Tragic 12.1% |
| Swiss | 0.3 /100 | #256 | Tragic 12.1% |
| Europeans | 0.3 /100 | #257 | Tragic 12.1% |
| Basques | 0.3 /100 | #258 | Tragic 12.1% |
| Belgians | 0.3 /100 | #259 | Tragic 12.1% |
| Swedes | 0.3 /100 | #260 | Tragic 12.1% |
| Slavs | 0.2 /100 | #261 | Tragic 12.2% |
| Norwegians | 0.2 /100 | #262 | Tragic 12.2% |