Immigrants from Colombia vs Subsaharan African Vision Disability
COMPARE
Immigrants from Colombia
Subsaharan African
Vision Disability
Vision Disability Comparison
Immigrants from Colombia
Sub-Saharan Africans
2.1%
VISION DISABILITY
72.1/ 100
METRIC RATING
155th/ 347
METRIC RANK
2.3%
VISION DISABILITY
0.5/ 100
METRIC RATING
248th/ 347
METRIC RANK
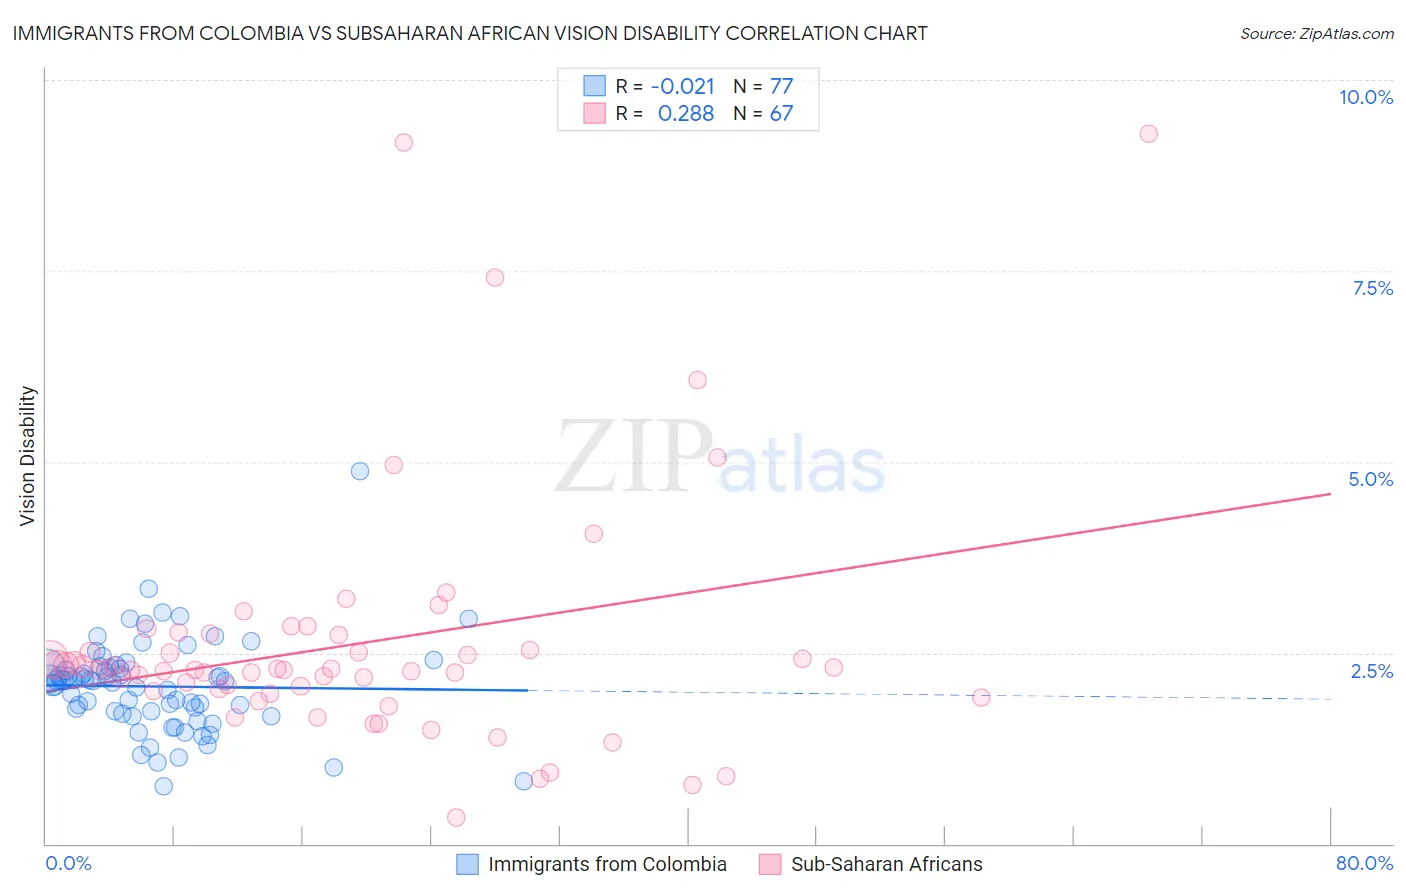
Immigrants from Colombia vs Subsaharan African Vision Disability Correlation Chart
The statistical analysis conducted on geographies consisting of 378,455,672 people shows no correlation between the proportion of Immigrants from Colombia and percentage of population with vision disability in the United States with a correlation coefficient (R) of -0.021 and weighted average of 2.1%. Similarly, the statistical analysis conducted on geographies consisting of 507,474,731 people shows a weak positive correlation between the proportion of Sub-Saharan Africans and percentage of population with vision disability in the United States with a correlation coefficient (R) of 0.288 and weighted average of 2.3%, a difference of 10.0%.
Vision Disability Correlation Summary
| Measurement | Immigrants from Colombia | Subsaharan African |
| Minimum | 0.75% | 0.34% |
| Maximum | 4.9% | 9.3% |
| Range | 4.1% | 9.0% |
| Mean | 2.1% | 2.6% |
| Median | 2.1% | 2.3% |
| Interquartile 25% (IQ1) | 1.7% | 2.0% |
| Interquartile 75% (IQ3) | 2.3% | 2.7% |
| Interquartile Range (IQR) | 0.59% | 0.74% |
| Standard Deviation (Sample) | 0.61% | 1.6% |
| Standard Deviation (Population) | 0.61% | 1.6% |
Similar Demographics by Vision Disability
Demographics Similar to Immigrants from Colombia by Vision Disability
In terms of vision disability, the demographic groups most similar to Immigrants from Colombia are Pakistani (2.1%, a difference of 0.040%), Slovene (2.1%, a difference of 0.12%), Immigrants from South America (2.1%, a difference of 0.14%), Serbian (2.1%, a difference of 0.14%), and Immigrants from Uzbekistan (2.1%, a difference of 0.17%).
| Demographics | Rating | Rank | Vision Disability |
| Finns | 78.3 /100 | #148 | Good 2.1% |
| Colombians | 76.2 /100 | #149 | Good 2.1% |
| Belgians | 75.9 /100 | #150 | Good 2.1% |
| Immigrants | Norway | 75.5 /100 | #151 | Good 2.1% |
| Immigrants | Southern Europe | 74.6 /100 | #152 | Good 2.1% |
| Immigrants | South America | 73.8 /100 | #153 | Good 2.1% |
| Slovenes | 73.6 /100 | #154 | Good 2.1% |
| Immigrants | Colombia | 72.1 /100 | #155 | Good 2.1% |
| Pakistanis | 71.6 /100 | #156 | Good 2.1% |
| Serbians | 70.2 /100 | #157 | Good 2.1% |
| Immigrants | Uzbekistan | 69.9 /100 | #158 | Good 2.1% |
| South Africans | 69.8 /100 | #159 | Good 2.1% |
| Austrians | 69.0 /100 | #160 | Good 2.1% |
| Iraqis | 67.7 /100 | #161 | Good 2.1% |
| Hungarians | 67.4 /100 | #162 | Good 2.1% |
Demographics Similar to Sub-Saharan Africans by Vision Disability
In terms of vision disability, the demographic groups most similar to Sub-Saharan Africans are Liberian (2.3%, a difference of 0.010%), Guatemalan (2.3%, a difference of 0.020%), French (2.3%, a difference of 0.060%), Bangladeshi (2.3%, a difference of 0.10%), and Alsatian (2.3%, a difference of 0.21%).
| Demographics | Rating | Rank | Vision Disability |
| Malaysians | 0.9 /100 | #241 | Tragic 2.3% |
| Immigrants | Panama | 0.8 /100 | #242 | Tragic 2.3% |
| Immigrants | Nicaragua | 0.6 /100 | #243 | Tragic 2.3% |
| Immigrants | West Indies | 0.6 /100 | #244 | Tragic 2.3% |
| Alsatians | 0.6 /100 | #245 | Tragic 2.3% |
| French | 0.5 /100 | #246 | Tragic 2.3% |
| Guatemalans | 0.5 /100 | #247 | Tragic 2.3% |
| Sub-Saharan Africans | 0.5 /100 | #248 | Tragic 2.3% |
| Liberians | 0.5 /100 | #249 | Tragic 2.3% |
| Bangladeshis | 0.5 /100 | #250 | Tragic 2.3% |
| Immigrants | Laos | 0.4 /100 | #251 | Tragic 2.4% |
| Immigrants | Micronesia | 0.3 /100 | #252 | Tragic 2.4% |
| Japanese | 0.3 /100 | #253 | Tragic 2.4% |
| Haitians | 0.3 /100 | #254 | Tragic 2.4% |
| Immigrants | Guatemala | 0.3 /100 | #255 | Tragic 2.4% |