Zip Codes with the Highest Percentage of Population Employed in Mining, Quarrying, & Extraction in Oroville, CA
RELATED REPORTS & OPTIONS
Mining, Quarrying, & Extraction
Oroville
Compare Zip Codes
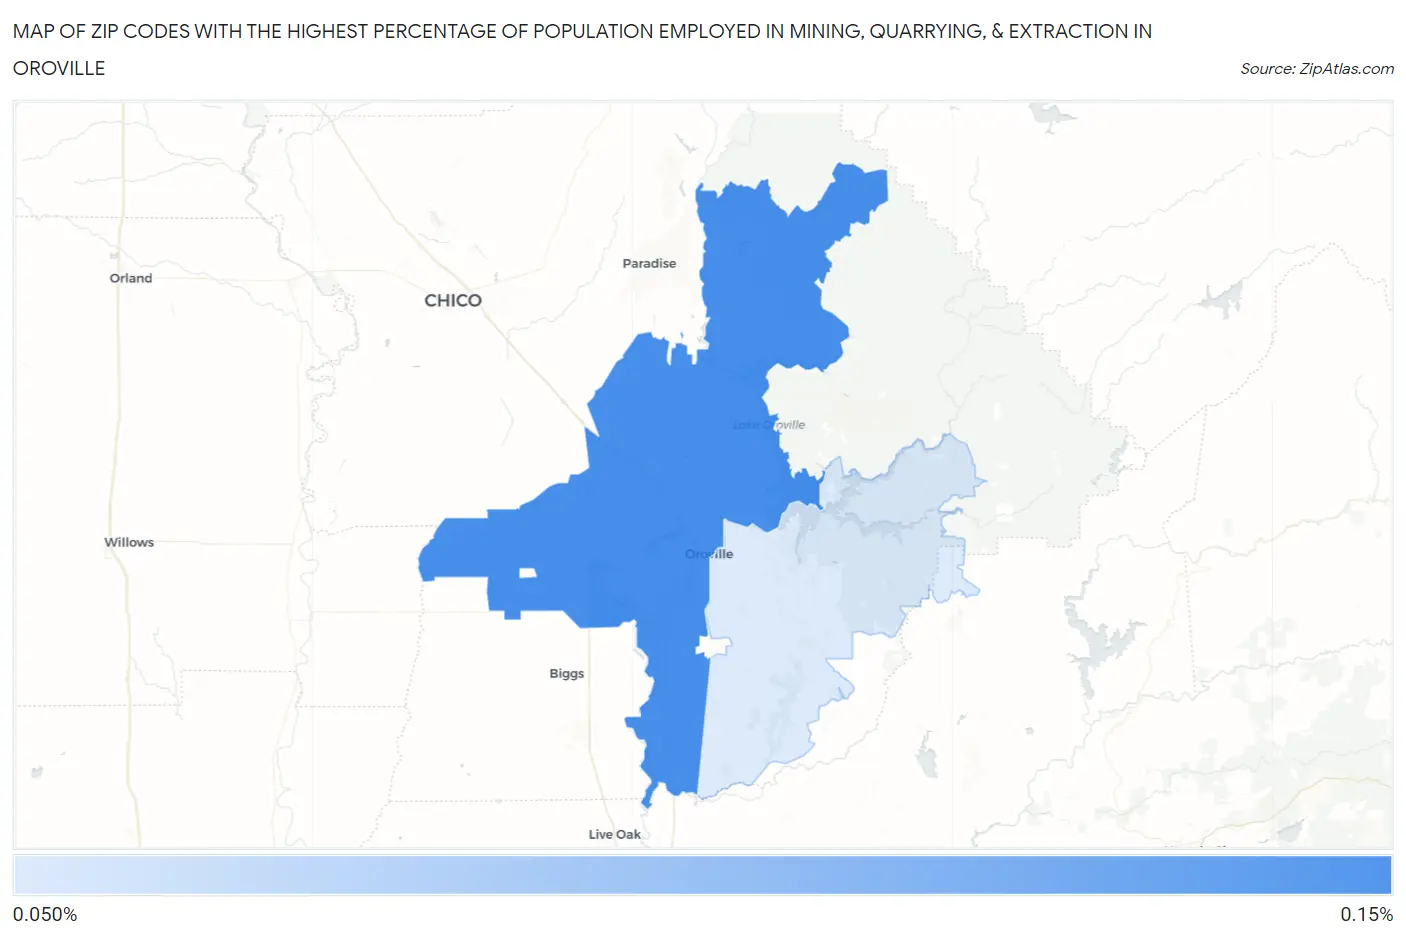
Map of Zip Codes with the Highest Percentage of Population Employed in Mining, Quarrying, & Extraction in Oroville
0.12%
0.14%
Zip Codes with the Highest Percentage of Population Employed in Mining, Quarrying, & Extraction in Oroville, CA
| Zip Code | % Employed | vs State | vs National | |
| 1. | 95965 | 0.14% | 0.12%(+0.018)#254 | 0.44%(-0.299)#10,220 |
| 2. | 95966 | 0.12% | 0.12%(-0.008)#288 | 0.44%(-0.325)#10,568 |
1
Common Questions
What are the Top Zip Codes with the Highest Percentage of Population Employed in Mining, Quarrying, & Extraction in Oroville, CA?
Top Zip Codes with the Highest Percentage of Population Employed in Mining, Quarrying, & Extraction in Oroville, CA are:
What zip code has the Highest Percentage of Population Employed in Mining, Quarrying, & Extraction in Oroville, CA?
95965 has the Highest Percentage of Population Employed in Mining, Quarrying, & Extraction in Oroville, CA with 0.14%.
What is the Percentage of Population Employed in Mining, Quarrying, & Extraction in California?
Percentage of Population Employed in Mining, Quarrying, & Extraction in California is 0.12%.
What is the Percentage of Population Employed in Mining, Quarrying, & Extraction in the United States?
Percentage of Population Employed in Mining, Quarrying, & Extraction in the United States is 0.44%.