Zip Codes with the Highest Percentage of Population Employed in Farming, Fishing & Forestry in North Little Rock, AR
RELATED REPORTS & OPTIONS
Farming, Fishing & Forestry
North Little Rock
Compare Zip Codes
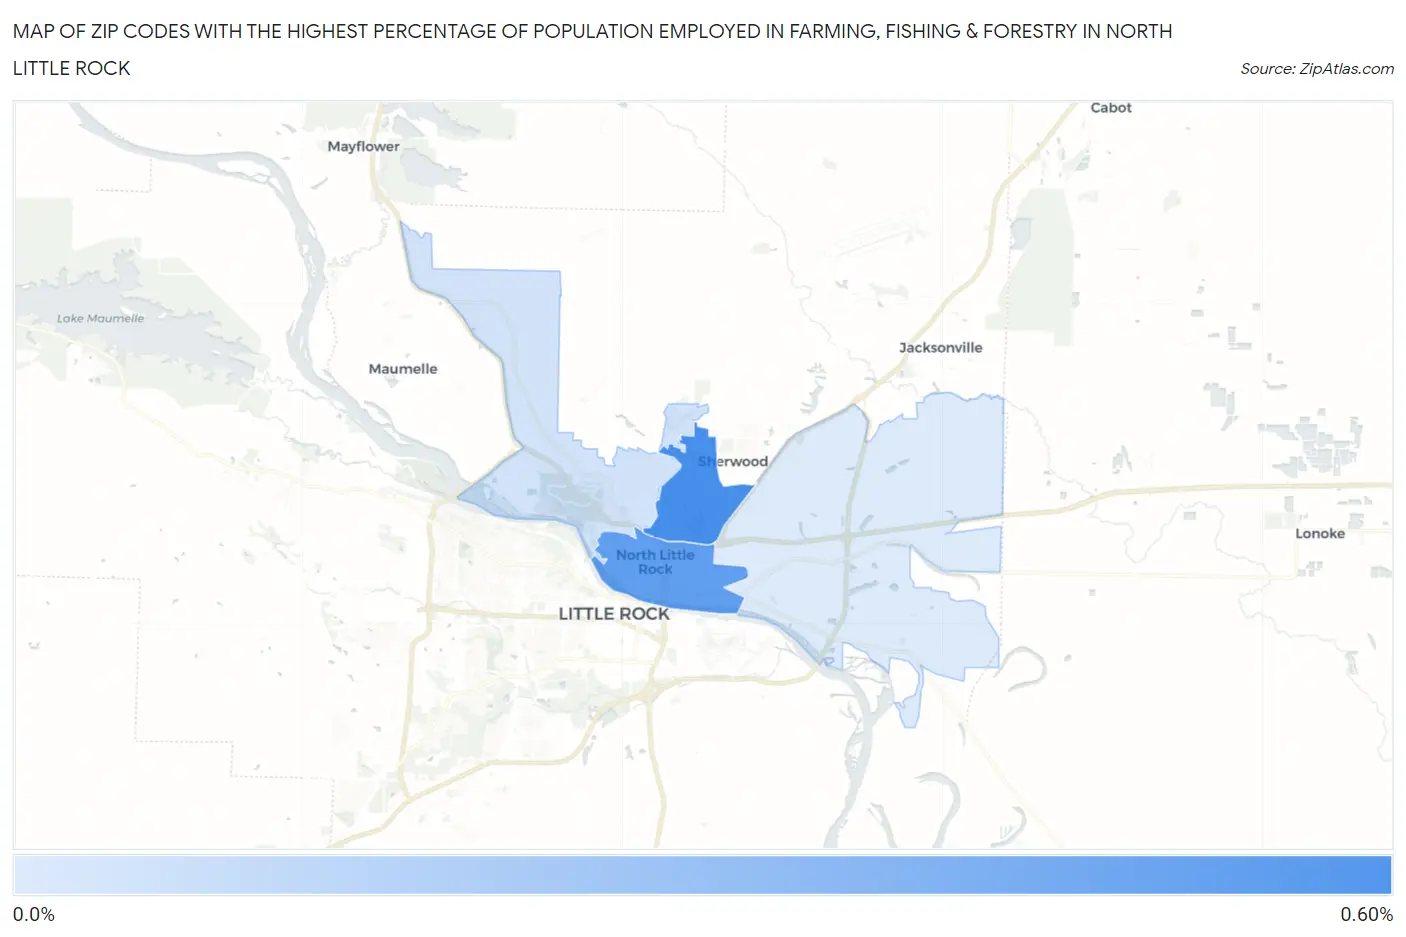
Map of Zip Codes with the Highest Percentage of Population Employed in Farming, Fishing & Forestry in North Little Rock
0.018%
0.59%
Zip Codes with the Highest Percentage of Population Employed in Farming, Fishing & Forestry in North Little Rock, AR
| Zip Code | % Employed | vs State | vs National | |
| 1. | 72116 | 0.59% | 0.96%(-0.365)#275 | 0.61%(-0.013)#12,095 |
| 2. | 72114 | 0.49% | 0.96%(-0.465)#288 | 0.61%(-0.113)#12,905 |
| 3. | 72118 | 0.065% | 0.96%(-0.892)#345 | 0.61%(-0.540)#18,376 |
| 4. | 72117 | 0.018% | 0.96%(-0.940)#351 | 0.61%(-0.588)#19,088 |
1
Common Questions
What are the Top 3 Zip Codes with the Highest Percentage of Population Employed in Farming, Fishing & Forestry in North Little Rock, AR?
Top 3 Zip Codes with the Highest Percentage of Population Employed in Farming, Fishing & Forestry in North Little Rock, AR are:
What zip code has the Highest Percentage of Population Employed in Farming, Fishing & Forestry in North Little Rock, AR?
72116 has the Highest Percentage of Population Employed in Farming, Fishing & Forestry in North Little Rock, AR with 0.59%.
What is the Percentage of Population Employed in Farming, Fishing & Forestry in North Little Rock, AR?
Percentage of Population Employed in Farming, Fishing & Forestry in North Little Rock is 0.29%.
What is the Percentage of Population Employed in Farming, Fishing & Forestry in Arkansas?
Percentage of Population Employed in Farming, Fishing & Forestry in Arkansas is 0.96%.
What is the Percentage of Population Employed in Farming, Fishing & Forestry in the United States?
Percentage of Population Employed in Farming, Fishing & Forestry in the United States is 0.61%.