Powdersville, SC Map & Demographics
Powdersville Map
Powdersville Overview
$35,924
PER CAPITA INCOME
$91,471
AVG FAMILY INCOME
$81,375
AVG HOUSEHOLD INCOME
20.3%
WAGE / INCOME GAP [ % ]
79.7¢/ $1
WAGE / INCOME GAP [ $ ]
0.39
INEQUALITY / GINI INDEX
10,678
TOTAL POPULATION
5,712
MALE POPULATION
4,966
FEMALE POPULATION
115.02
MALES / 100 FEMALES
86.94
FEMALES / 100 MALES
40.7
MEDIAN AGE
3.1
AVG FAMILY SIZE
2.8
AVG HOUSEHOLD SIZE
5,764
LABOR FORCE [ PEOPLE ]
66.2%
PERCENT IN LABOR FORCE
3.3%
UNEMPLOYMENT RATE
Powdersville Area Codes
Income in Powdersville
Income Overview in Powdersville
Per Capita Income in Powdersville is $35,924, while median incomes of families and households are $91,471 and $81,375 respectively.
| Characteristic | Number | Measure |
| Per Capita Income | 10,678 | $35,924 |
| Median Family Income | 2,966 | $91,471 |
| Mean Family Income | 2,966 | $103,708 |
| Median Household Income | 3,794 | $81,375 |
| Mean Household Income | 3,794 | $97,748 |
| Income Deficit | 2,966 | $0 |
| Wage / Income Gap (%) | 10,678 | 20.29% |
| Wage / Income Gap ($) | 10,678 | 79.71¢ per $1 |
| Gini / Inequality Index | 10,678 | 0.39 |
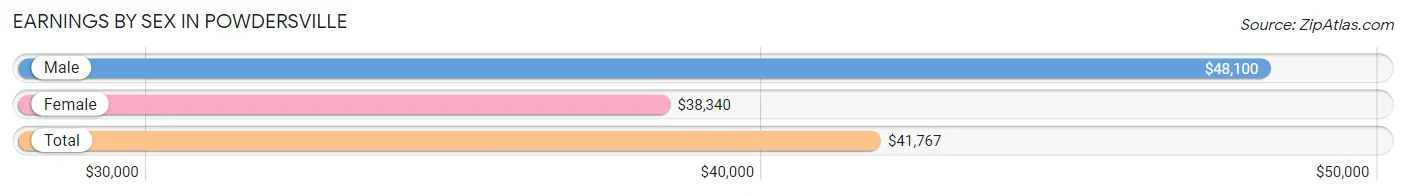
Earnings by Sex in Powdersville
Average Earnings in Powdersville are $41,767, $48,100 for men and $38,340 for women, a difference of 20.3%.
| Sex | Number | Average Earnings |
| Male | 3,422 (58.3%) | $48,100 |
| Female | 2,449 (41.7%) | $38,340 |
| Total | 5,871 (100.0%) | $41,767 |
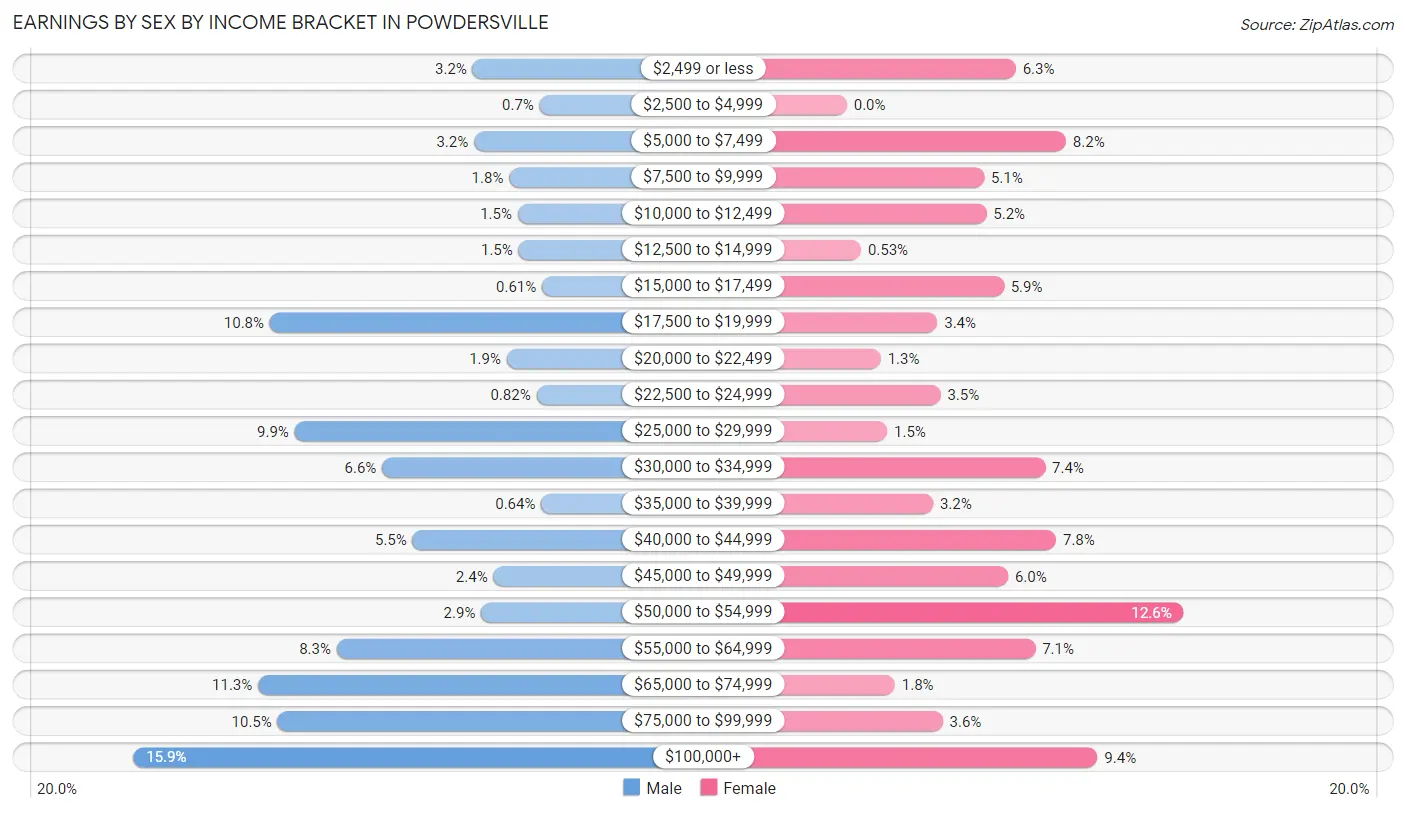
Earnings by Sex by Income Bracket in Powdersville
The most common earnings brackets in Powdersville are $100,000+ for men (545 | 15.9%) and $50,000 to $54,999 for women (309 | 12.6%).
| Income | Male | Female |
| $2,499 or less | 110 (3.2%) | 155 (6.3%) |
| $2,500 to $4,999 | 24 (0.7%) | 0 (0.0%) |
| $5,000 to $7,499 | 108 (3.2%) | 201 (8.2%) |
| $7,500 to $9,999 | 63 (1.8%) | 126 (5.1%) |
| $10,000 to $12,499 | 52 (1.5%) | 128 (5.2%) |
| $12,500 to $14,999 | 51 (1.5%) | 13 (0.5%) |
| $15,000 to $17,499 | 21 (0.6%) | 144 (5.9%) |
| $17,500 to $19,999 | 370 (10.8%) | 83 (3.4%) |
| $20,000 to $22,499 | 66 (1.9%) | 31 (1.3%) |
| $22,500 to $24,999 | 28 (0.8%) | 86 (3.5%) |
| $25,000 to $29,999 | 338 (9.9%) | 37 (1.5%) |
| $30,000 to $34,999 | 226 (6.6%) | 182 (7.4%) |
| $35,000 to $39,999 | 22 (0.6%) | 79 (3.2%) |
| $40,000 to $44,999 | 187 (5.5%) | 192 (7.8%) |
| $45,000 to $49,999 | 83 (2.4%) | 148 (6.0%) |
| $50,000 to $54,999 | 99 (2.9%) | 309 (12.6%) |
| $55,000 to $64,999 | 284 (8.3%) | 173 (7.1%) |
| $65,000 to $74,999 | 385 (11.3%) | 44 (1.8%) |
| $75,000 to $99,999 | 360 (10.5%) | 88 (3.6%) |
| $100,000+ | 545 (15.9%) | 230 (9.4%) |
| Total | 3,422 (100.0%) | 2,449 (100.0%) |
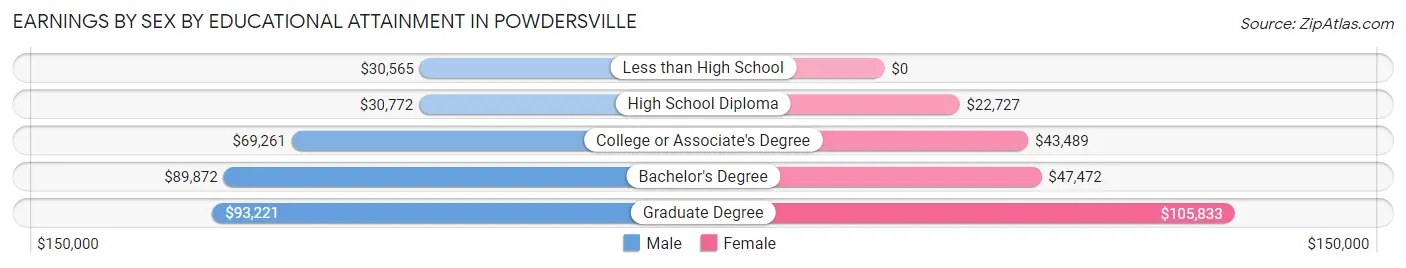
Earnings by Sex by Educational Attainment in Powdersville
Average earnings in Powdersville are $57,745 for men and $41,708 for women, a difference of 27.8%. Men with an educational attainment of graduate degree enjoy the highest average annual earnings of $93,221, while those with less than high school education earn the least with $30,565. Women with an educational attainment of graduate degree earn the most with the average annual earnings of $105,833, while those with high school diploma education have the smallest earnings of $22,727.
| Educational Attainment | Male Income | Female Income |
| Less than High School | $30,565 | $0 |
| High School Diploma | $30,772 | $22,727 |
| College or Associate's Degree | $69,261 | $43,489 |
| Bachelor's Degree | $89,872 | $47,472 |
| Graduate Degree | $93,221 | $105,833 |
| Total | $57,745 | $41,708 |
Family Income in Powdersville
Family Income Brackets in Powdersville
According to the Powdersville family income data, there are 810 families falling into the $100,000 to $149,999 income range, which is the most common income bracket and makes up 27.3% of all families. Conversely, the $15,000 to $24,999 income bracket is the least frequent group with only 21 families (0.7%) belonging to this category.
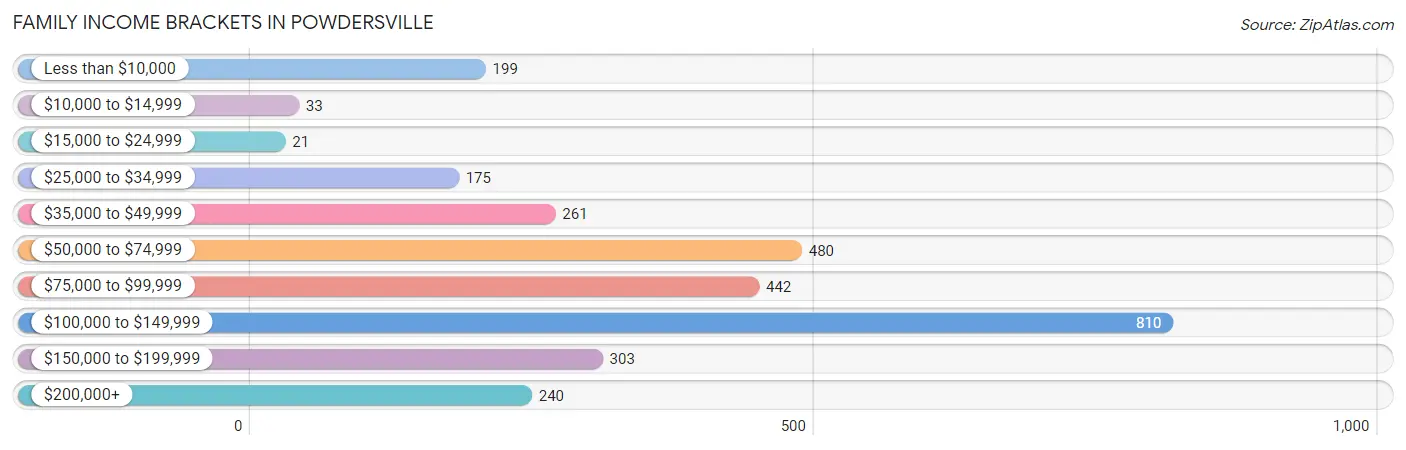
| Income Bracket | # Families | % Families |
| Less than $10,000 | 199 | 6.7% |
| $10,000 to $14,999 | 33 | 1.1% |
| $15,000 to $24,999 | 21 | 0.7% |
| $25,000 to $34,999 | 175 | 5.9% |
| $35,000 to $49,999 | 261 | 8.8% |
| $50,000 to $74,999 | 480 | 16.2% |
| $75,000 to $99,999 | 442 | 14.9% |
| $100,000 to $149,999 | 810 | 27.3% |
| $150,000 to $199,999 | 303 | 10.2% |
| $200,000+ | 240 | 8.1% |
Family Income by Famaliy Size in Powdersville
4-person families (506 | 17.1%) account for the highest median family income in Powdersville with $103,771 per family, while 2-person families (1,550 | 52.3%) have the highest median income of $39,732 per family member.
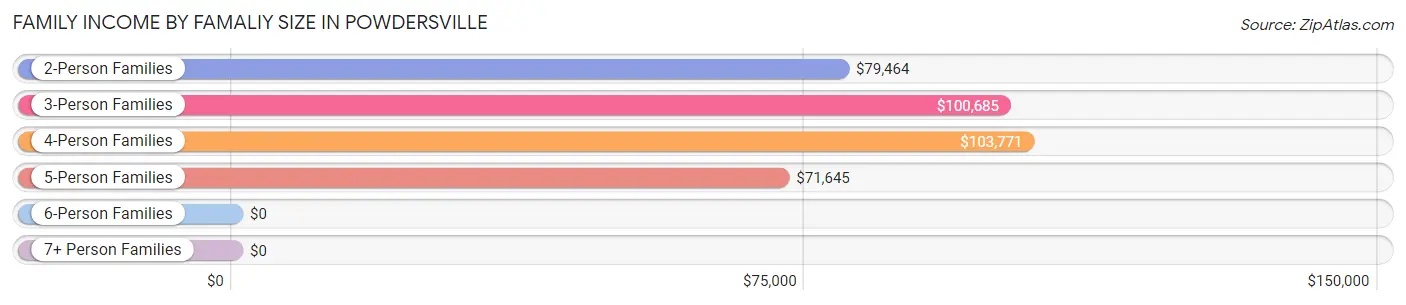
| Income Bracket | # Families | Median Income |
| 2-Person Families | 1,550 (52.3%) | $79,464 |
| 3-Person Families | 591 (19.9%) | $100,685 |
| 4-Person Families | 506 (17.1%) | $103,771 |
| 5-Person Families | 245 (8.3%) | $71,645 |
| 6-Person Families | 13 (0.4%) | $0 |
| 7+ Person Families | 61 (2.1%) | $0 |
| Total | 2,966 (100.0%) | $91,471 |
Family Income by Number of Earners in Powdersville
The median family income in Powdersville is $91,471, with families comprising 2 earners (1,287) having the highest median family income of $121,417, while families with no earners (625) have the lowest median family income of $35,694, accounting for 43.4% and 21.1% of families, respectively.
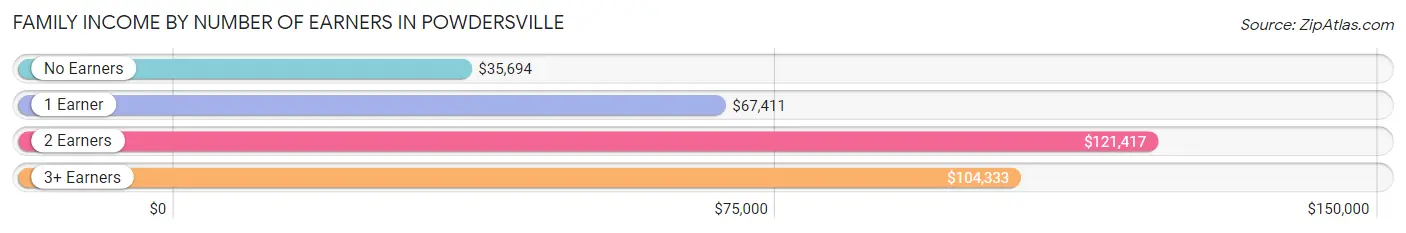
| Number of Earners | # Families | Median Income |
| No Earners | 625 (21.1%) | $35,694 |
| 1 Earner | 738 (24.9%) | $67,411 |
| 2 Earners | 1,287 (43.4%) | $121,417 |
| 3+ Earners | 316 (10.6%) | $104,333 |
| Total | 2,966 (100.0%) | $91,471 |
Household Income in Powdersville
Household Income Brackets in Powdersville
With 835 households falling in the category, the $100,000 to $149,999 income range is the most frequent in Powdersville, accounting for 22.0% of all households. In contrast, only 68 households (1.8%) fall into the $15,000 to $24,999 income bracket, making it the least populous group.
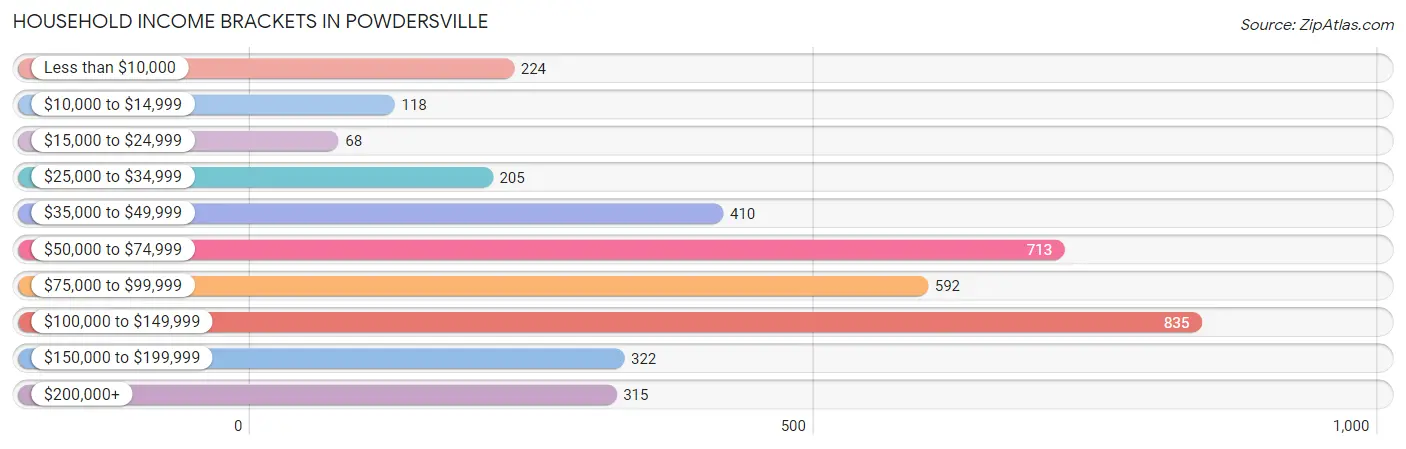
| Income Bracket | # Households | % Households |
| Less than $10,000 | 224 | 5.9% |
| $10,000 to $14,999 | 118 | 3.1% |
| $15,000 to $24,999 | 68 | 1.8% |
| $25,000 to $34,999 | 205 | 5.4% |
| $35,000 to $49,999 | 410 | 10.8% |
| $50,000 to $74,999 | 713 | 18.8% |
| $75,000 to $99,999 | 592 | 15.6% |
| $100,000 to $149,999 | 835 | 22.0% |
| $150,000 to $199,999 | 322 | 8.5% |
| $200,000+ | 315 | 8.3% |
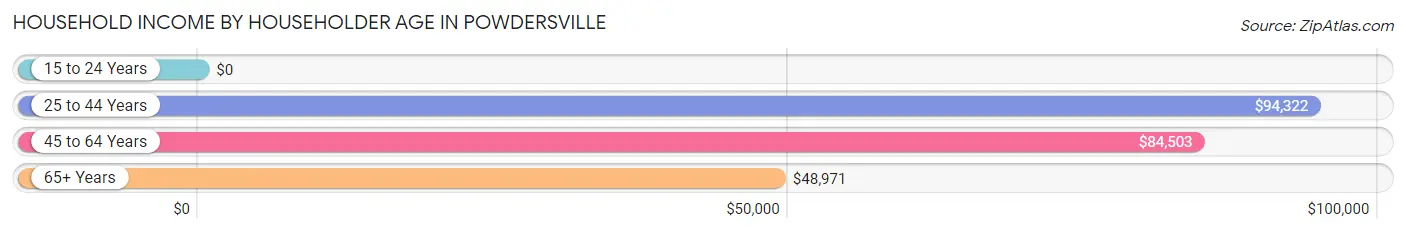
Household Income by Householder Age in Powdersville
The median household income in Powdersville is $81,375, with the highest median household income of $94,322 found in the 25 to 44 years age bracket for the primary householder. A total of 1,306 households (34.4%) fall into this category.
| Income Bracket | # Households | Median Income |
| 15 to 24 Years | 0 (0.0%) | $0 |
| 25 to 44 Years | 1,306 (34.4%) | $94,322 |
| 45 to 64 Years | 1,537 (40.5%) | $84,503 |
| 65+ Years | 951 (25.1%) | $48,971 |
| Total | 3,794 (100.0%) | $81,375 |
Poverty in Powdersville
Income Below Poverty by Sex and Age in Powdersville
With 14.2% poverty level for males and 7.2% for females among the residents of Powdersville, 16 and 17 year old males and 12 to 14 year old females are the most vulnerable to poverty, with 112 males (63.3%) and 45 females (19.4%) in their respective age groups living below the poverty level.
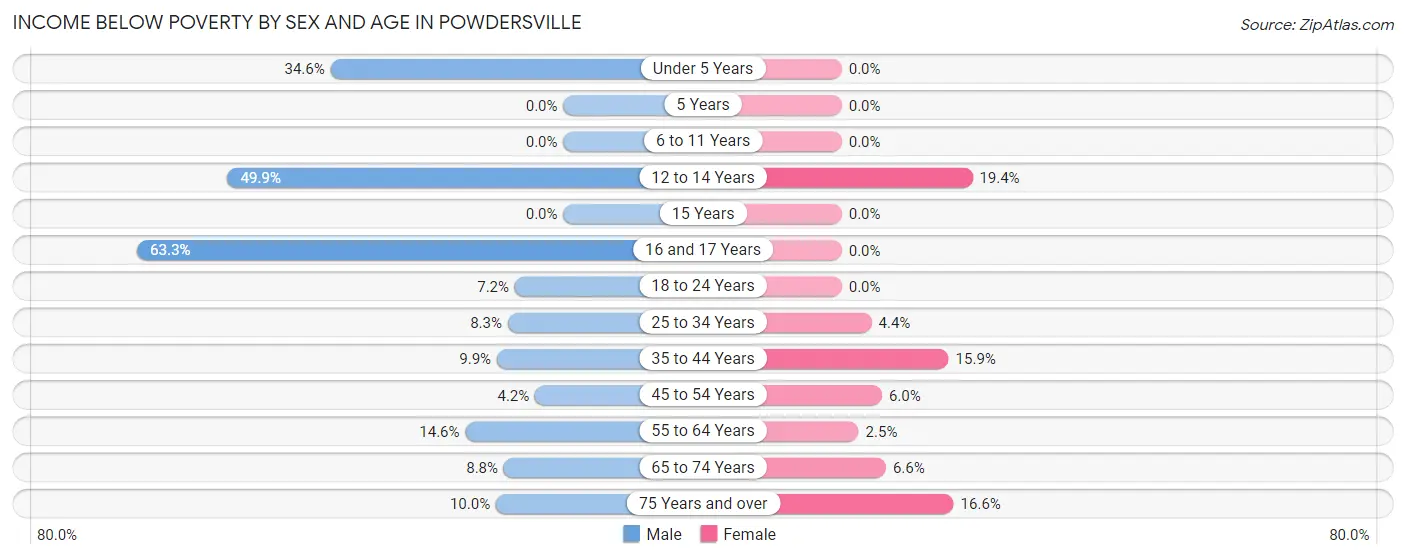
| Age Bracket | Male | Female |
| Under 5 Years | 112 (34.6%) | 0 (0.0%) |
| 5 Years | 0 (0.0%) | 0 (0.0%) |
| 6 to 11 Years | 0 (0.0%) | 0 (0.0%) |
| 12 to 14 Years | 191 (49.9%) | 45 (19.4%) |
| 15 Years | 0 (0.0%) | 0 (0.0%) |
| 16 and 17 Years | 112 (63.3%) | 0 (0.0%) |
| 18 to 24 Years | 39 (7.2%) | 0 (0.0%) |
| 25 to 34 Years | 73 (8.3%) | 29 (4.4%) |
| 35 to 44 Years | 82 (9.9%) | 137 (15.9%) |
| 45 to 54 Years | 31 (4.2%) | 41 (6.0%) |
| 55 to 64 Years | 96 (14.5%) | 15 (2.5%) |
| 65 to 74 Years | 52 (8.8%) | 45 (6.6%) |
| 75 Years and over | 19 (10.0%) | 46 (16.6%) |
| Total | 807 (14.2%) | 358 (7.2%) |
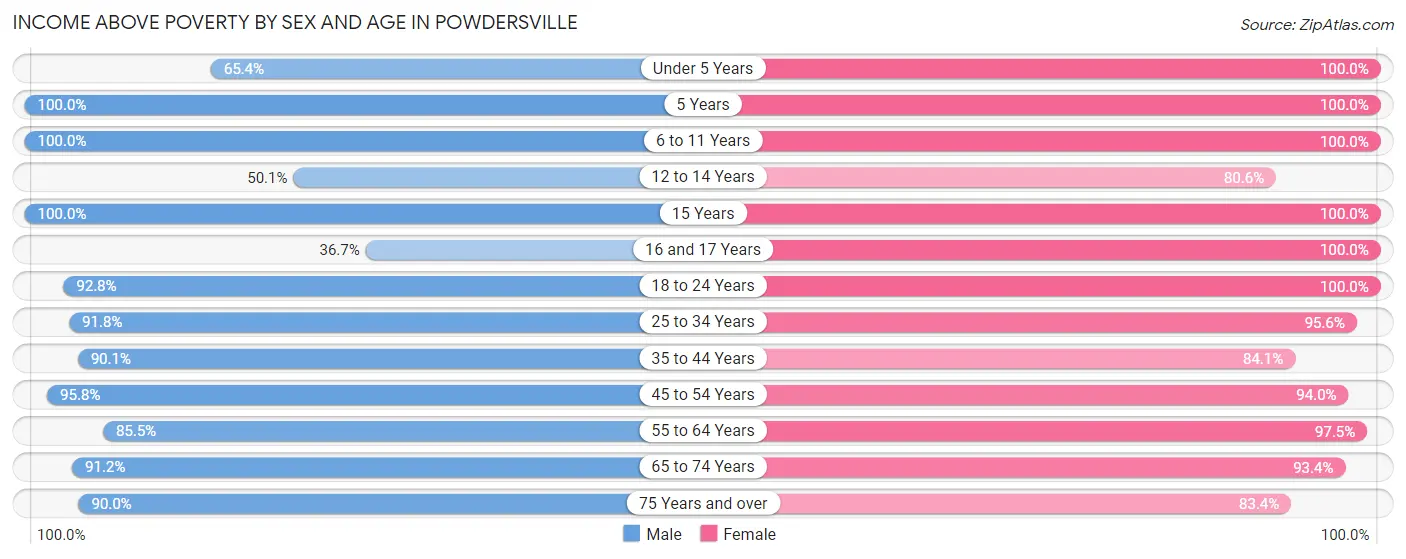
Income Above Poverty by Sex and Age in Powdersville
According to the poverty statistics in Powdersville, males aged 5 years and females aged under 5 years are the age groups that are most secure financially, with 100.0% of males and 100.0% of females in these age groups living above the poverty line.
| Age Bracket | Male | Female |
| Under 5 Years | 212 (65.4%) | 248 (100.0%) |
| 5 Years | 56 (100.0%) | 29 (100.0%) |
| 6 to 11 Years | 288 (100.0%) | 313 (100.0%) |
| 12 to 14 Years | 192 (50.1%) | 187 (80.6%) |
| 15 Years | 34 (100.0%) | 21 (100.0%) |
| 16 and 17 Years | 65 (36.7%) | 104 (100.0%) |
| 18 to 24 Years | 503 (92.8%) | 219 (100.0%) |
| 25 to 34 Years | 812 (91.7%) | 626 (95.6%) |
| 35 to 44 Years | 750 (90.1%) | 726 (84.1%) |
| 45 to 54 Years | 709 (95.8%) | 646 (94.0%) |
| 55 to 64 Years | 564 (85.5%) | 586 (97.5%) |
| 65 to 74 Years | 537 (91.2%) | 641 (93.4%) |
| 75 Years and over | 171 (90.0%) | 231 (83.4%) |
| Total | 4,893 (85.8%) | 4,577 (92.7%) |
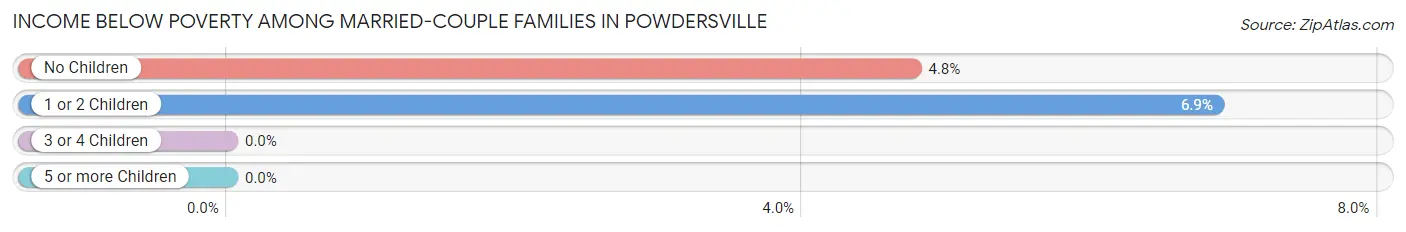
Income Below Poverty Among Married-Couple Families in Powdersville
The poverty statistics for married-couple families in Powdersville show that 5.0% or 112 of the total 2,231 families live below the poverty line. Families with 1 or 2 children have the highest poverty rate of 6.9%, comprising of 41 families. On the other hand, families with 3 or 4 children have the lowest poverty rate of 0.0%, which includes 0 families.
| Children | Above Poverty | Below Poverty |
| No Children | 1,421 (95.2%) | 71 (4.8%) |
| 1 or 2 Children | 556 (93.1%) | 41 (6.9%) |
| 3 or 4 Children | 81 (100.0%) | 0 (0.0%) |
| 5 or more Children | 61 (100.0%) | 0 (0.0%) |
| Total | 2,119 (95.0%) | 112 (5.0%) |
Income Below Poverty Among Single-Parent Households in Powdersville
According to the poverty data in Powdersville, 31.4% or 82 single-father households and 12.4% or 59 single-mother households are living below the poverty line. Among single-father households, those with 3 or 4 children have the highest poverty rate, with 82 households (100.0%) experiencing poverty. Likewise, among single-mother households, those with 1 or 2 children have the highest poverty rate, with 38 households (20.5%) falling below the poverty line.
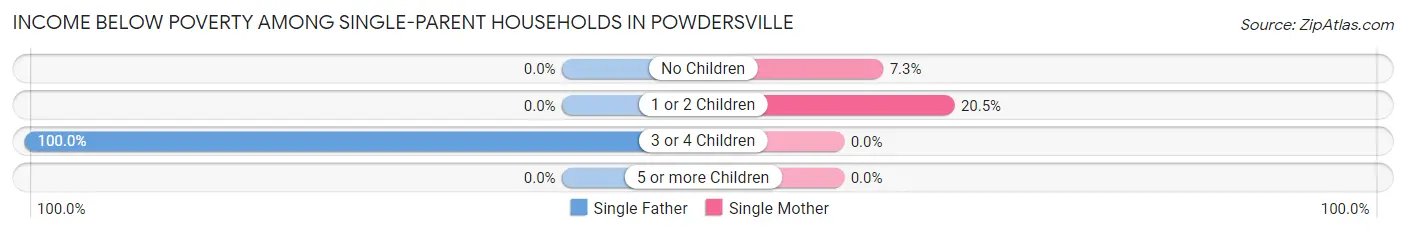
| Children | Single Father | Single Mother |
| No Children | 0 (0.0%) | 21 (7.3%) |
| 1 or 2 Children | 0 (0.0%) | 38 (20.5%) |
| 3 or 4 Children | 82 (100.0%) | 0 (0.0%) |
| 5 or more Children | 0 (0.0%) | 0 (0.0%) |
| Total | 82 (31.4%) | 59 (12.4%) |
Income Below Poverty Among Married-Couple vs Single-Parent Households in Powdersville
The poverty data for Powdersville shows that 112 of the married-couple family households (5.0%) and 141 of the single-parent households (19.2%) are living below the poverty level. Within the married-couple family households, those with 1 or 2 children have the highest poverty rate, with 41 households (6.9%) falling below the poverty line. Among the single-parent households, those with 3 or 4 children have the highest poverty rate, with 82 household (100.0%) living below poverty.
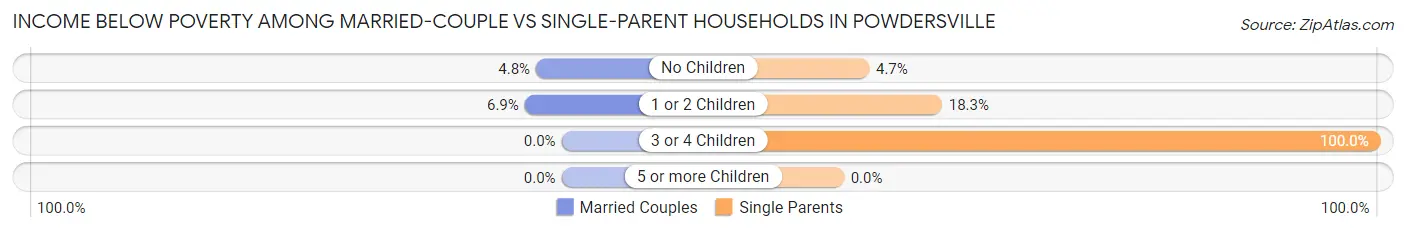
| Children | Married-Couple Families | Single-Parent Households |
| No Children | 71 (4.8%) | 21 (4.7%) |
| 1 or 2 Children | 41 (6.9%) | 38 (18.3%) |
| 3 or 4 Children | 0 (0.0%) | 82 (100.0%) |
| 5 or more Children | 0 (0.0%) | 0 (0.0%) |
| Total | 112 (5.0%) | 141 (19.2%) |
Race in Powdersville
The most populous races in Powdersville are White / Caucasian (8,279 | 77.5%), Black / African American (1,292 | 12.1%), and Hispanic or Latino (579 | 5.4%).
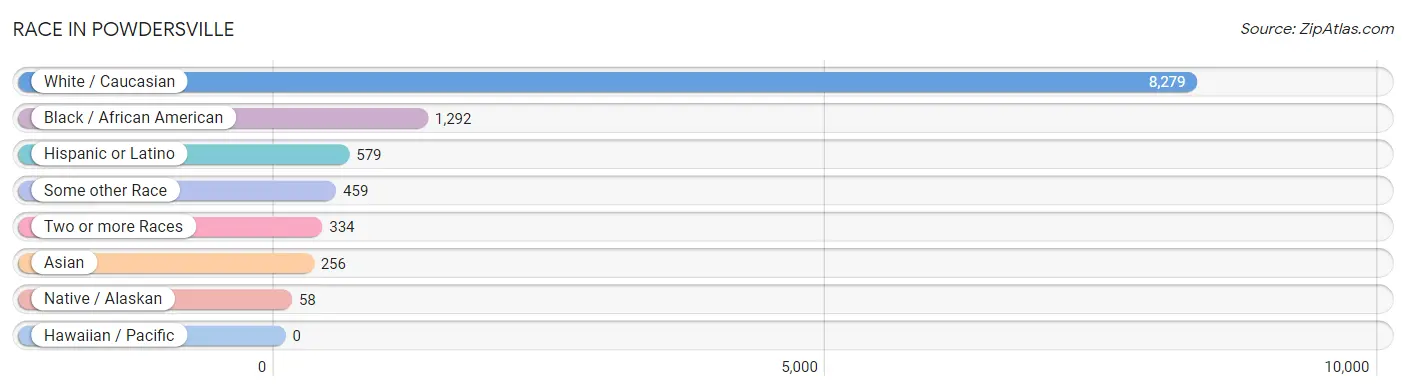
| Race | # Population | % Population |
| Asian | 256 | 2.4% |
| Black / African American | 1,292 | 12.1% |
| Hawaiian / Pacific | 0 | 0.0% |
| Hispanic or Latino | 579 | 5.4% |
| Native / Alaskan | 58 | 0.5% |
| White / Caucasian | 8,279 | 77.5% |
| Two or more Races | 334 | 3.1% |
| Some other Race | 459 | 4.3% |
| Total | 10,678 | 100.0% |
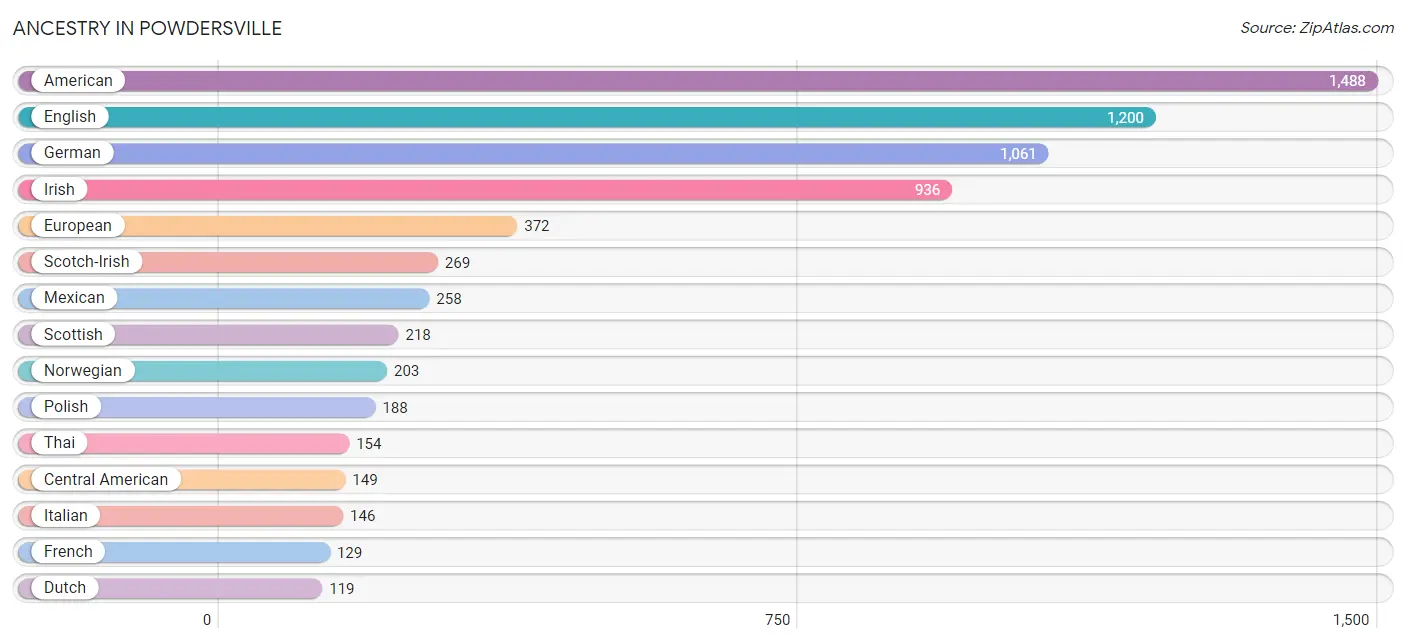
Ancestry in Powdersville
The most populous ancestries reported in Powdersville are American (1,488 | 13.9%), English (1,200 | 11.2%), German (1,061 | 9.9%), Irish (936 | 8.8%), and European (372 | 3.5%), together accounting for 47.4% of all Powdersville residents.
| Ancestry | # Population | % Population |
| Aleut | 11 | 0.1% |
| American | 1,488 | 13.9% |
| Armenian | 85 | 0.8% |
| Austrian | 28 | 0.3% |
| Bhutanese | 41 | 0.4% |
| Brazilian | 52 | 0.5% |
| British | 11 | 0.1% |
| Burmese | 86 | 0.8% |
| Central American | 149 | 1.4% |
| Central American Indian | 20 | 0.2% |
| Cherokee | 32 | 0.3% |
| Colombian | 22 | 0.2% |
| Costa Rican | 38 | 0.4% |
| Dutch | 119 | 1.1% |
| Eastern European | 116 | 1.1% |
| English | 1,200 | 11.2% |
| European | 372 | 3.5% |
| Finnish | 13 | 0.1% |
| French | 129 | 1.2% |
| French Canadian | 105 | 1.0% |
| German | 1,061 | 9.9% |
| Greek | 68 | 0.6% |
| Guatemalan | 40 | 0.4% |
| Honduran | 25 | 0.2% |
| Hungarian | 42 | 0.4% |
| Irish | 936 | 8.8% |
| Italian | 146 | 1.4% |
| Mexican | 258 | 2.4% |
| Norwegian | 203 | 1.9% |
| Panamanian | 29 | 0.3% |
| Polish | 188 | 1.8% |
| Puerto Rican | 19 | 0.2% |
| Russian | 14 | 0.1% |
| Salvadoran | 17 | 0.2% |
| Scandinavian | 40 | 0.4% |
| Scotch-Irish | 269 | 2.5% |
| Scottish | 218 | 2.0% |
| South American | 22 | 0.2% |
| Spaniard | 25 | 0.2% |
| Spanish | 1 | 0.0% |
| Swedish | 9 | 0.1% |
| Swiss | 101 | 0.9% |
| Thai | 154 | 1.4% |
| Ukrainian | 70 | 0.7% |
| Welsh | 13 | 0.1% |
| Yugoslavian | 42 | 0.4% | View All 46 Rows |
Immigrants in Powdersville
The most numerous immigrant groups reported in Powdersville came from Latin America (323 | 3.0%), Central America (301 | 2.8%), Asia (206 | 1.9%), Mexico (196 | 1.8%), and India (104 | 1.0%), together accounting for 10.6% of all Powdersville residents.
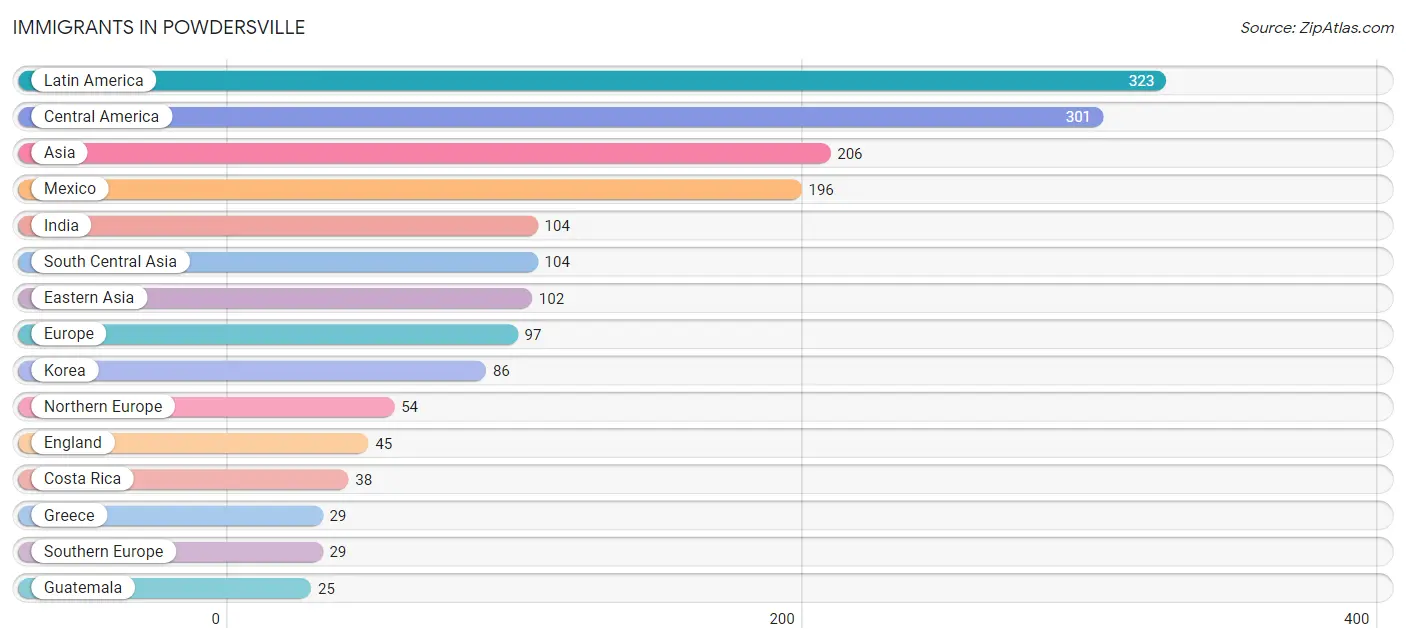
| Immigration Origin | # Population | % Population |
| Asia | 206 | 1.9% |
| Brazil | 22 | 0.2% |
| Central America | 301 | 2.8% |
| Costa Rica | 38 | 0.4% |
| Eastern Asia | 102 | 1.0% |
| Eastern Europe | 14 | 0.1% |
| El Salvador | 17 | 0.2% |
| England | 45 | 0.4% |
| Europe | 97 | 0.9% |
| Greece | 29 | 0.3% |
| Guatemala | 25 | 0.2% |
| Honduras | 25 | 0.2% |
| India | 104 | 1.0% |
| Japan | 16 | 0.2% |
| Korea | 86 | 0.8% |
| Latin America | 323 | 3.0% |
| Latvia | 14 | 0.1% |
| Mexico | 196 | 1.8% |
| Northern Europe | 54 | 0.5% |
| South America | 22 | 0.2% |
| South Central Asia | 104 | 1.0% |
| Southern Europe | 29 | 0.3% | View All 22 Rows |
Sex and Age in Powdersville
Sex and Age in Powdersville
The most populous age groups in Powdersville are 25 to 29 Years (602 | 10.5%) for men and 40 to 44 Years (495 | 10.0%) for women.
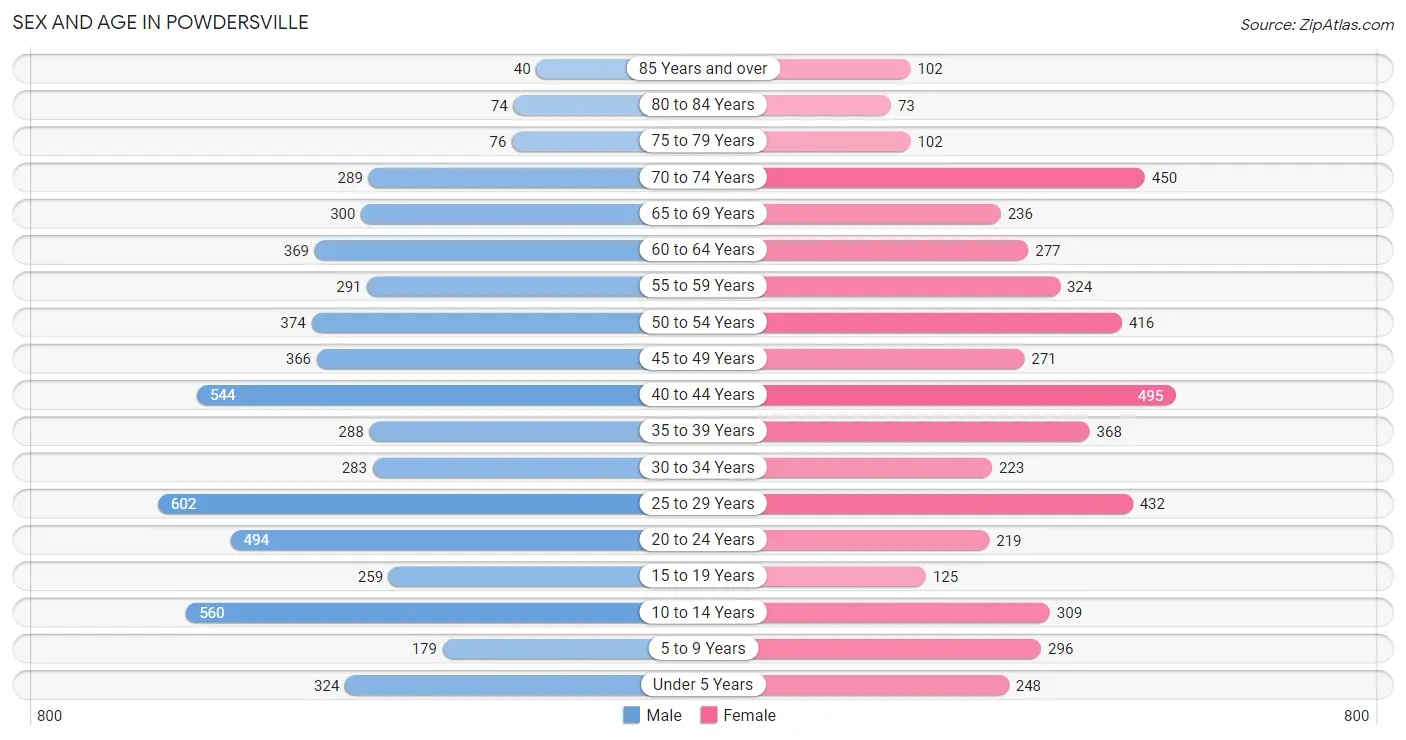
| Age Bracket | Male | Female |
| Under 5 Years | 324 (5.7%) | 248 (5.0%) |
| 5 to 9 Years | 179 (3.1%) | 296 (6.0%) |
| 10 to 14 Years | 560 (9.8%) | 309 (6.2%) |
| 15 to 19 Years | 259 (4.5%) | 125 (2.5%) |
| 20 to 24 Years | 494 (8.6%) | 219 (4.4%) |
| 25 to 29 Years | 602 (10.5%) | 432 (8.7%) |
| 30 to 34 Years | 283 (5.0%) | 223 (4.5%) |
| 35 to 39 Years | 288 (5.0%) | 368 (7.4%) |
| 40 to 44 Years | 544 (9.5%) | 495 (10.0%) |
| 45 to 49 Years | 366 (6.4%) | 271 (5.5%) |
| 50 to 54 Years | 374 (6.6%) | 416 (8.4%) |
| 55 to 59 Years | 291 (5.1%) | 324 (6.5%) |
| 60 to 64 Years | 369 (6.5%) | 277 (5.6%) |
| 65 to 69 Years | 300 (5.2%) | 236 (4.8%) |
| 70 to 74 Years | 289 (5.1%) | 450 (9.1%) |
| 75 to 79 Years | 76 (1.3%) | 102 (2.1%) |
| 80 to 84 Years | 74 (1.3%) | 73 (1.5%) |
| 85 Years and over | 40 (0.7%) | 102 (2.1%) |
| Total | 5,712 (100.0%) | 4,966 (100.0%) |
Families and Households in Powdersville
Median Family Size in Powdersville
The median family size in Powdersville is 3.12 persons per family, with single male/father families (261 | 8.8%) accounting for the largest median family size of 3.59 persons per family. On the other hand, married-couple families (2,231 | 75.2%) represent the smallest median family size with 2.99 persons per family.
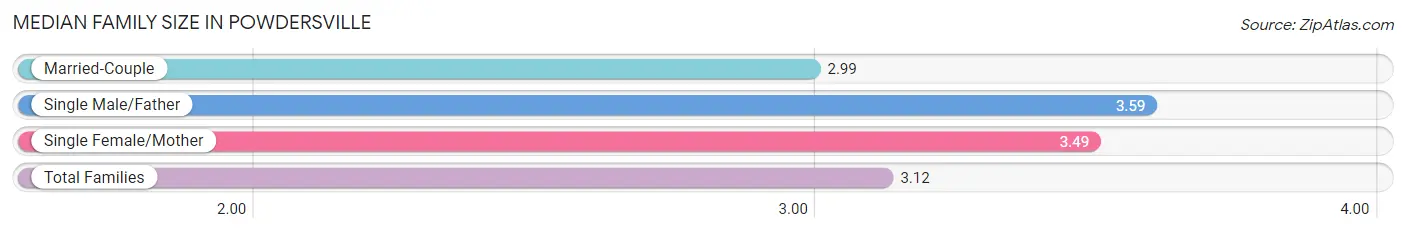
| Family Type | # Families | Family Size |
| Married-Couple | 2,231 (75.2%) | 2.99 |
| Single Male/Father | 261 (8.8%) | 3.59 |
| Single Female/Mother | 474 (16.0%) | 3.49 |
| Total Families | 2,966 (100.0%) | 3.12 |
Median Household Size in Powdersville
The median household size in Powdersville is 2.81 persons per household, with single male/father households (261 | 6.9%) accounting for the largest median household size of 4.24 persons per household. non-family households (828 | 21.8%) represent the smallest median household size with 1.28 persons per household.
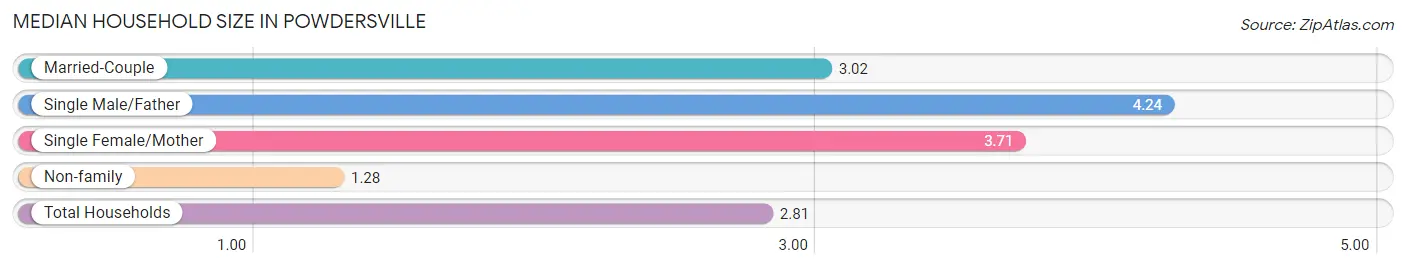
| Household Type | # Households | Household Size |
| Married-Couple | 2,231 (58.8%) | 3.02 |
| Single Male/Father | 261 (6.9%) | 4.24 |
| Single Female/Mother | 474 (12.5%) | 3.71 |
| Non-family | 828 (21.8%) | 1.28 |
| Total Households | 3,794 (100.0%) | 2.81 |
Household Size by Marriage Status in Powdersville
Out of a total of 3,794 households in Powdersville, 2,966 (78.2%) are family households, while 828 (21.8%) are nonfamily households. The most numerous type of family households are 2-person households, comprising 1,422, and the most common type of nonfamily households are 1-person households, comprising 658.
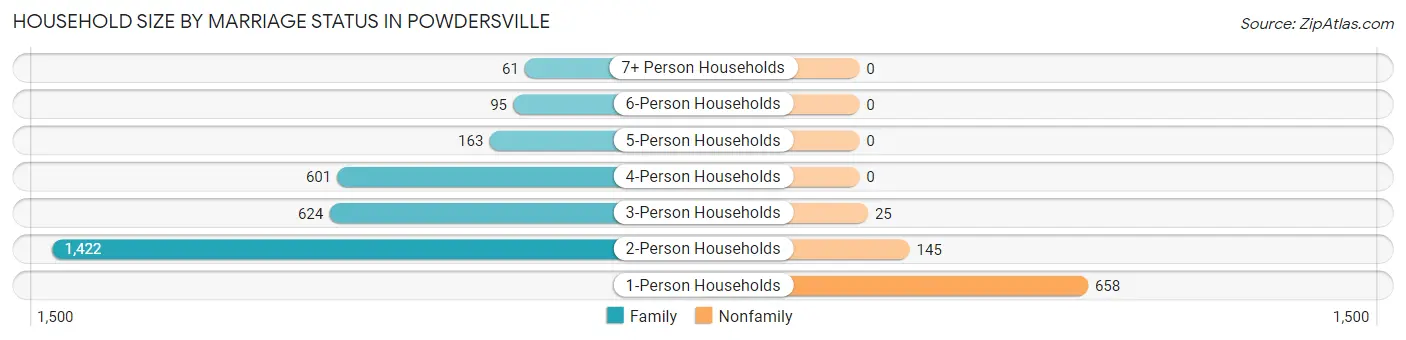
| Household Size | Family Households | Nonfamily Households |
| 1-Person Households | - | 658 (17.3%) |
| 2-Person Households | 1,422 (37.5%) | 145 (3.8%) |
| 3-Person Households | 624 (16.5%) | 25 (0.7%) |
| 4-Person Households | 601 (15.8%) | 0 (0.0%) |
| 5-Person Households | 163 (4.3%) | 0 (0.0%) |
| 6-Person Households | 95 (2.5%) | 0 (0.0%) |
| 7+ Person Households | 61 (1.6%) | 0 (0.0%) |
| Total | 2,966 (78.2%) | 828 (21.8%) |
Female Fertility in Powdersville
Fertility by Age in Powdersville
Average fertility rate in Powdersville is 57.0 births per 1,000 women. Women in the age bracket of 20 to 34 years have the highest fertility rate with 135.0 births per 1,000 women. Women in the age bracket of 20 to 34 years acount for 92.9% of all women with births.
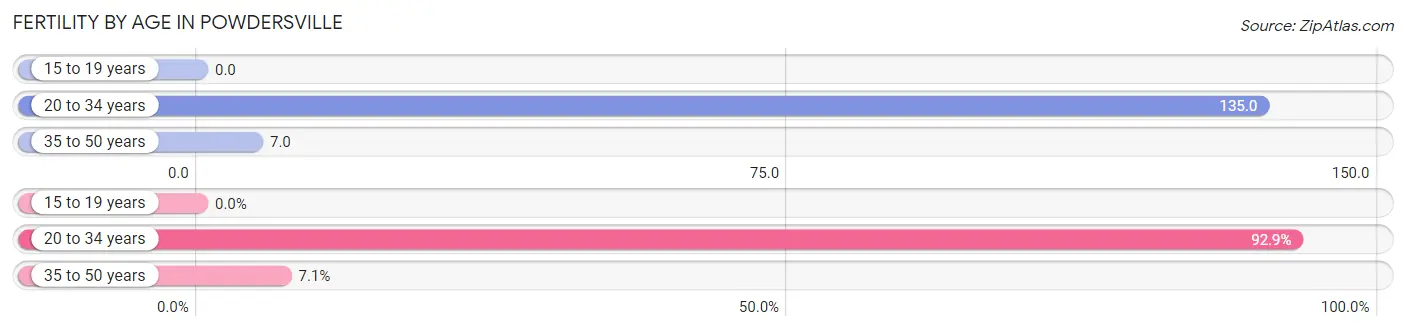
| Age Bracket | Women with Births | Births / 1,000 Women |
| 15 to 19 years | 0 (0.0%) | 0.0 |
| 20 to 34 years | 118 (92.9%) | 135.0 |
| 35 to 50 years | 9 (7.1%) | 7.0 |
| Total | 127 (100.0%) | 57.0 |
Fertility by Age by Marriage Status in Powdersville
7.1% of women with births (127) in Powdersville are married. The highest percentage of unmarried women with births falls into 20 to 34 years age bracket with 100.0% of them unmarried at the time of birth, while the lowest percentage of unmarried women with births belong to 35 to 50 years age bracket with 0.0% of them unmarried.
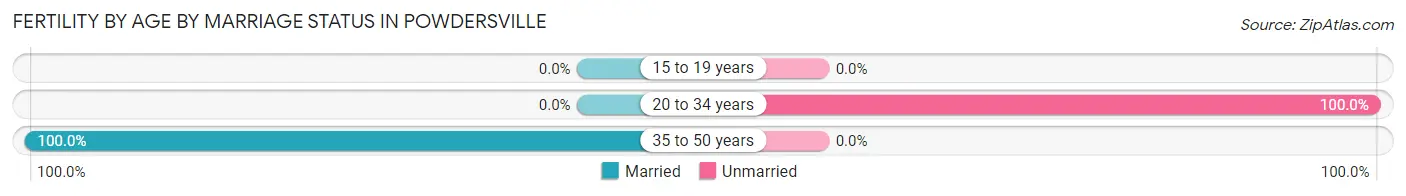
| Age Bracket | Married | Unmarried |
| 15 to 19 years | 0 (0.0%) | 0 (0.0%) |
| 20 to 34 years | 0 (0.0%) | 118 (100.0%) |
| 35 to 50 years | 9 (100.0%) | 0 (0.0%) |
| Total | 9 (7.1%) | 118 (92.9%) |
Fertility by Education in Powdersville
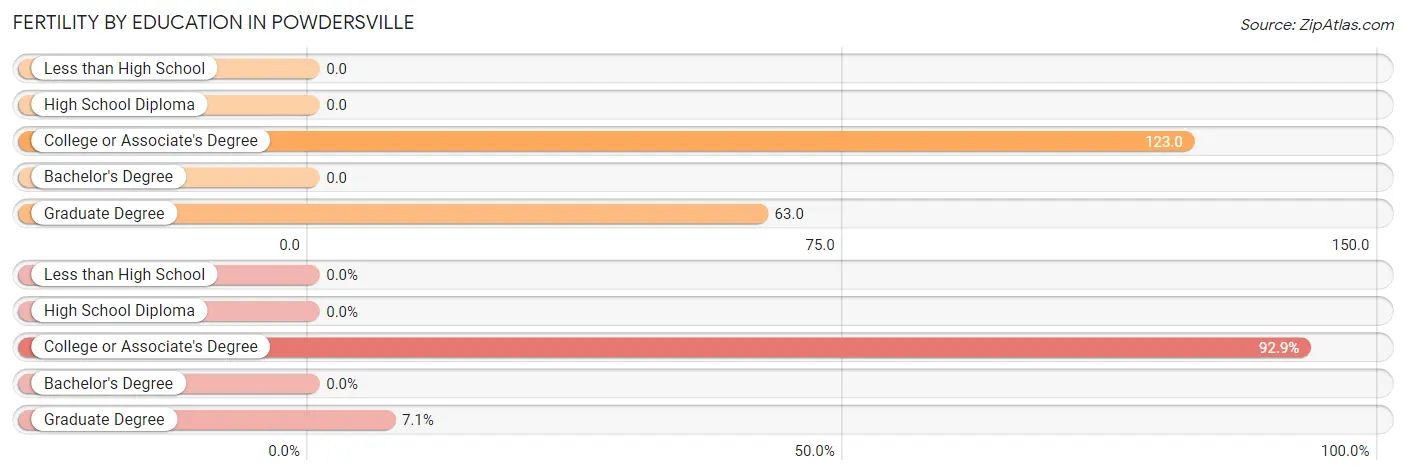
| Educational Attainment | Women with Births | Births / 1,000 Women |
| Less than High School | 0 (0.0%) | 0.0 |
| High School Diploma | 0 (0.0%) | 0.0 |
| College or Associate's Degree | 118 (92.9%) | 123.0 |
| Bachelor's Degree | 0 (0.0%) | 0.0 |
| Graduate Degree | 9 (7.1%) | 63.0 |
| Total | 127 (100.0%) | 57.0 |
Fertility by Education by Marriage Status in Powdersville
92.9% of women with births in Powdersville are unmarried. Women with the educational attainment of graduate degree are most likely to be married with 100.0% of them married at childbirth, while women with the educational attainment of college or associate's degree are least likely to be married with 100.0% of them unmarried at childbirth.
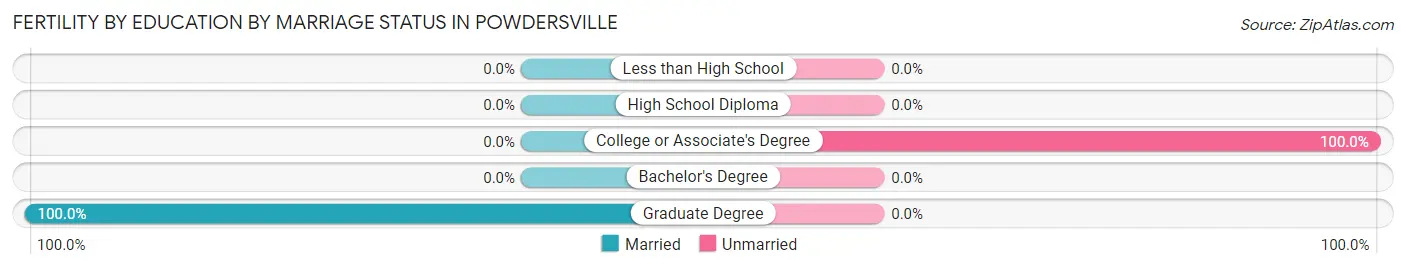
| Educational Attainment | Married | Unmarried |
| Less than High School | 0 (0.0%) | 0 (0.0%) |
| High School Diploma | 0 (0.0%) | 0 (0.0%) |
| College or Associate's Degree | 0 (0.0%) | 118 (100.0%) |
| Bachelor's Degree | 0 (0.0%) | 0 (0.0%) |
| Graduate Degree | 9 (100.0%) | 0 (0.0%) |
| Total | 9 (7.1%) | 118 (92.9%) |
Employment Characteristics in Powdersville
Employment by Class of Employer in Powdersville
Among the 5,548 employed individuals in Powdersville, private company employees (3,884 | 70.0%), not-for-profit organizations (489 | 8.8%), and local government employees (367 | 6.6%) make up the most common classes of employment.
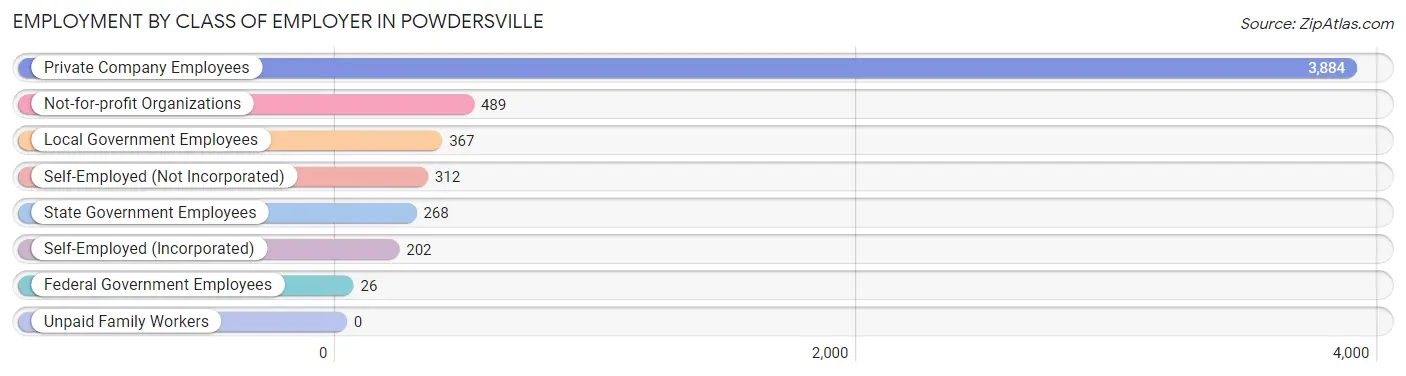
| Employer Class | # Employees | % Employees |
| Private Company Employees | 3,884 | 70.0% |
| Self-Employed (Incorporated) | 202 | 3.6% |
| Self-Employed (Not Incorporated) | 312 | 5.6% |
| Not-for-profit Organizations | 489 | 8.8% |
| Local Government Employees | 367 | 6.6% |
| State Government Employees | 268 | 4.8% |
| Federal Government Employees | 26 | 0.5% |
| Unpaid Family Workers | 0 | 0.0% |
| Total | 5,548 | 100.0% |
Employment Status by Age in Powdersville
According to the labor force statistics for Powdersville, out of the total population over 16 years of age (8,707), 66.2% or 5,764 individuals are in the labor force, with 3.3% or 190 of them unemployed. The age group with the highest labor force participation rate is 25 to 29 years, with 95.4% or 986 individuals in the labor force. Within the labor force, the 16 to 19 years age range has the highest percentage of unemployed individuals, with 50.0% or 24 of them being unemployed.
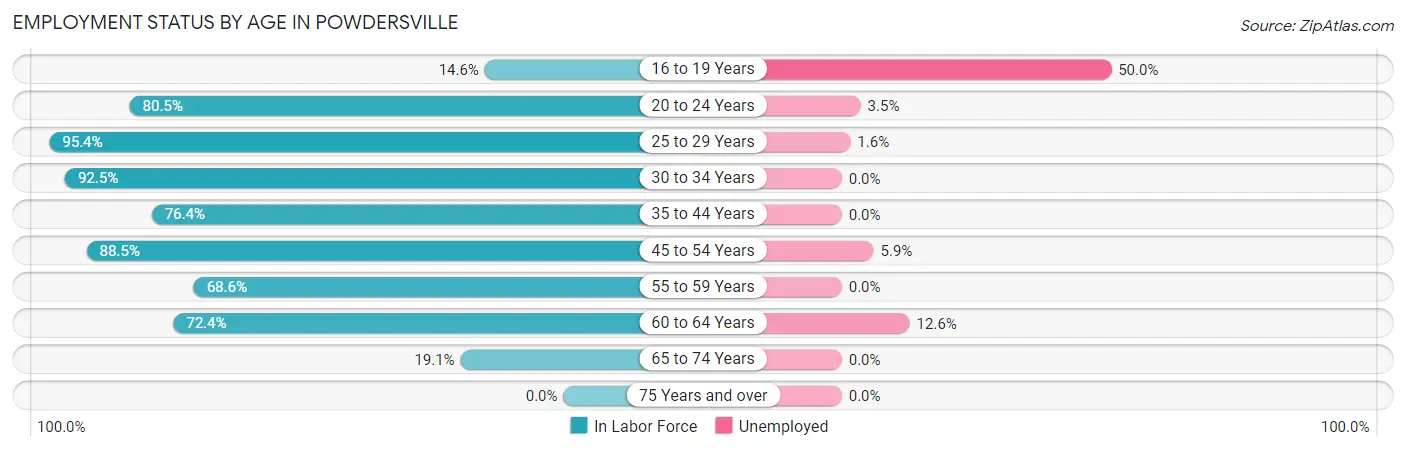
| Age Bracket | In Labor Force | Unemployed |
| 16 to 19 Years | 48 (14.6%) | 24 (50.0%) |
| 20 to 24 Years | 574 (80.5%) | 20 (3.5%) |
| 25 to 29 Years | 986 (95.4%) | 16 (1.6%) |
| 30 to 34 Years | 468 (92.5%) | 0 (0.0%) |
| 35 to 44 Years | 1,295 (76.4%) | 0 (0.0%) |
| 45 to 54 Years | 1,263 (88.5%) | 75 (5.9%) |
| 55 to 59 Years | 422 (68.6%) | 0 (0.0%) |
| 60 to 64 Years | 468 (72.4%) | 59 (12.6%) |
| 65 to 74 Years | 244 (19.1%) | 0 (0.0%) |
| 75 Years and over | 0 (0.0%) | 0 (0.0%) |
| Total | 5,764 (66.2%) | 190 (3.3%) |
Employment Status by Educational Attainment in Powdersville
According to labor force statistics for Powdersville, 82.8% of individuals (4,904) out of the total population between 25 and 64 years of age (5,923) are in the labor force, with 3.0% or 147 of them being unemployed. The group with the highest labor force participation rate are those with the educational attainment of less than high school, with 86.2% or 318 individuals in the labor force. Within the labor force, individuals with high school diploma education have the highest percentage of unemployment, with 7.2% or 88 of them being unemployed.
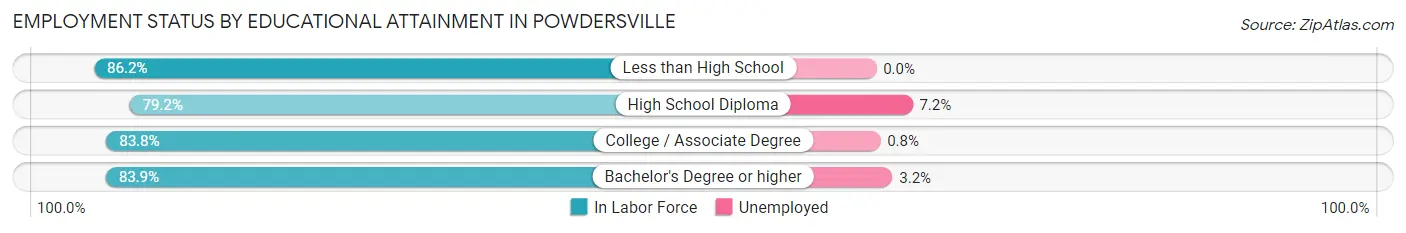
| Educational Attainment | In Labor Force | Unemployed |
| Less than High School | 318 (86.2%) | 0 (0.0%) |
| High School Diploma | 1,222 (79.2%) | 111 (7.2%) |
| College / Associate Degree | 1,940 (83.8%) | 19 (0.8%) |
| Bachelor's Degree or higher | 1,423 (83.9%) | 54 (3.2%) |
| Total | 4,904 (82.8%) | 178 (3.0%) |
Employment Occupations by Sex in Powdersville
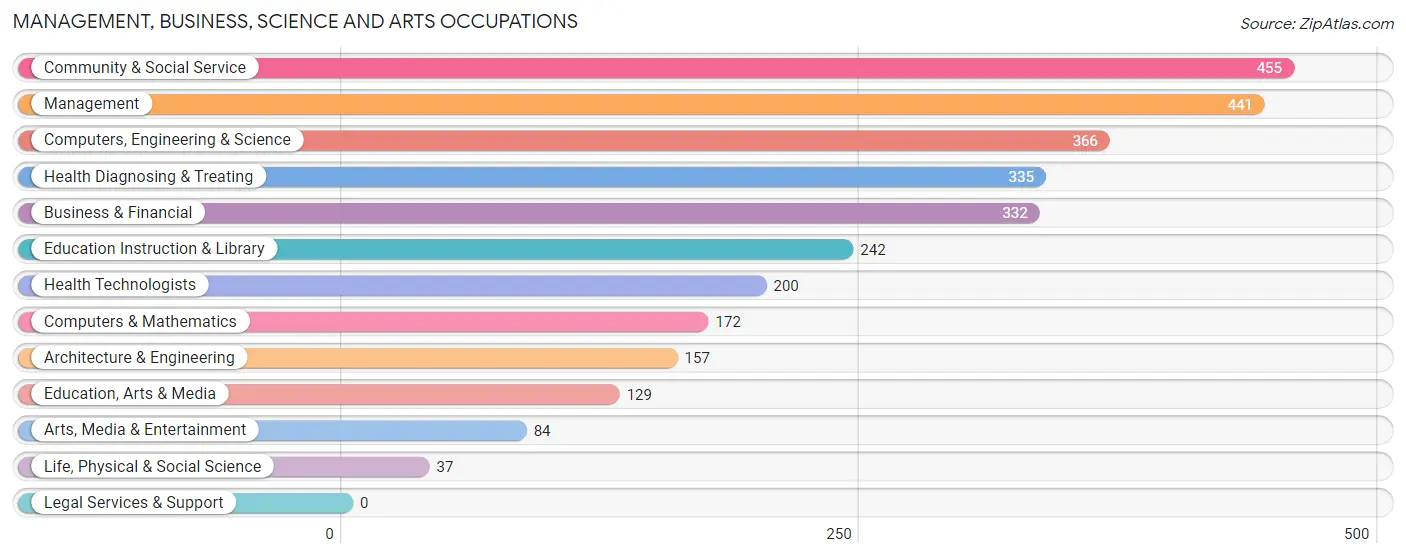
Management, Business, Science and Arts Occupations
The most common Management, Business, Science and Arts occupations in Powdersville are Community & Social Service (455 | 8.2%), Management (441 | 7.9%), Computers, Engineering & Science (366 | 6.6%), Health Diagnosing & Treating (335 | 6.0%), and Business & Financial (332 | 6.0%).
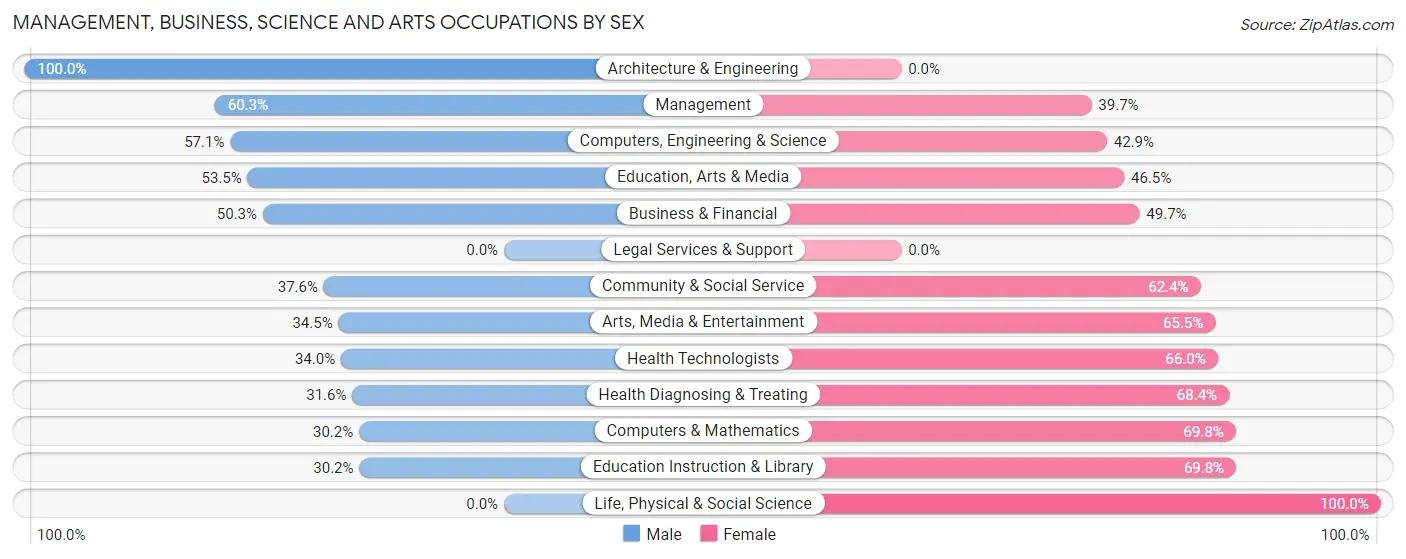
Management, Business, Science and Arts Occupations by Sex
Within the Management, Business, Science and Arts occupations in Powdersville, the most male-oriented occupations are Architecture & Engineering (100.0%), Management (60.3%), and Computers, Engineering & Science (57.1%), while the most female-oriented occupations are Life, Physical & Social Science (100.0%), Education Instruction & Library (69.8%), and Computers & Mathematics (69.8%).
| Occupation | Male | Female |
| Management | 266 (60.3%) | 175 (39.7%) |
| Business & Financial | 167 (50.3%) | 165 (49.7%) |
| Computers, Engineering & Science | 209 (57.1%) | 157 (42.9%) |
| Computers & Mathematics | 52 (30.2%) | 120 (69.8%) |
| Architecture & Engineering | 157 (100.0%) | 0 (0.0%) |
| Life, Physical & Social Science | 0 (0.0%) | 37 (100.0%) |
| Community & Social Service | 171 (37.6%) | 284 (62.4%) |
| Education, Arts & Media | 69 (53.5%) | 60 (46.5%) |
| Legal Services & Support | 0 (0.0%) | 0 (0.0%) |
| Education Instruction & Library | 73 (30.2%) | 169 (69.8%) |
| Arts, Media & Entertainment | 29 (34.5%) | 55 (65.5%) |
| Health Diagnosing & Treating | 106 (31.6%) | 229 (68.4%) |
| Health Technologists | 68 (34.0%) | 132 (66.0%) |
| Total (Category) | 919 (47.6%) | 1,010 (52.4%) |
| Total (Overall) | 3,279 (58.8%) | 2,295 (41.2%) |
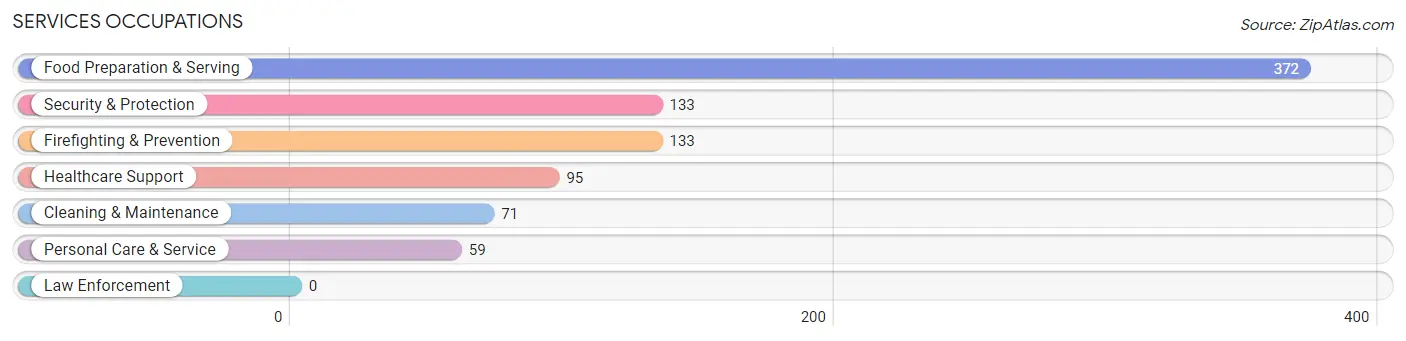
Services Occupations
The most common Services occupations in Powdersville are Food Preparation & Serving (372 | 6.7%), Security & Protection (133 | 2.4%), Firefighting & Prevention (133 | 2.4%), Healthcare Support (95 | 1.7%), and Cleaning & Maintenance (71 | 1.3%).
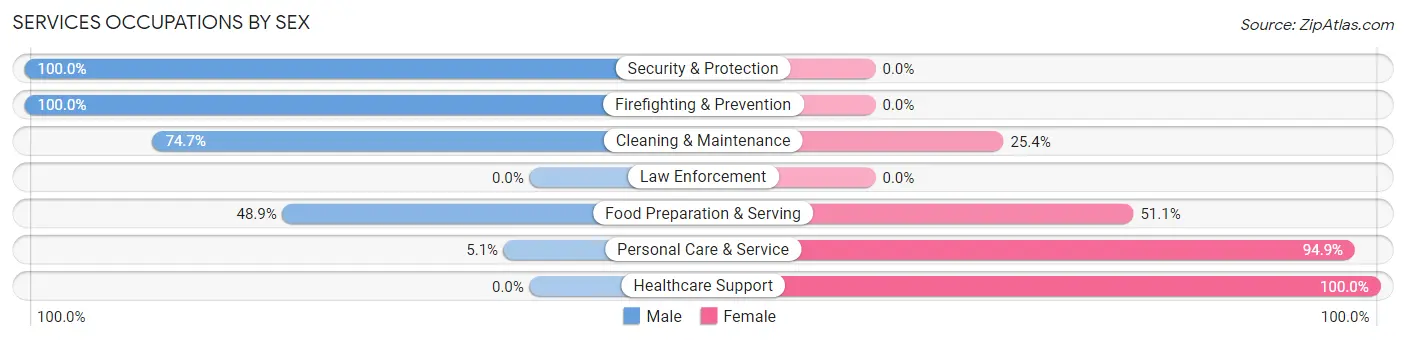
Services Occupations by Sex
Within the Services occupations in Powdersville, the most male-oriented occupations are Security & Protection (100.0%), Firefighting & Prevention (100.0%), and Cleaning & Maintenance (74.7%), while the most female-oriented occupations are Healthcare Support (100.0%), Personal Care & Service (94.9%), and Food Preparation & Serving (51.1%).
| Occupation | Male | Female |
| Healthcare Support | 0 (0.0%) | 95 (100.0%) |
| Security & Protection | 133 (100.0%) | 0 (0.0%) |
| Firefighting & Prevention | 133 (100.0%) | 0 (0.0%) |
| Law Enforcement | 0 (0.0%) | 0 (0.0%) |
| Food Preparation & Serving | 182 (48.9%) | 190 (51.1%) |
| Cleaning & Maintenance | 53 (74.7%) | 18 (25.4%) |
| Personal Care & Service | 3 (5.1%) | 56 (94.9%) |
| Total (Category) | 371 (50.8%) | 359 (49.2%) |
| Total (Overall) | 3,279 (58.8%) | 2,295 (41.2%) |
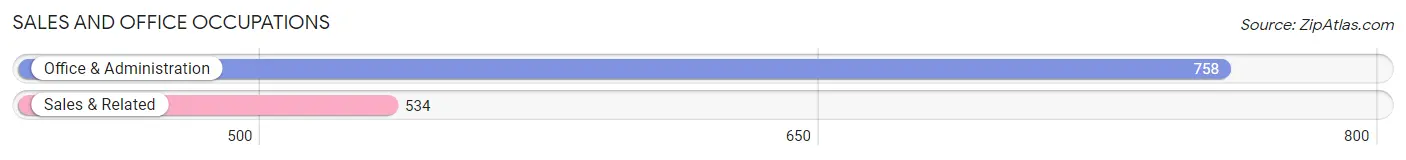
Sales and Office Occupations
The most common Sales and Office occupations in Powdersville are Office & Administration (758 | 13.6%), and Sales & Related (534 | 9.6%).
Sales and Office Occupations by Sex
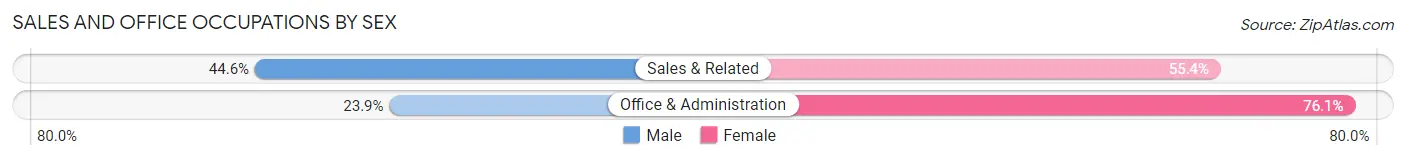
| Occupation | Male | Female |
| Sales & Related | 238 (44.6%) | 296 (55.4%) |
| Office & Administration | 181 (23.9%) | 577 (76.1%) |
| Total (Category) | 419 (32.4%) | 873 (67.6%) |
| Total (Overall) | 3,279 (58.8%) | 2,295 (41.2%) |
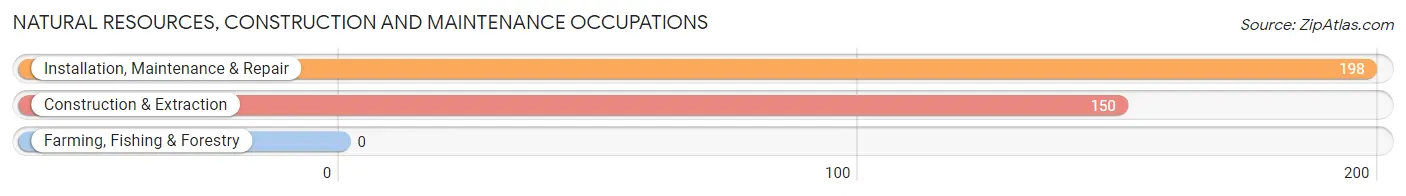
Natural Resources, Construction and Maintenance Occupations
The most common Natural Resources, Construction and Maintenance occupations in Powdersville are Installation, Maintenance & Repair (198 | 3.5%), and Construction & Extraction (150 | 2.7%).
Natural Resources, Construction and Maintenance Occupations by Sex
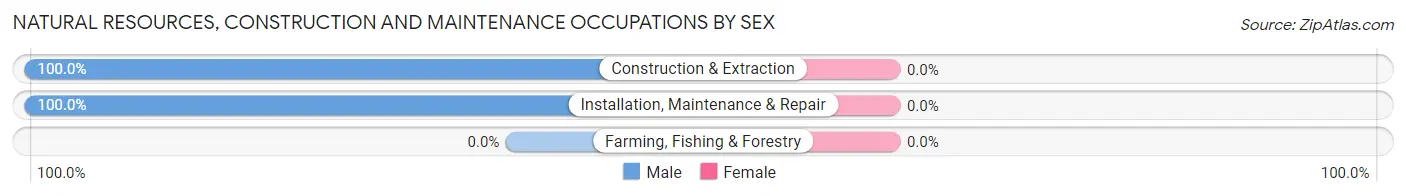
| Occupation | Male | Female |
| Farming, Fishing & Forestry | 0 (0.0%) | 0 (0.0%) |
| Construction & Extraction | 150 (100.0%) | 0 (0.0%) |
| Installation, Maintenance & Repair | 198 (100.0%) | 0 (0.0%) |
| Total (Category) | 348 (100.0%) | 0 (0.0%) |
| Total (Overall) | 3,279 (58.8%) | 2,295 (41.2%) |
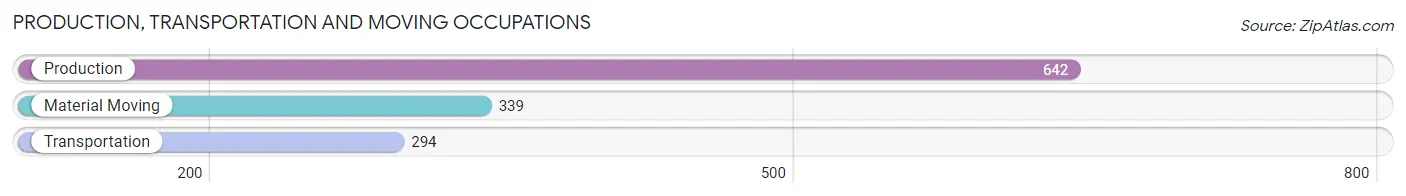
Production, Transportation and Moving Occupations
The most common Production, Transportation and Moving occupations in Powdersville are Production (642 | 11.5%), Material Moving (339 | 6.1%), and Transportation (294 | 5.3%).
Production, Transportation and Moving Occupations by Sex
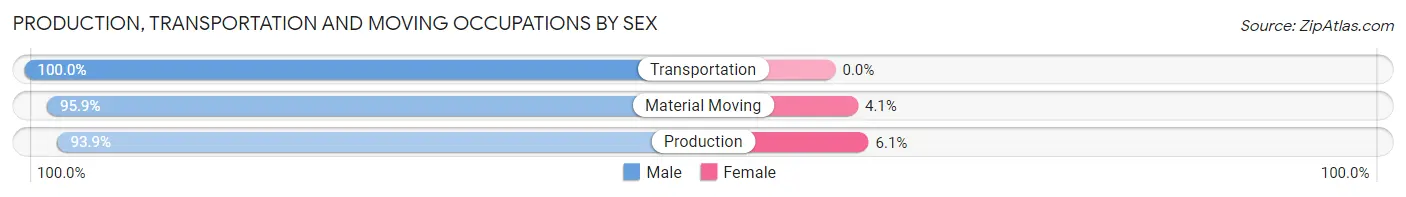
| Occupation | Male | Female |
| Production | 603 (93.9%) | 39 (6.1%) |
| Transportation | 294 (100.0%) | 0 (0.0%) |
| Material Moving | 325 (95.9%) | 14 (4.1%) |
| Total (Category) | 1,222 (95.8%) | 53 (4.2%) |
| Total (Overall) | 3,279 (58.8%) | 2,295 (41.2%) |
Employment Industries by Sex in Powdersville
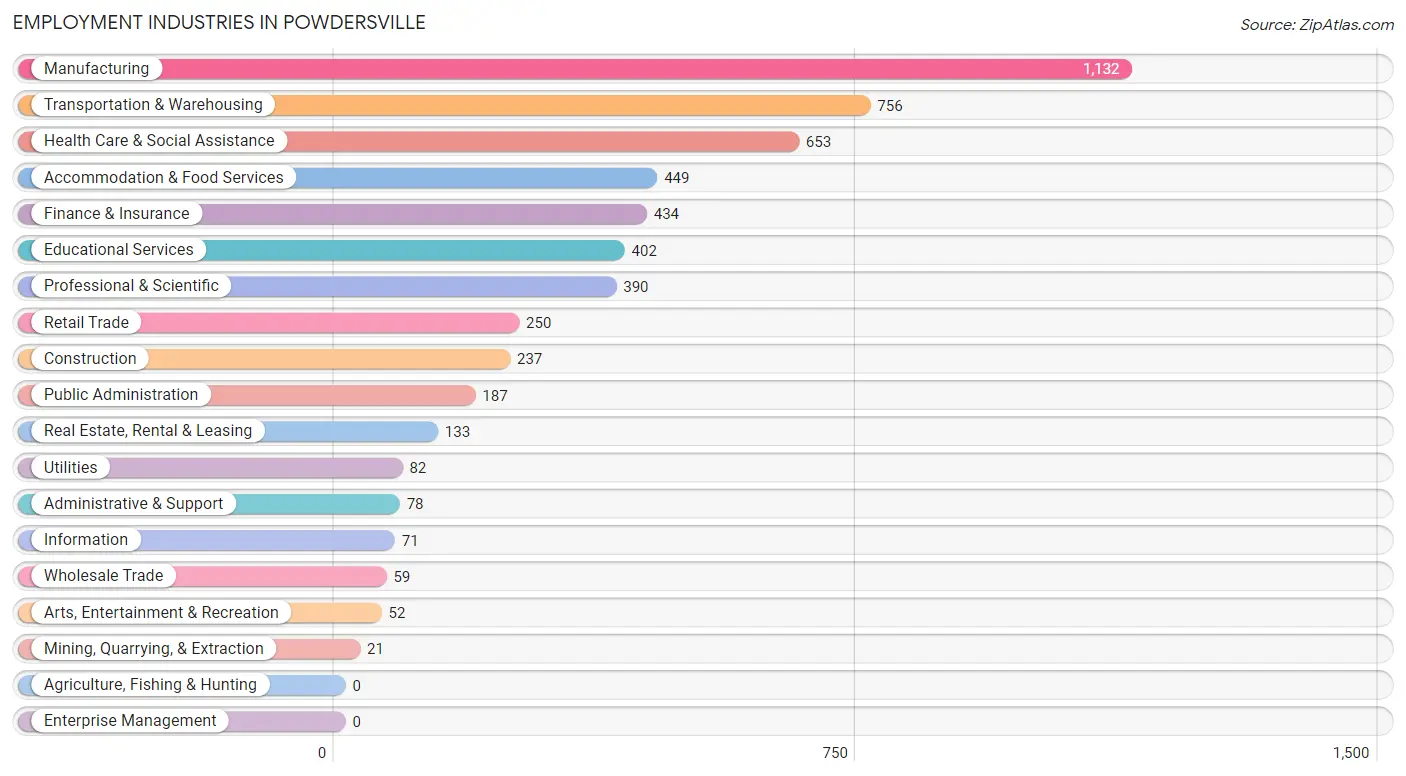
Employment Industries in Powdersville
The major employment industries in Powdersville include Manufacturing (1,132 | 20.3%), Transportation & Warehousing (756 | 13.6%), Health Care & Social Assistance (653 | 11.7%), Accommodation & Food Services (449 | 8.1%), and Finance & Insurance (434 | 7.8%).
Employment Industries by Sex in Powdersville
The Powdersville industries that see more men than women are Mining, Quarrying, & Extraction (100.0%), Wholesale Trade (100.0%), and Administrative & Support (100.0%), whereas the industries that tend to have a higher number of women are Finance & Insurance (94.9%), Health Care & Social Assistance (75.6%), and Retail Trade (72.0%).
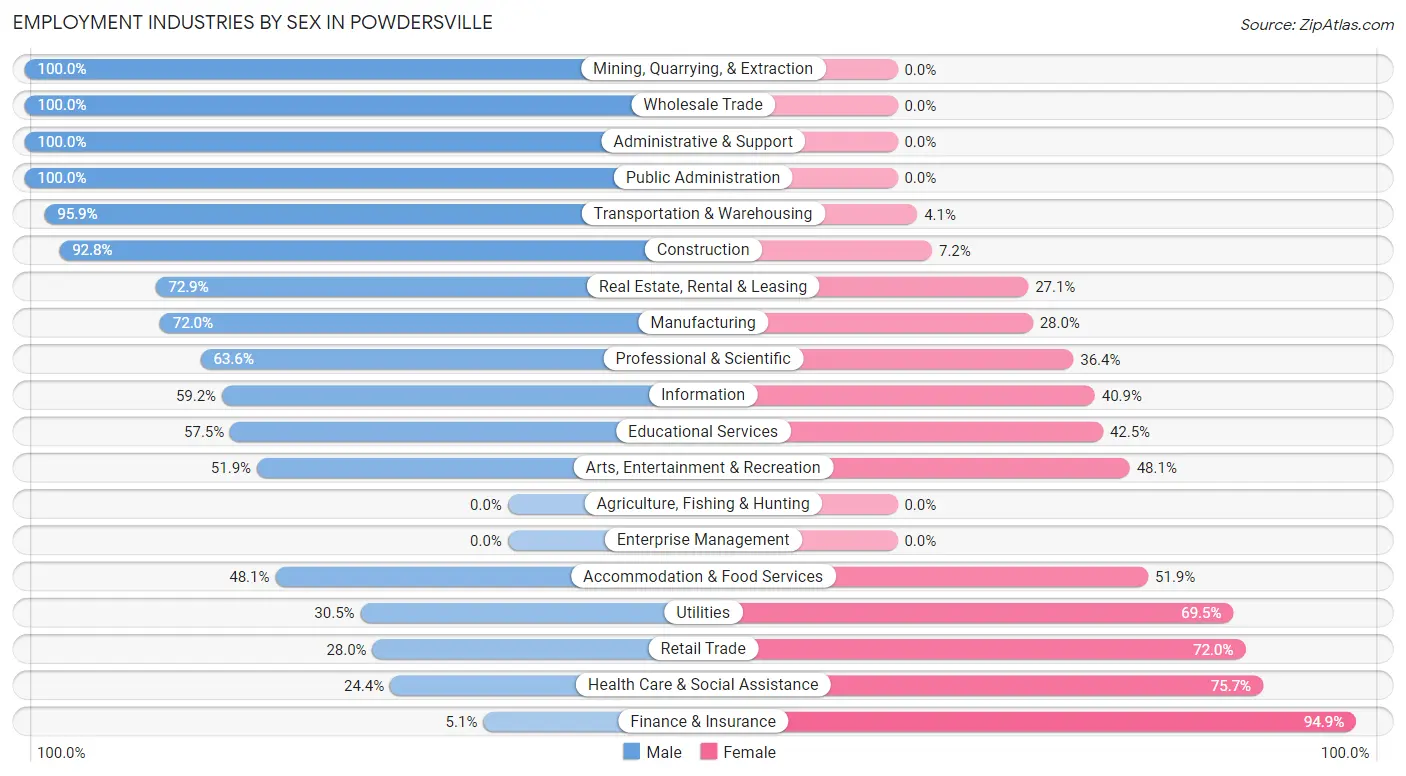
| Industry | Male | Female |
| Agriculture, Fishing & Hunting | 0 (0.0%) | 0 (0.0%) |
| Mining, Quarrying, & Extraction | 21 (100.0%) | 0 (0.0%) |
| Construction | 220 (92.8%) | 17 (7.2%) |
| Manufacturing | 815 (72.0%) | 317 (28.0%) |
| Wholesale Trade | 59 (100.0%) | 0 (0.0%) |
| Retail Trade | 70 (28.0%) | 180 (72.0%) |
| Transportation & Warehousing | 725 (95.9%) | 31 (4.1%) |
| Utilities | 25 (30.5%) | 57 (69.5%) |
| Information | 42 (59.2%) | 29 (40.8%) |
| Finance & Insurance | 22 (5.1%) | 412 (94.9%) |
| Real Estate, Rental & Leasing | 97 (72.9%) | 36 (27.1%) |
| Professional & Scientific | 248 (63.6%) | 142 (36.4%) |
| Enterprise Management | 0 (0.0%) | 0 (0.0%) |
| Administrative & Support | 78 (100.0%) | 0 (0.0%) |
| Educational Services | 231 (57.5%) | 171 (42.5%) |
| Health Care & Social Assistance | 159 (24.3%) | 494 (75.6%) |
| Arts, Entertainment & Recreation | 27 (51.9%) | 25 (48.1%) |
| Accommodation & Food Services | 216 (48.1%) | 233 (51.9%) |
| Public Administration | 187 (100.0%) | 0 (0.0%) |
| Total | 3,279 (58.8%) | 2,295 (41.2%) |
Education in Powdersville
School Enrollment in Powdersville
The most common levels of schooling among the 2,261 students in Powdersville are middle school (538 | 23.8%), elementary school (503 | 22.3%), and high school (502 | 22.2%).
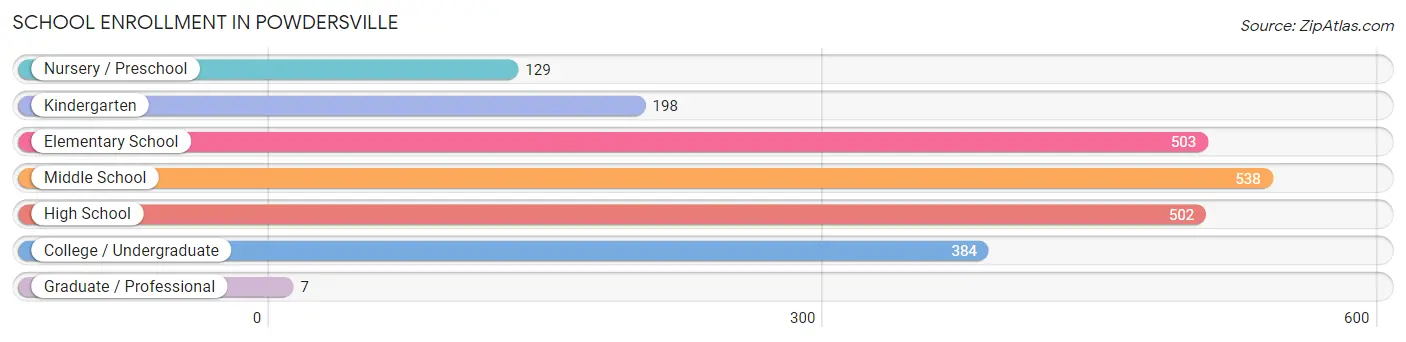
| School Level | # Students | % Students |
| Nursery / Preschool | 129 | 5.7% |
| Kindergarten | 198 | 8.8% |
| Elementary School | 503 | 22.3% |
| Middle School | 538 | 23.8% |
| High School | 502 | 22.2% |
| College / Undergraduate | 384 | 17.0% |
| Graduate / Professional | 7 | 0.3% |
| Total | 2,261 | 100.0% |
School Enrollment by Age by Funding Source in Powdersville
Out of a total of 2,261 students who are enrolled in schools in Powdersville, 337 (14.9%) attend a private institution, while the remaining 1,924 (85.1%) are enrolled in public schools. The age group of 3 to 4 year olds has the highest likelihood of being enrolled in private schools, with 83 (34.3% in the age bracket) enrolled. Conversely, the age group of 25 to 34 year olds has the lowest likelihood of being enrolled in a private school, with 117 (100.0% in the age bracket) attending a public institution.
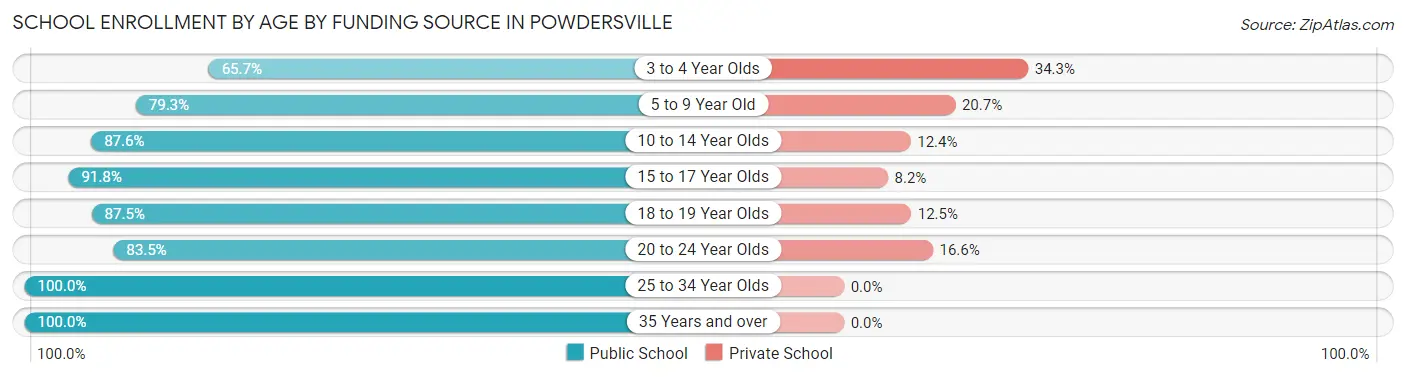
| Age Bracket | Public School | Private School |
| 3 to 4 Year Olds | 159 (65.7%) | 83 (34.3%) |
| 5 to 9 Year Old | 371 (79.3%) | 97 (20.7%) |
| 10 to 14 Year Olds | 727 (87.6%) | 103 (12.4%) |
| 15 to 17 Year Olds | 303 (91.8%) | 27 (8.2%) |
| 18 to 19 Year Olds | 21 (87.5%) | 3 (12.5%) |
| 20 to 24 Year Olds | 121 (83.5%) | 24 (16.6%) |
| 25 to 34 Year Olds | 117 (100.0%) | 0 (0.0%) |
| 35 Years and over | 105 (100.0%) | 0 (0.0%) |
| Total | 1,924 (85.1%) | 337 (14.9%) |
Educational Attainment by Field of Study in Powdersville
Business (491 | 20.1%), science & technology (353 | 14.4%), education (339 | 13.9%), psychology (260 | 10.6%), and engineering (188 | 7.7%) are the most common fields of study among 2,444 individuals in Powdersville who have obtained a bachelor's degree or higher.
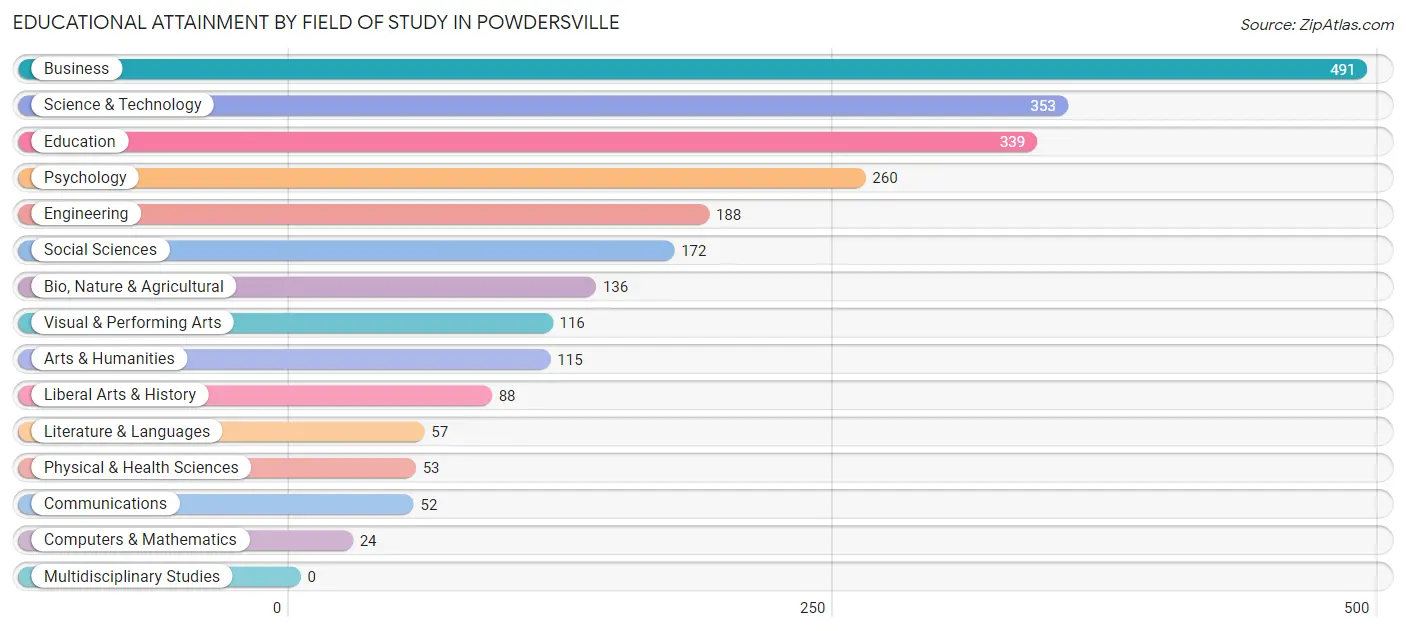
| Field of Study | # Graduates | % Graduates |
| Computers & Mathematics | 24 | 1.0% |
| Bio, Nature & Agricultural | 136 | 5.6% |
| Physical & Health Sciences | 53 | 2.2% |
| Psychology | 260 | 10.6% |
| Social Sciences | 172 | 7.0% |
| Engineering | 188 | 7.7% |
| Multidisciplinary Studies | 0 | 0.0% |
| Science & Technology | 353 | 14.4% |
| Business | 491 | 20.1% |
| Education | 339 | 13.9% |
| Literature & Languages | 57 | 2.3% |
| Liberal Arts & History | 88 | 3.6% |
| Visual & Performing Arts | 116 | 4.8% |
| Communications | 52 | 2.1% |
| Arts & Humanities | 115 | 4.7% |
| Total | 2,444 | 100.0% |
Transportation & Commute in Powdersville
Vehicle Availability by Sex in Powdersville
The most prevalent vehicle ownership categories in Powdersville are males with 2 vehicles (1,458, accounting for 44.9%) and females with 2 vehicles (824, making up 63.5%).
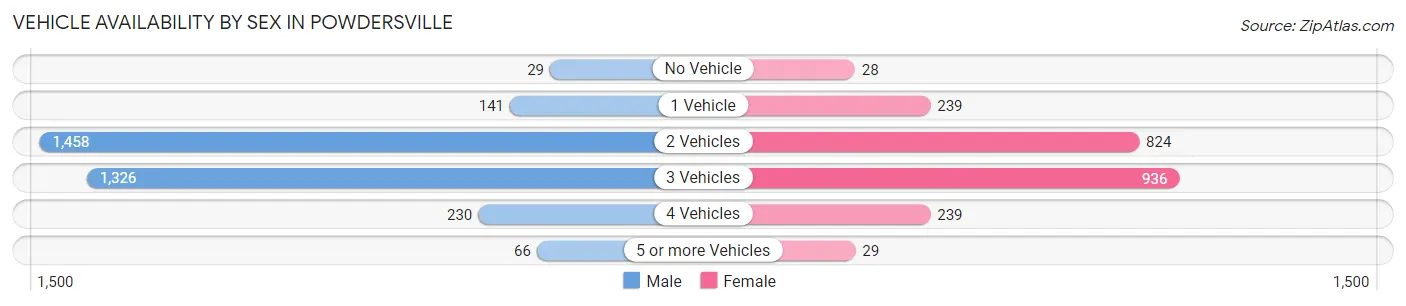
| Vehicles Available | Male | Female |
| No Vehicle | 29 (0.9%) | 28 (1.2%) |
| 1 Vehicle | 141 (4.3%) | 239 (10.4%) |
| 2 Vehicles | 1,458 (44.9%) | 824 (35.9%) |
| 3 Vehicles | 1,326 (40.8%) | 936 (40.8%) |
| 4 Vehicles | 230 (7.1%) | 239 (10.4%) |
| 5 or more Vehicles | 66 (2.0%) | 29 (1.3%) |
| Total | 3,250 (100.0%) | 2,295 (100.0%) |
Commute Time in Powdersville
The most frequently occuring commute durations in Powdersville are 20 to 24 minutes (1,155 commuters, 23.5%), 15 to 19 minutes (777 commuters, 15.8%), and 90 or more minutes (622 commuters, 12.7%).
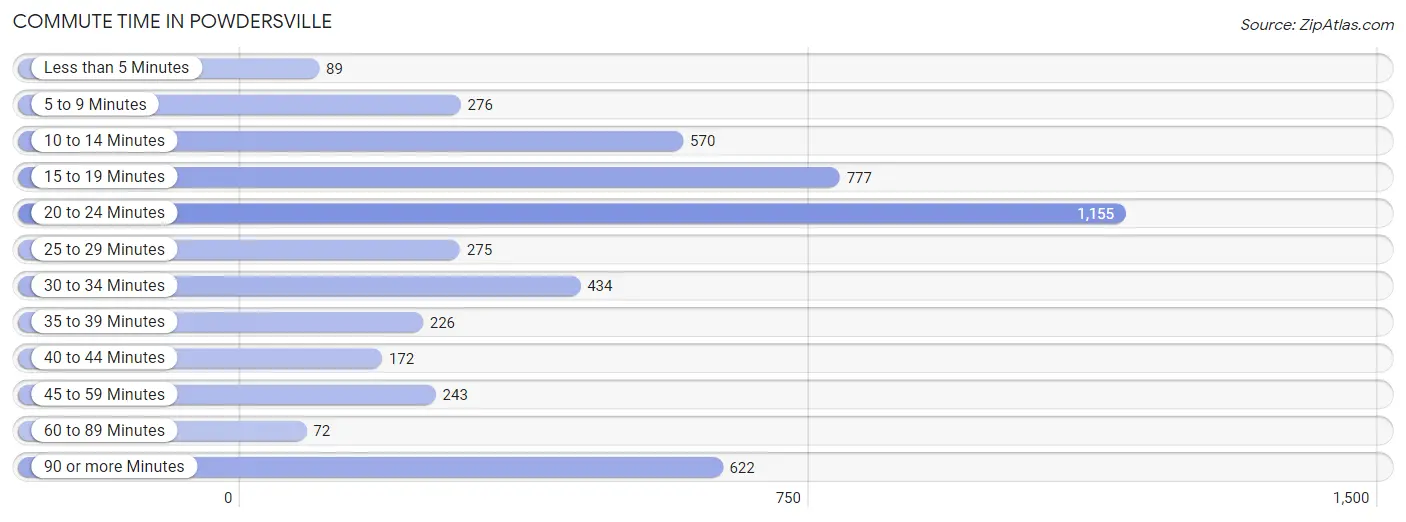
| Commute Time | # Commuters | % Commuters |
| Less than 5 Minutes | 89 | 1.8% |
| 5 to 9 Minutes | 276 | 5.6% |
| 10 to 14 Minutes | 570 | 11.6% |
| 15 to 19 Minutes | 777 | 15.8% |
| 20 to 24 Minutes | 1,155 | 23.5% |
| 25 to 29 Minutes | 275 | 5.6% |
| 30 to 34 Minutes | 434 | 8.8% |
| 35 to 39 Minutes | 226 | 4.6% |
| 40 to 44 Minutes | 172 | 3.5% |
| 45 to 59 Minutes | 243 | 5.0% |
| 60 to 89 Minutes | 72 | 1.5% |
| 90 or more Minutes | 622 | 12.7% |
Commute Time by Sex in Powdersville
The most common commute times in Powdersville are 20 to 24 minutes (683 commuters, 23.1%) for males and 20 to 24 minutes (472 commuters, 24.2%) for females.
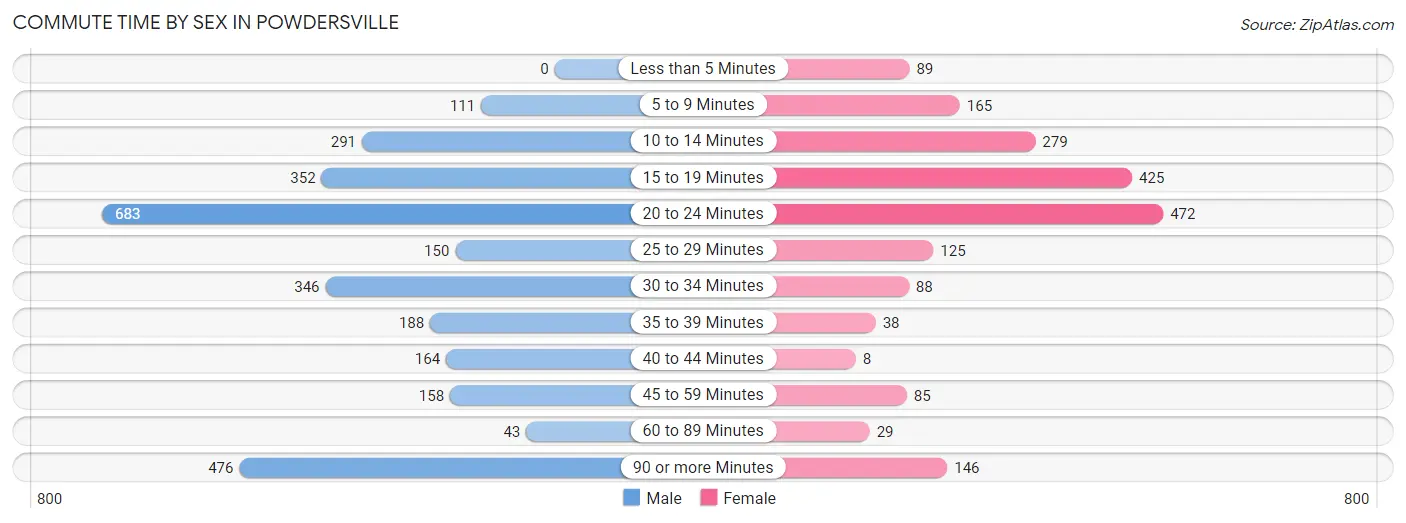
| Commute Time | Male | Female |
| Less than 5 Minutes | 0 (0.0%) | 89 (4.6%) |
| 5 to 9 Minutes | 111 (3.7%) | 165 (8.5%) |
| 10 to 14 Minutes | 291 (9.8%) | 279 (14.3%) |
| 15 to 19 Minutes | 352 (11.9%) | 425 (21.8%) |
| 20 to 24 Minutes | 683 (23.1%) | 472 (24.2%) |
| 25 to 29 Minutes | 150 (5.1%) | 125 (6.4%) |
| 30 to 34 Minutes | 346 (11.7%) | 88 (4.5%) |
| 35 to 39 Minutes | 188 (6.4%) | 38 (1.9%) |
| 40 to 44 Minutes | 164 (5.5%) | 8 (0.4%) |
| 45 to 59 Minutes | 158 (5.3%) | 85 (4.4%) |
| 60 to 89 Minutes | 43 (1.5%) | 29 (1.5%) |
| 90 or more Minutes | 476 (16.1%) | 146 (7.5%) |
Time of Departure to Work by Sex in Powdersville
The most frequent times of departure to work in Powdersville are 6:00 AM to 6:29 AM (596, 20.1%) for males and 8:00 AM to 8:29 AM (475, 24.4%) for females.
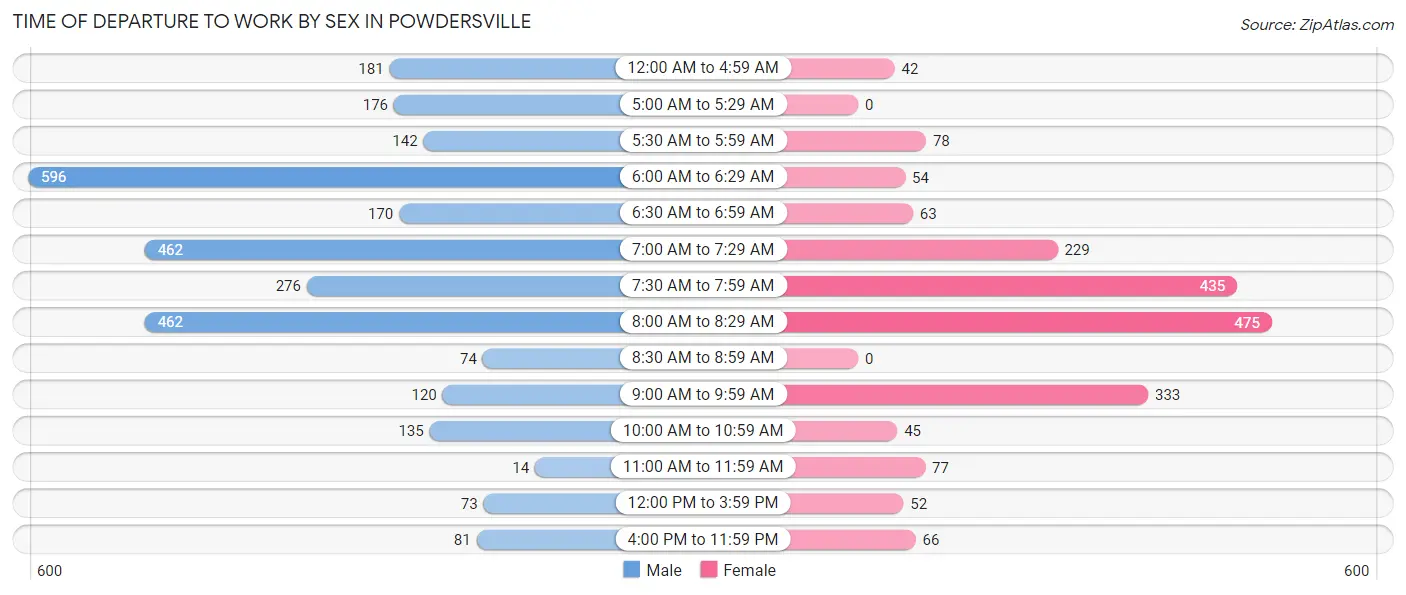
| Time of Departure | Male | Female |
| 12:00 AM to 4:59 AM | 181 (6.1%) | 42 (2.1%) |
| 5:00 AM to 5:29 AM | 176 (5.9%) | 0 (0.0%) |
| 5:30 AM to 5:59 AM | 142 (4.8%) | 78 (4.0%) |
| 6:00 AM to 6:29 AM | 596 (20.1%) | 54 (2.8%) |
| 6:30 AM to 6:59 AM | 170 (5.7%) | 63 (3.2%) |
| 7:00 AM to 7:29 AM | 462 (15.6%) | 229 (11.7%) |
| 7:30 AM to 7:59 AM | 276 (9.3%) | 435 (22.3%) |
| 8:00 AM to 8:29 AM | 462 (15.6%) | 475 (24.4%) |
| 8:30 AM to 8:59 AM | 74 (2.5%) | 0 (0.0%) |
| 9:00 AM to 9:59 AM | 120 (4.1%) | 333 (17.1%) |
| 10:00 AM to 10:59 AM | 135 (4.6%) | 45 (2.3%) |
| 11:00 AM to 11:59 AM | 14 (0.5%) | 77 (4.0%) |
| 12:00 PM to 3:59 PM | 73 (2.5%) | 52 (2.7%) |
| 4:00 PM to 11:59 PM | 81 (2.7%) | 66 (3.4%) |
| Total | 2,962 (100.0%) | 1,949 (100.0%) |
Housing Occupancy in Powdersville
Occupancy by Ownership in Powdersville
Of the total 3,794 dwellings in Powdersville, owner-occupied units account for 2,952 (77.8%), while renter-occupied units make up 842 (22.2%).
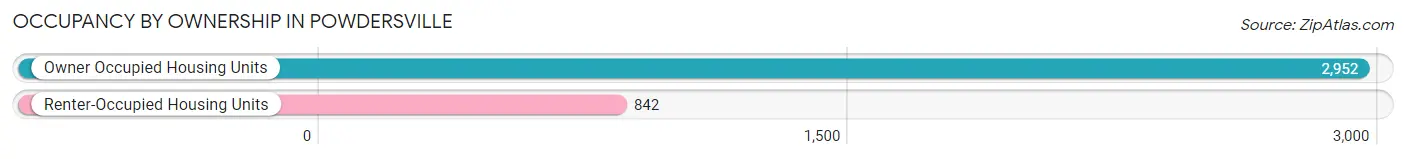
| Occupancy | # Housing Units | % Housing Units |
| Owner Occupied Housing Units | 2,952 | 77.8% |
| Renter-Occupied Housing Units | 842 | 22.2% |
| Total Occupied Housing Units | 3,794 | 100.0% |
Occupancy by Household Size in Powdersville
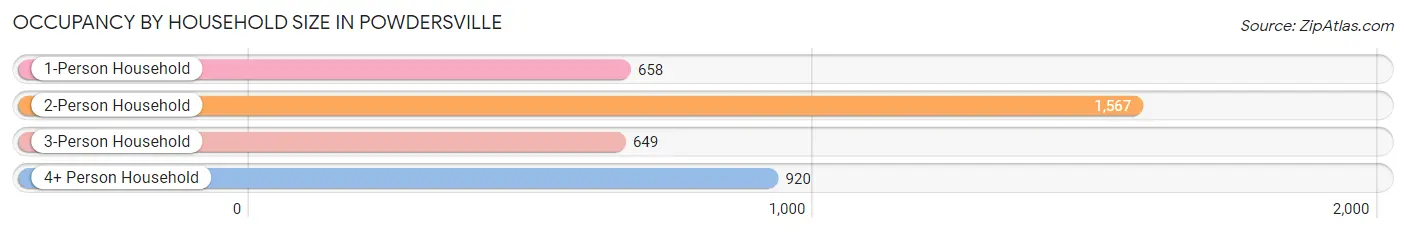
| Household Size | # Housing Units | % Housing Units |
| 1-Person Household | 658 | 17.3% |
| 2-Person Household | 1,567 | 41.3% |
| 3-Person Household | 649 | 17.1% |
| 4+ Person Household | 920 | 24.2% |
| Total Housing Units | 3,794 | 100.0% |
Occupancy by Ownership by Household Size in Powdersville
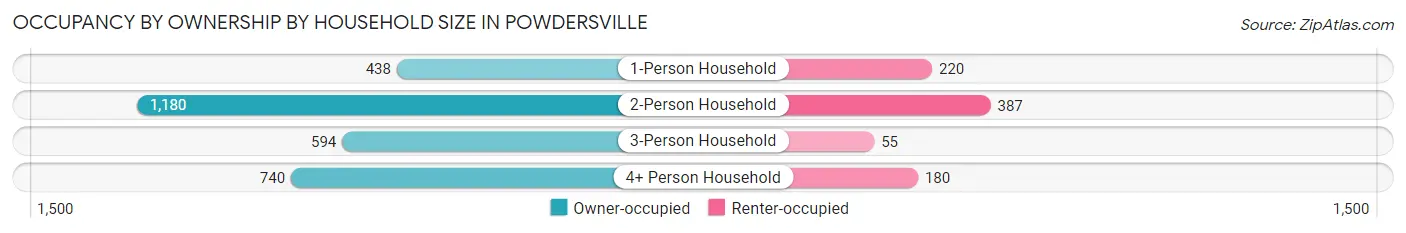
| Household Size | Owner-occupied | Renter-occupied |
| 1-Person Household | 438 (66.6%) | 220 (33.4%) |
| 2-Person Household | 1,180 (75.3%) | 387 (24.7%) |
| 3-Person Household | 594 (91.5%) | 55 (8.5%) |
| 4+ Person Household | 740 (80.4%) | 180 (19.6%) |
| Total Housing Units | 2,952 (77.8%) | 842 (22.2%) |
Occupancy by Educational Attainment in Powdersville
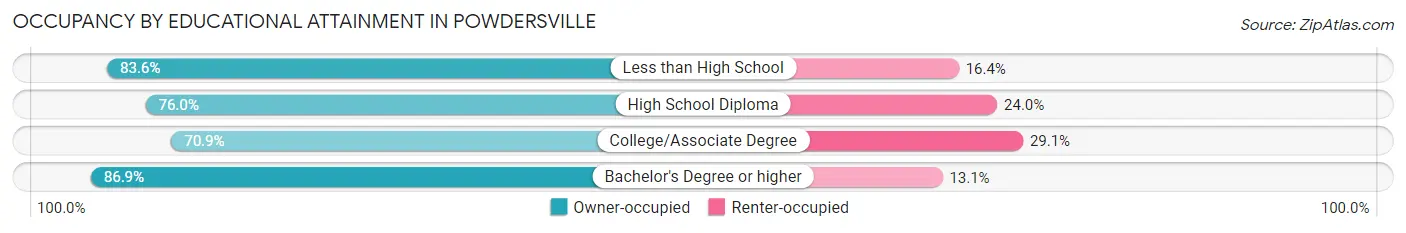
| Household Size | Owner-occupied | Renter-occupied |
| Less than High School | 92 (83.6%) | 18 (16.4%) |
| High School Diploma | 780 (76.0%) | 246 (24.0%) |
| College/Associate Degree | 1,016 (70.9%) | 417 (29.1%) |
| Bachelor's Degree or higher | 1,064 (86.9%) | 161 (13.1%) |
Occupancy by Age of Householder in Powdersville
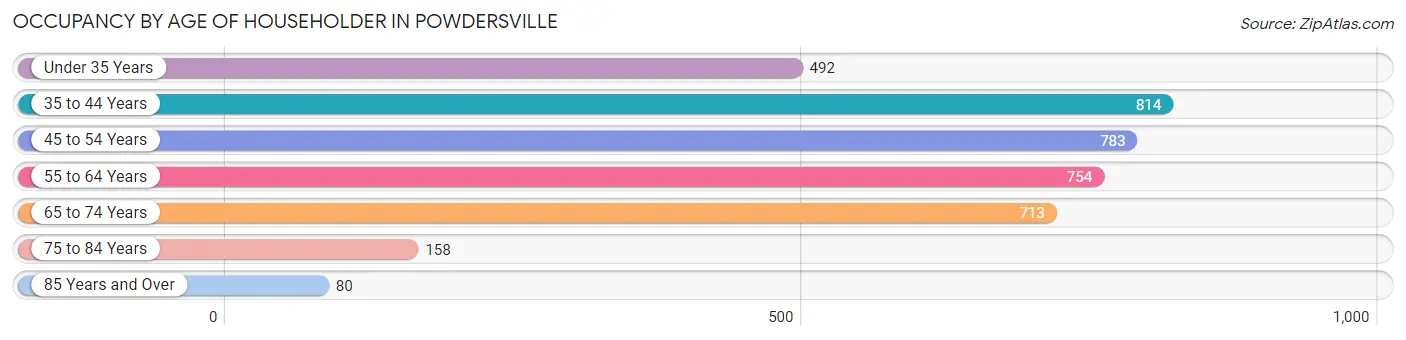
| Age Bracket | # Households | % Households |
| Under 35 Years | 492 | 13.0% |
| 35 to 44 Years | 814 | 21.4% |
| 45 to 54 Years | 783 | 20.6% |
| 55 to 64 Years | 754 | 19.9% |
| 65 to 74 Years | 713 | 18.8% |
| 75 to 84 Years | 158 | 4.2% |
| 85 Years and Over | 80 | 2.1% |
| Total | 3,794 | 100.0% |
Housing Finances in Powdersville
Median Income by Occupancy in Powdersville
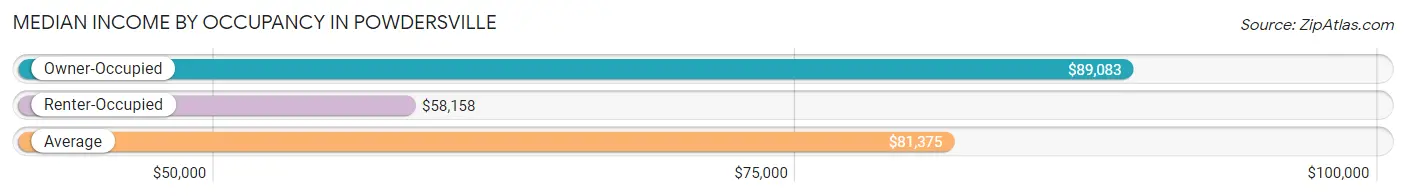
| Occupancy Type | # Households | Median Income |
| Owner-Occupied | 2,952 (77.8%) | $89,083 |
| Renter-Occupied | 842 (22.2%) | $58,158 |
| Average | 3,794 (100.0%) | $81,375 |
Occupancy by Householder Income Bracket in Powdersville
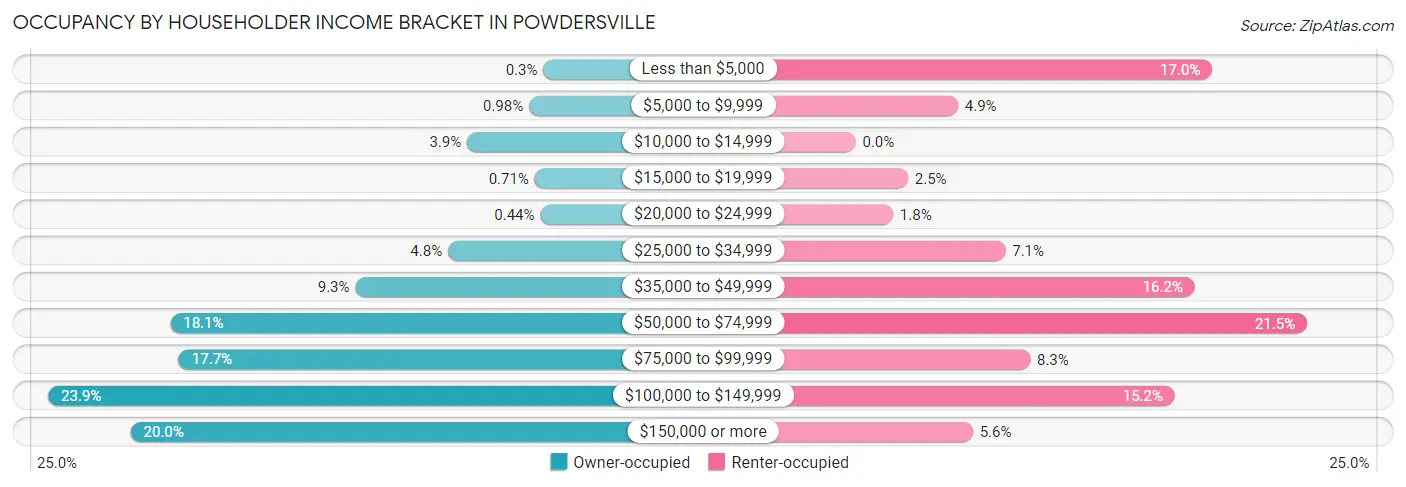
| Income Bracket | Owner-occupied | Renter-occupied |
| Less than $5,000 | 9 (0.3%) | 143 (17.0%) |
| $5,000 to $9,999 | 29 (1.0%) | 41 (4.9%) |
| $10,000 to $14,999 | 116 (3.9%) | 0 (0.0%) |
| $15,000 to $19,999 | 21 (0.7%) | 21 (2.5%) |
| $20,000 to $24,999 | 13 (0.4%) | 15 (1.8%) |
| $25,000 to $34,999 | 143 (4.8%) | 60 (7.1%) |
| $35,000 to $49,999 | 273 (9.2%) | 136 (16.2%) |
| $50,000 to $74,999 | 533 (18.1%) | 181 (21.5%) |
| $75,000 to $99,999 | 521 (17.6%) | 70 (8.3%) |
| $100,000 to $149,999 | 705 (23.9%) | 128 (15.2%) |
| $150,000 or more | 589 (20.0%) | 47 (5.6%) |
| Total | 2,952 (100.0%) | 842 (100.0%) |
Monthly Housing Cost Tiers in Powdersville
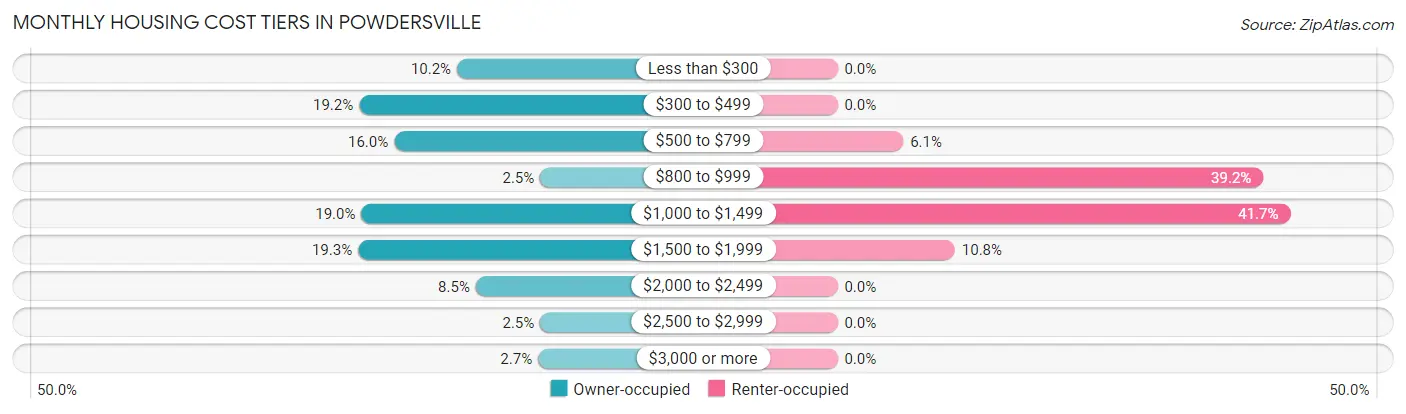
| Monthly Cost | Owner-occupied | Renter-occupied |
| Less than $300 | 301 (10.2%) | 0 (0.0%) |
| $300 to $499 | 567 (19.2%) | 0 (0.0%) |
| $500 to $799 | 472 (16.0%) | 51 (6.1%) |
| $800 to $999 | 75 (2.5%) | 330 (39.2%) |
| $1,000 to $1,499 | 561 (19.0%) | 351 (41.7%) |
| $1,500 to $1,999 | 570 (19.3%) | 91 (10.8%) |
| $2,000 to $2,499 | 250 (8.5%) | 0 (0.0%) |
| $2,500 to $2,999 | 75 (2.5%) | 0 (0.0%) |
| $3,000 or more | 81 (2.7%) | 0 (0.0%) |
| Total | 2,952 (100.0%) | 842 (100.0%) |
Physical Housing Characteristics in Powdersville
Housing Structures in Powdersville
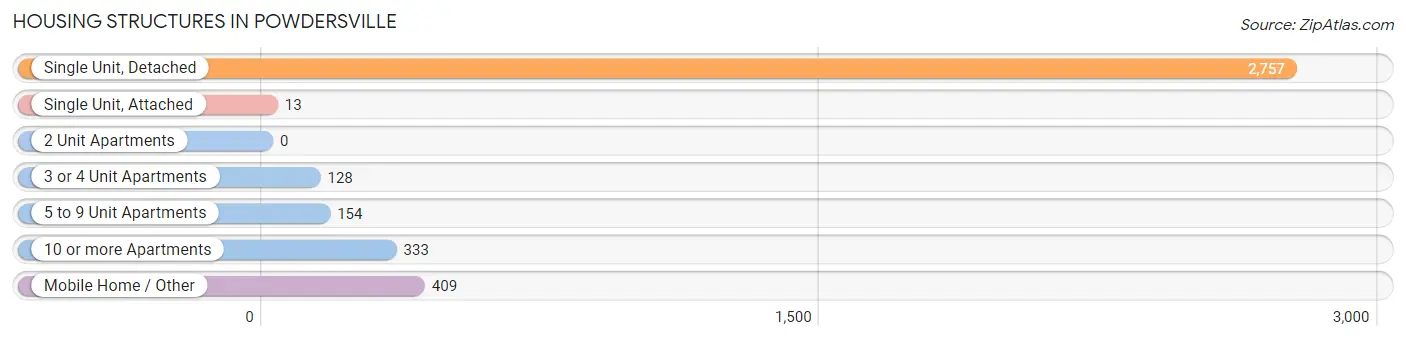
| Structure Type | # Housing Units | % Housing Units |
| Single Unit, Detached | 2,757 | 72.7% |
| Single Unit, Attached | 13 | 0.3% |
| 2 Unit Apartments | 0 | 0.0% |
| 3 or 4 Unit Apartments | 128 | 3.4% |
| 5 to 9 Unit Apartments | 154 | 4.1% |
| 10 or more Apartments | 333 | 8.8% |
| Mobile Home / Other | 409 | 10.8% |
| Total | 3,794 | 100.0% |
Housing Structures by Occupancy in Powdersville
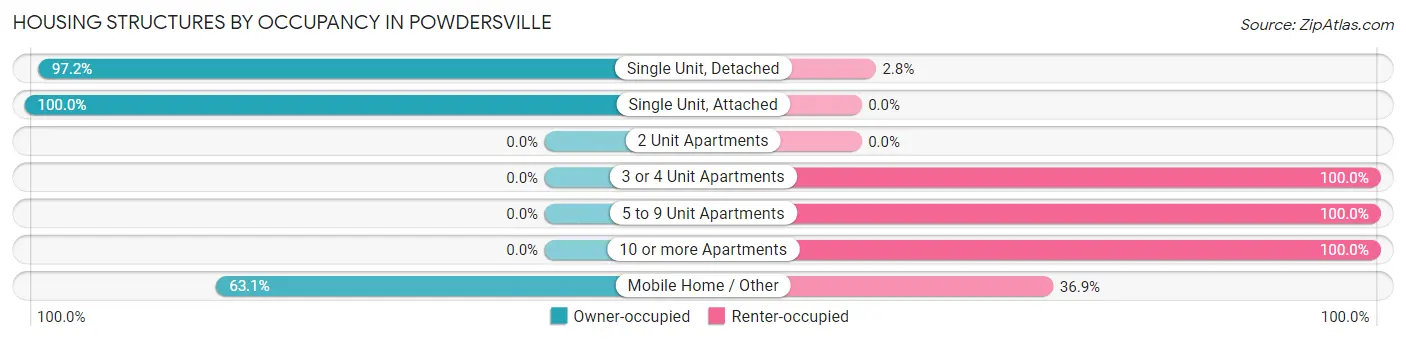
| Structure Type | Owner-occupied | Renter-occupied |
| Single Unit, Detached | 2,681 (97.2%) | 76 (2.8%) |
| Single Unit, Attached | 13 (100.0%) | 0 (0.0%) |
| 2 Unit Apartments | 0 (0.0%) | 0 (0.0%) |
| 3 or 4 Unit Apartments | 0 (0.0%) | 128 (100.0%) |
| 5 to 9 Unit Apartments | 0 (0.0%) | 154 (100.0%) |
| 10 or more Apartments | 0 (0.0%) | 333 (100.0%) |
| Mobile Home / Other | 258 (63.1%) | 151 (36.9%) |
| Total | 2,952 (77.8%) | 842 (22.2%) |
Housing Structures by Number of Rooms in Powdersville
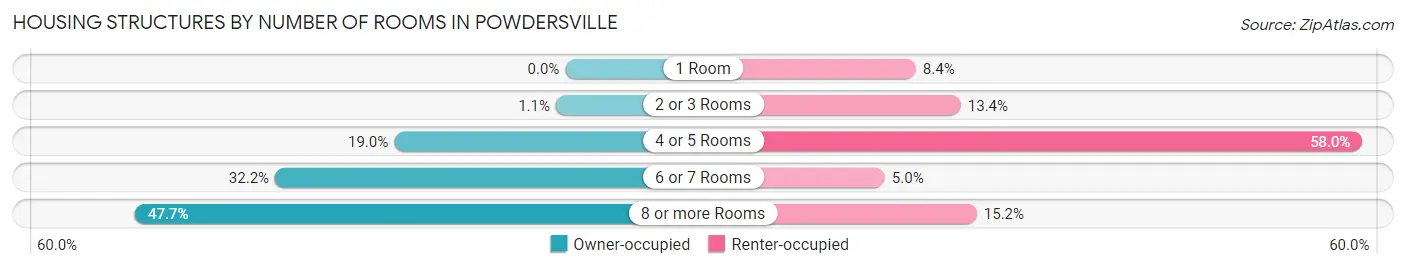
| Number of Rooms | Owner-occupied | Renter-occupied |
| 1 Room | 0 (0.0%) | 71 (8.4%) |
| 2 or 3 Rooms | 31 (1.1%) | 113 (13.4%) |
| 4 or 5 Rooms | 561 (19.0%) | 488 (58.0%) |
| 6 or 7 Rooms | 951 (32.2%) | 42 (5.0%) |
| 8 or more Rooms | 1,409 (47.7%) | 128 (15.2%) |
| Total | 2,952 (100.0%) | 842 (100.0%) |
Housing Structure by Heating Type in Powdersville
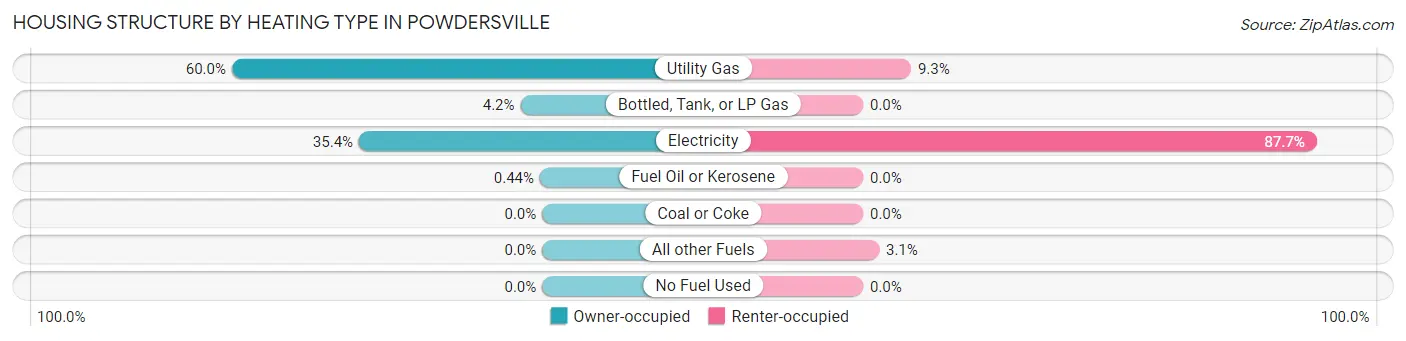
| Heating Type | Owner-occupied | Renter-occupied |
| Utility Gas | 1,770 (60.0%) | 78 (9.3%) |
| Bottled, Tank, or LP Gas | 124 (4.2%) | 0 (0.0%) |
| Electricity | 1,045 (35.4%) | 738 (87.6%) |
| Fuel Oil or Kerosene | 13 (0.4%) | 0 (0.0%) |
| Coal or Coke | 0 (0.0%) | 0 (0.0%) |
| All other Fuels | 0 (0.0%) | 26 (3.1%) |
| No Fuel Used | 0 (0.0%) | 0 (0.0%) |
| Total | 2,952 (100.0%) | 842 (100.0%) |
Household Vehicle Usage in Powdersville
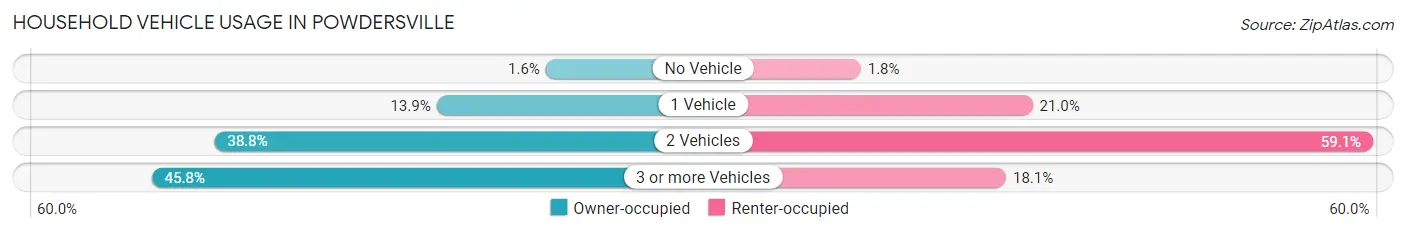
| Vehicles per Household | Owner-occupied | Renter-occupied |
| No Vehicle | 48 (1.6%) | 15 (1.8%) |
| 1 Vehicle | 409 (13.9%) | 177 (21.0%) |
| 2 Vehicles | 1,144 (38.8%) | 498 (59.1%) |
| 3 or more Vehicles | 1,351 (45.8%) | 152 (18.0%) |
| Total | 2,952 (100.0%) | 842 (100.0%) |
Real Estate & Mortgages in Powdersville
Real Estate and Mortgage Overview in Powdersville
| Characteristic | Without Mortgage | With Mortgage |
| Housing Units | 1,028 | 1,924 |
| Median Property Value | $238,000 | $303,200 |
| Median Household Income | $62,045 | $499 |
| Monthly Housing Costs | $417 | $81 |
| Real Estate Taxes | $827 | $27 |
Property Value by Mortgage Status in Powdersville
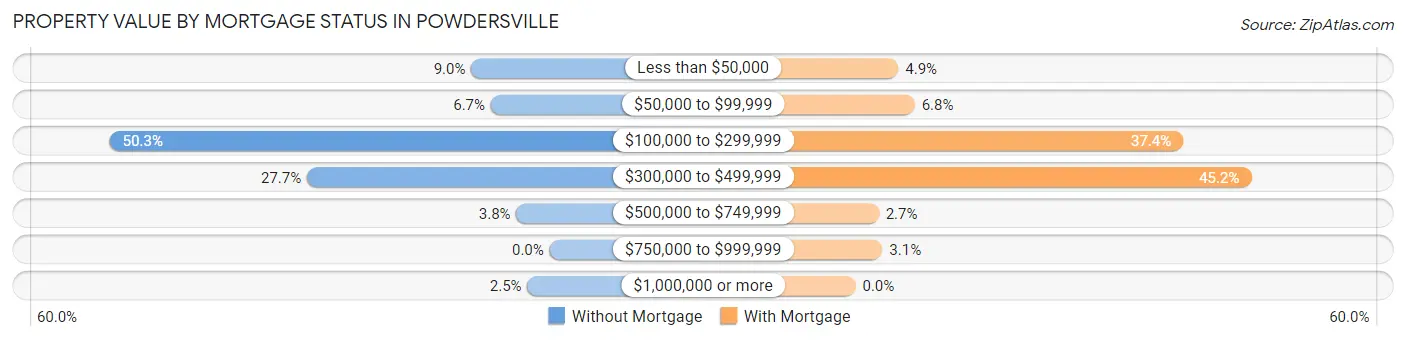
| Property Value | Without Mortgage | With Mortgage |
| Less than $50,000 | 92 (8.9%) | 94 (4.9%) |
| $50,000 to $99,999 | 69 (6.7%) | 130 (6.8%) |
| $100,000 to $299,999 | 517 (50.3%) | 720 (37.4%) |
| $300,000 to $499,999 | 285 (27.7%) | 870 (45.2%) |
| $500,000 to $749,999 | 39 (3.8%) | 51 (2.6%) |
| $750,000 to $999,999 | 0 (0.0%) | 59 (3.1%) |
| $1,000,000 or more | 26 (2.5%) | 0 (0.0%) |
| Total | 1,028 (100.0%) | 1,924 (100.0%) |
Household Income by Mortgage Status in Powdersville
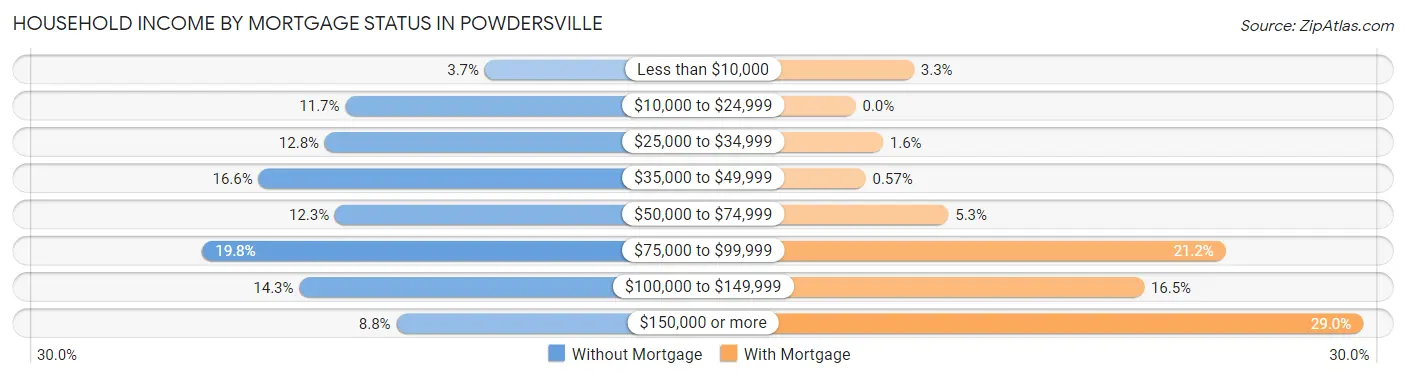
| Household Income | Without Mortgage | With Mortgage |
| Less than $10,000 | 38 (3.7%) | 64 (3.3%) |
| $10,000 to $24,999 | 120 (11.7%) | 0 (0.0%) |
| $25,000 to $34,999 | 132 (12.8%) | 30 (1.6%) |
| $35,000 to $49,999 | 171 (16.6%) | 11 (0.6%) |
| $50,000 to $74,999 | 126 (12.3%) | 102 (5.3%) |
| $75,000 to $99,999 | 204 (19.8%) | 407 (21.1%) |
| $100,000 to $149,999 | 147 (14.3%) | 317 (16.5%) |
| $150,000 or more | 90 (8.7%) | 558 (29.0%) |
| Total | 1,028 (100.0%) | 1,924 (100.0%) |
Property Value to Household Income Ratio in Powdersville
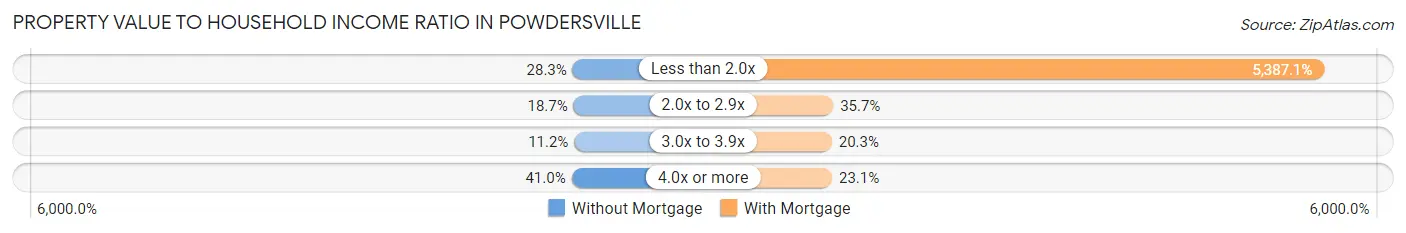
| Value-to-Income Ratio | Without Mortgage | With Mortgage |
| Less than 2.0x | 291 (28.3%) | 103,647 (5,387.1%) |
| 2.0x to 2.9x | 192 (18.7%) | 686 (35.6%) |
| 3.0x to 3.9x | 115 (11.2%) | 391 (20.3%) |
| 4.0x or more | 421 (40.9%) | 444 (23.1%) |
| Total | 1,028 (100.0%) | 1,924 (100.0%) |
Real Estate Taxes by Mortgage Status in Powdersville
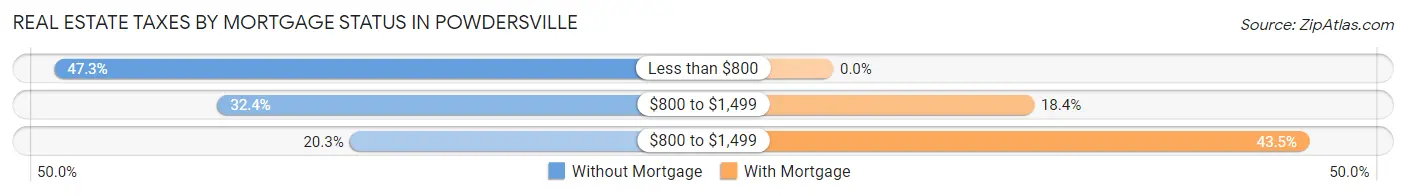
| Property Taxes | Without Mortgage | With Mortgage |
| Less than $800 | 486 (47.3%) | 0 (0.0%) |
| $800 to $1,499 | 333 (32.4%) | 353 (18.3%) |
| $800 to $1,499 | 209 (20.3%) | 836 (43.4%) |
| Total | 1,028 (100.0%) | 1,924 (100.0%) |
Health & Disability in Powdersville
Health Insurance Coverage by Age in Powdersville
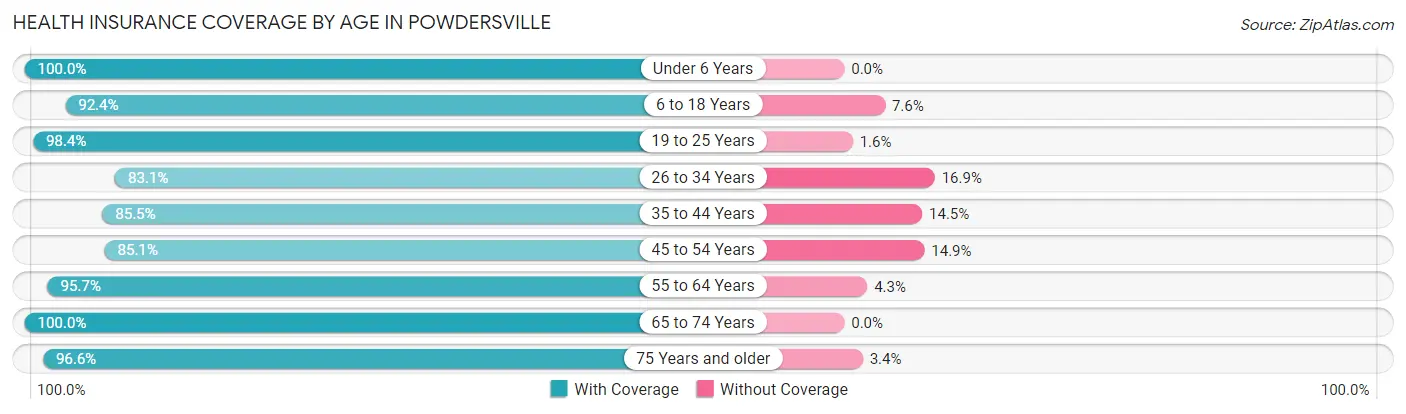
| Age Bracket | With Coverage | Without Coverage |
| Under 6 Years | 657 (100.0%) | 0 (0.0%) |
| 6 to 18 Years | 1,474 (92.4%) | 121 (7.6%) |
| 19 to 25 Years | 1,191 (98.4%) | 19 (1.6%) |
| 26 to 34 Years | 907 (83.1%) | 184 (16.9%) |
| 35 to 44 Years | 1,449 (85.5%) | 246 (14.5%) |
| 45 to 54 Years | 1,214 (85.1%) | 213 (14.9%) |
| 55 to 64 Years | 1,207 (95.7%) | 54 (4.3%) |
| 65 to 74 Years | 1,275 (100.0%) | 0 (0.0%) |
| 75 Years and older | 451 (96.6%) | 16 (3.4%) |
| Total | 9,825 (92.0%) | 853 (8.0%) |
Health Insurance Coverage by Citizenship Status in Powdersville
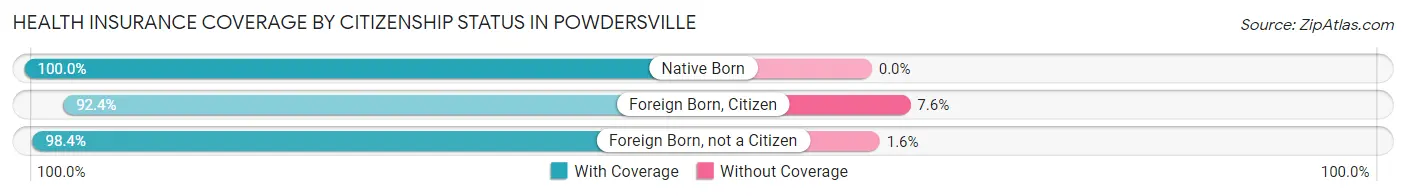
| Citizenship Status | With Coverage | Without Coverage |
| Native Born | 657 (100.0%) | 0 (0.0%) |
| Foreign Born, Citizen | 1,474 (92.4%) | 121 (7.6%) |
| Foreign Born, not a Citizen | 1,191 (98.4%) | 19 (1.6%) |
Health Insurance Coverage by Household Income in Powdersville
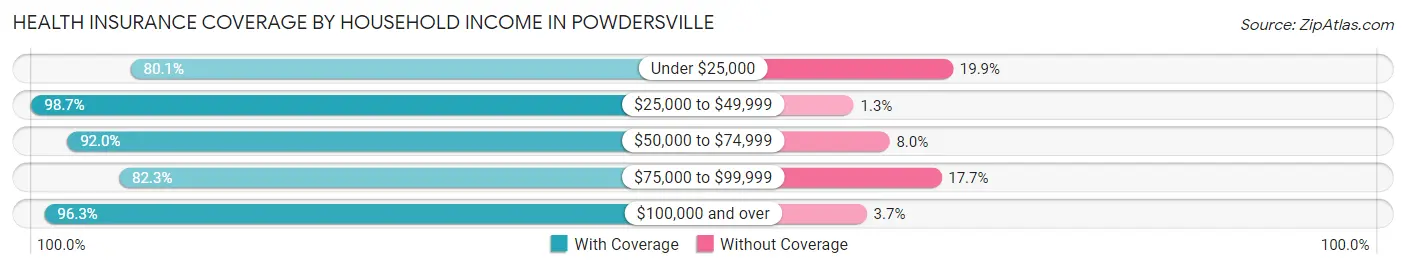
| Household Income | With Coverage | Without Coverage |
| Under $25,000 | 871 (80.1%) | 216 (19.9%) |
| $25,000 to $49,999 | 1,241 (98.7%) | 16 (1.3%) |
| $50,000 to $74,999 | 1,601 (92.0%) | 139 (8.0%) |
| $75,000 to $99,999 | 1,344 (82.3%) | 289 (17.7%) |
| $100,000 and over | 4,768 (96.3%) | 184 (3.7%) |
Public vs Private Health Insurance Coverage by Age in Powdersville
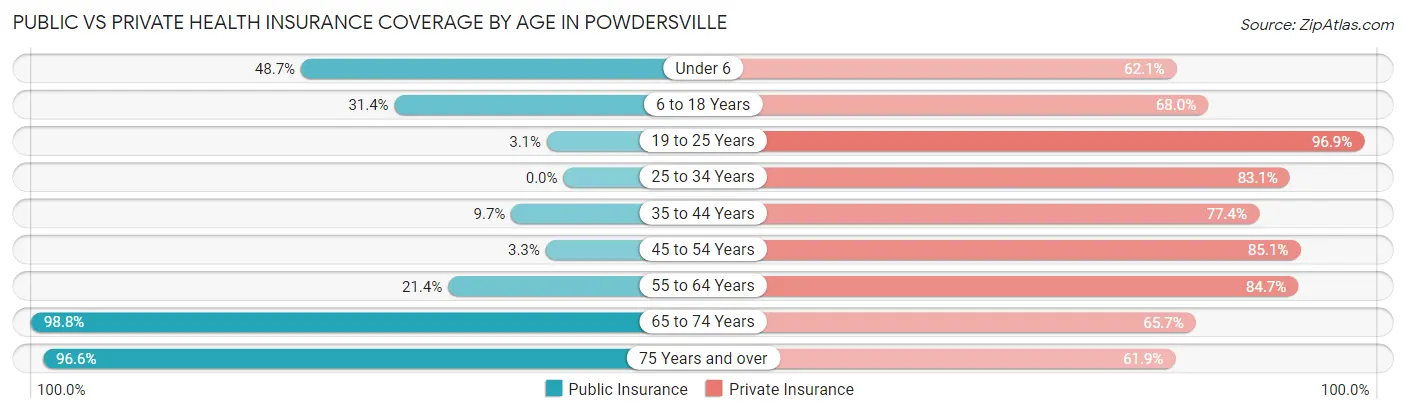
| Age Bracket | Public Insurance | Private Insurance |
| Under 6 | 320 (48.7%) | 408 (62.1%) |
| 6 to 18 Years | 500 (31.4%) | 1,084 (68.0%) |
| 19 to 25 Years | 37 (3.1%) | 1,173 (96.9%) |
| 25 to 34 Years | 0 (0.0%) | 907 (83.1%) |
| 35 to 44 Years | 164 (9.7%) | 1,312 (77.4%) |
| 45 to 54 Years | 47 (3.3%) | 1,214 (85.1%) |
| 55 to 64 Years | 270 (21.4%) | 1,068 (84.7%) |
| 65 to 74 Years | 1,260 (98.8%) | 837 (65.6%) |
| 75 Years and over | 451 (96.6%) | 289 (61.9%) |
| Total | 3,049 (28.5%) | 8,292 (77.6%) |
Disability Status by Sex by Age in Powdersville
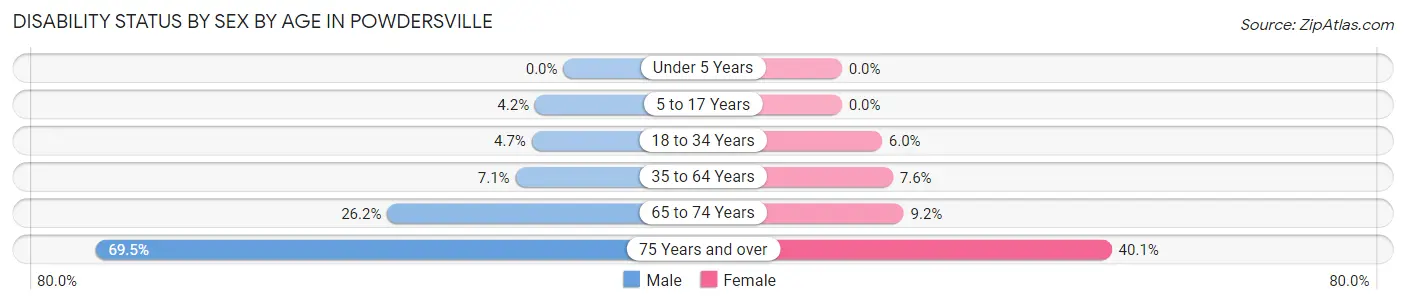
| Age Bracket | Male | Female |
| Under 5 Years | 0 (0.0%) | 0 (0.0%) |
| 5 to 17 Years | 40 (4.2%) | 0 (0.0%) |
| 18 to 34 Years | 67 (4.7%) | 52 (5.9%) |
| 35 to 64 Years | 159 (7.1%) | 163 (7.6%) |
| 65 to 74 Years | 154 (26.2%) | 63 (9.2%) |
| 75 Years and over | 132 (69.5%) | 111 (40.1%) |
Disability Class by Sex by Age in Powdersville
Disability Class: Hearing Difficulty
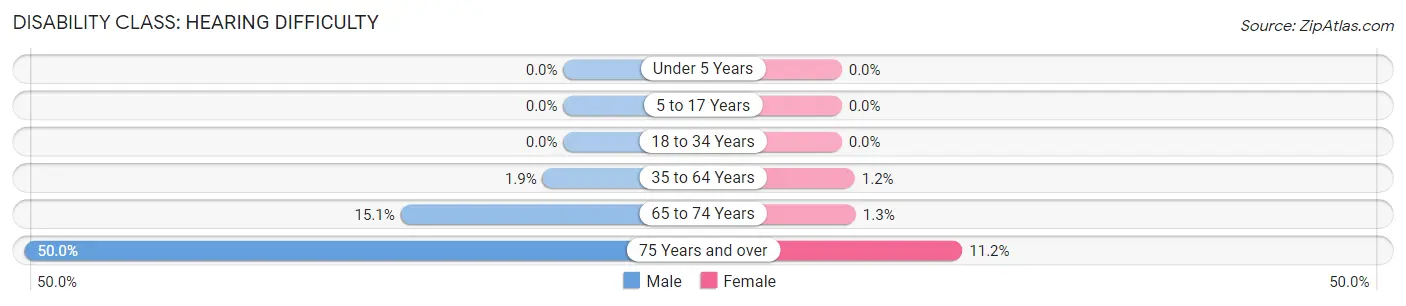
| Age Bracket | Male | Female |
| Under 5 Years | 0 (0.0%) | 0 (0.0%) |
| 5 to 17 Years | 0 (0.0%) | 0 (0.0%) |
| 18 to 34 Years | 0 (0.0%) | 0 (0.0%) |
| 35 to 64 Years | 43 (1.9%) | 26 (1.2%) |
| 65 to 74 Years | 89 (15.1%) | 9 (1.3%) |
| 75 Years and over | 95 (50.0%) | 31 (11.2%) |
Disability Class: Vision Difficulty
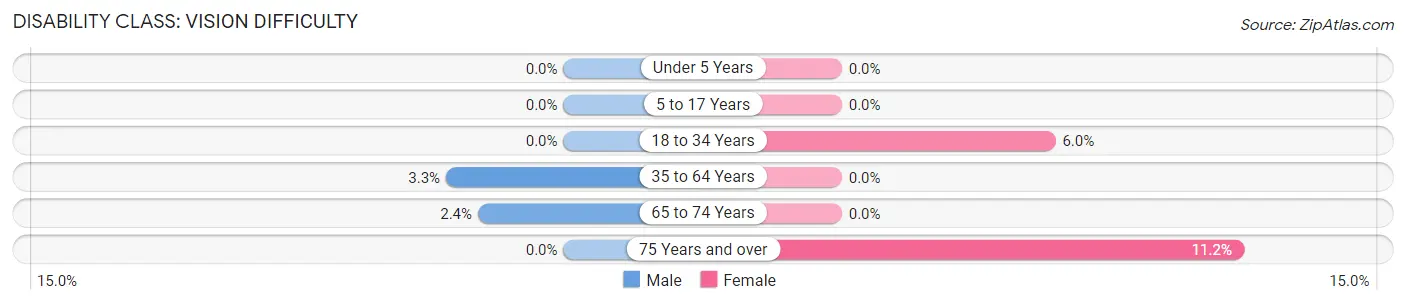
| Age Bracket | Male | Female |
| Under 5 Years | 0 (0.0%) | 0 (0.0%) |
| 5 to 17 Years | 0 (0.0%) | 0 (0.0%) |
| 18 to 34 Years | 0 (0.0%) | 52 (5.9%) |
| 35 to 64 Years | 73 (3.3%) | 0 (0.0%) |
| 65 to 74 Years | 14 (2.4%) | 0 (0.0%) |
| 75 Years and over | 0 (0.0%) | 31 (11.2%) |
Disability Class: Cognitive Difficulty
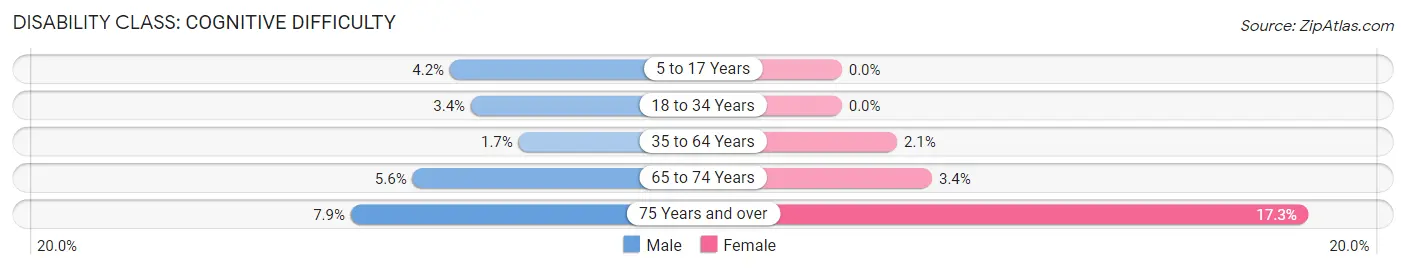
| Age Bracket | Male | Female |
| 5 to 17 Years | 40 (4.2%) | 0 (0.0%) |
| 18 to 34 Years | 49 (3.4%) | 0 (0.0%) |
| 35 to 64 Years | 37 (1.7%) | 44 (2.1%) |
| 65 to 74 Years | 33 (5.6%) | 23 (3.4%) |
| 75 Years and over | 15 (7.9%) | 48 (17.3%) |
Disability Class: Ambulatory Difficulty
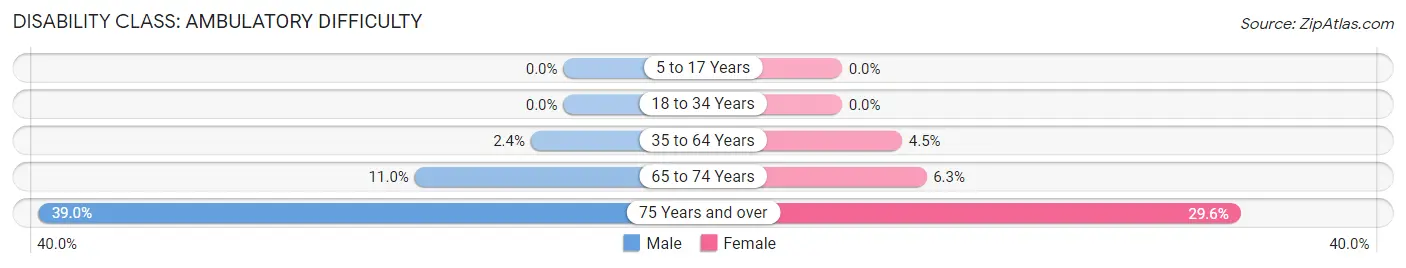
| Age Bracket | Male | Female |
| 5 to 17 Years | 0 (0.0%) | 0 (0.0%) |
| 18 to 34 Years | 0 (0.0%) | 0 (0.0%) |
| 35 to 64 Years | 54 (2.4%) | 96 (4.5%) |
| 65 to 74 Years | 65 (11.0%) | 43 (6.3%) |
| 75 Years and over | 74 (39.0%) | 82 (29.6%) |
Disability Class: Self-Care Difficulty
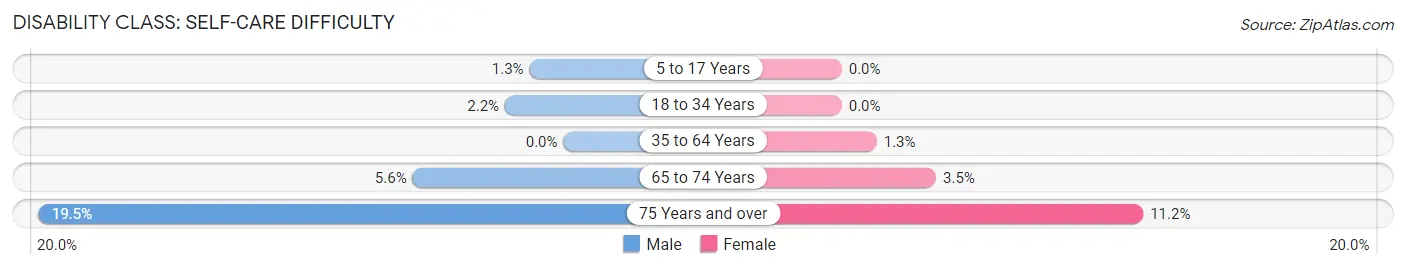
| Age Bracket | Male | Female |
| 5 to 17 Years | 12 (1.3%) | 0 (0.0%) |
| 18 to 34 Years | 31 (2.2%) | 0 (0.0%) |
| 35 to 64 Years | 0 (0.0%) | 28 (1.3%) |
| 65 to 74 Years | 33 (5.6%) | 24 (3.5%) |
| 75 Years and over | 37 (19.5%) | 31 (11.2%) |
Technology Access in Powdersville
Computing Device Access in Powdersville
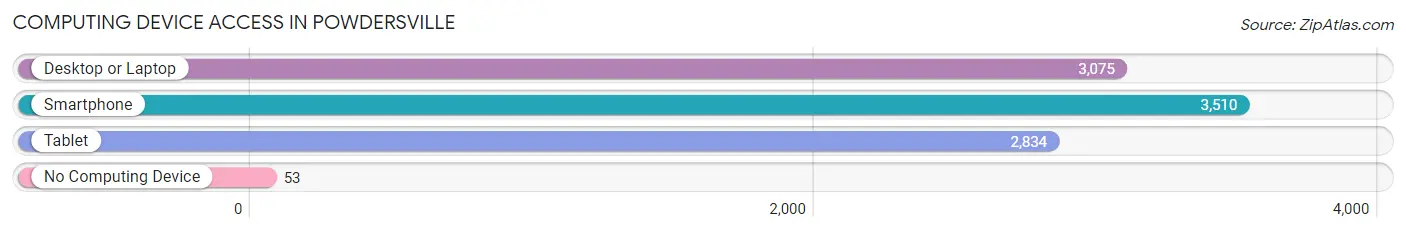
| Device Type | # Households | % Households |
| Desktop or Laptop | 3,075 | 81.0% |
| Smartphone | 3,510 | 92.5% |
| Tablet | 2,834 | 74.7% |
| No Computing Device | 53 | 1.4% |
| Total | 3,794 | 100.0% |
Internet Access in Powdersville
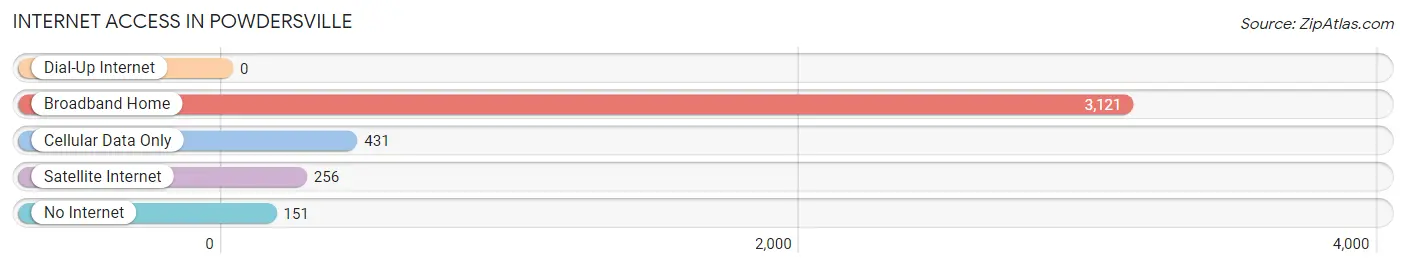
| Internet Type | # Households | % Households |
| Dial-Up Internet | 0 | 0.0% |
| Broadband Home | 3,121 | 82.3% |
| Cellular Data Only | 431 | 11.4% |
| Satellite Internet | 256 | 6.8% |
| No Internet | 151 | 4.0% |
| Total | 3,794 | 100.0% |
Powdersville Summary
Powdersville is a small town located in Anderson County, South Carolina. It is situated in the foothills of the Blue Ridge Mountains, approximately 20 miles northeast of Greenville. The town was founded in 1820 and is named after the local powder mill that was established in the area. The population of Powdersville was estimated to be 4,845 in 2019.
History
Powdersville was founded in 1820 by a group of settlers from North Carolina. The town was named after the local powder mill that was established in the area. The mill was used to produce gunpowder for the Confederate Army during the Civil War. After the war, the mill was converted into a cotton mill and the town began to grow. In the late 19th century, the town was home to several stores, a post office, a school, and a church.
In the early 20th century, the town experienced a period of growth and development. The town was incorporated in 1912 and the first mayor was elected in 1913. The town continued to grow and by the 1950s, it had become a thriving community with a population of over 1,000.
Geography
Powdersville is located in Anderson County, South Carolina. It is situated in the foothills of the Blue Ridge Mountains, approximately 20 miles northeast of Greenville. The town is located at an elevation of 845 feet above sea level. The town is bordered by the Saluda River to the north and the Reedy River to the south.
The climate in Powdersville is classified as humid subtropical. The average temperature in the summer is around 80°F and the average temperature in the winter is around 50°F. The town receives an average of 48 inches of rain per year.
Economy
The economy of Powdersville is largely based on agriculture and manufacturing. The town is home to several farms that produce a variety of crops, including corn, soybeans, and cotton. The town is also home to several manufacturing companies, including a paper mill and a furniture factory.
The town is also home to several retail stores, restaurants, and other businesses. The town is served by several major highways, including Interstate 85 and US Highway 25.
Demographics
The population of Powdersville was estimated to be 4,845 in 2019. The town has a diverse population, with the majority of residents being white (77.3%), followed by African American (17.2%), Hispanic (2.7%), and Asian (1.7%). The median household income in the town is $50,945 and the median home value is $179,400.
The town is served by the Anderson County School District, which includes three elementary schools, one middle school, and one high school. The town is also home to several churches, including Baptist, Methodist, and Presbyterian.
Conclusion
Powdersville is a small town located in Anderson County, South Carolina. It is situated in the foothills of the Blue Ridge Mountains, approximately 20 miles northeast of Greenville. The town was founded in 1820 and is named after the local powder mill that was established in the area. The population of Powdersville was estimated to be 4,845 in 2019. The economy of Powdersville is largely based on agriculture and manufacturing. The town is also home to several retail stores, restaurants, and other businesses. The town has a diverse population, with the majority of residents being white (77.3%), followed by African American (17.2%), Hispanic (2.7%), and Asian (1.7%). The town is served by the Anderson County School District, which includes three elementary schools, one middle school, and one high school.
Common Questions
What is Per Capita Income in Powdersville?
Per Capita income in Powdersville is $35,924.
What is the Median Family Income in Powdersville?
Median Family Income in Powdersville is $91,471.
What is the Median Household income in Powdersville?
Median Household Income in Powdersville is $81,375.
What is Income or Wage Gap in Powdersville?
Income or Wage Gap in Powdersville is 20.3%.
Women in Powdersville earn 79.7 cents for every dollar earned by a man.
What is Inequality or Gini Index in Powdersville?
Inequality or Gini Index in Powdersville is 0.39.
What is the Total Population of Powdersville?
Total Population of Powdersville is 10,678.
What is the Total Male Population of Powdersville?
Total Male Population of Powdersville is 5,712.
What is the Total Female Population of Powdersville?
Total Female Population of Powdersville is 4,966.
What is the Ratio of Males per 100 Females in Powdersville?
There are 115.02 Males per 100 Females in Powdersville.
What is the Ratio of Females per 100 Males in Powdersville?
There are 86.94 Females per 100 Males in Powdersville.
What is the Median Population Age in Powdersville?
Median Population Age in Powdersville is 40.7 Years.
What is the Average Family Size in Powdersville
Average Family Size in Powdersville is 3.1 People.
What is the Average Household Size in Powdersville
Average Household Size in Powdersville is 2.8 People.
How Large is the Labor Force in Powdersville?
There are 5,764 People in the Labor Forcein in Powdersville.
What is the Percentage of People in the Labor Force in Powdersville?
66.2% of People are in the Labor Force in Powdersville.
What is the Unemployment Rate in Powdersville?
Unemployment Rate in Powdersville is 3.3%.