Chapin, SC Map & Demographics
Chapin Map
Chapin Overview
$35,205
PER CAPITA INCOME
$84,310
AVG FAMILY INCOME
$77,917
AVG HOUSEHOLD INCOME
57.3%
WAGE / INCOME GAP [ % ]
42.7¢/ $1
WAGE / INCOME GAP [ $ ]
$11,945
FAMILY INCOME DEFICIT
0.36
INEQUALITY / GINI INDEX
1,543
TOTAL POPULATION
705
MALE POPULATION
838
FEMALE POPULATION
84.13
MALES / 100 FEMALES
118.87
FEMALES / 100 MALES
38.9
MEDIAN AGE
3.0
AVG FAMILY SIZE
2.4
AVG HOUSEHOLD SIZE
840
LABOR FORCE [ PEOPLE ]
68.6%
PERCENT IN LABOR FORCE
9.3%
UNEMPLOYMENT RATE
Chapin Zip Codes
Chapin Area Codes
Income in Chapin
Income Overview in Chapin
Per Capita Income in Chapin is $35,205, while median incomes of families and households are $84,310 and $77,917 respectively.
| Characteristic | Number | Measure |
| Per Capita Income | 1,543 | $35,205 |
| Median Family Income | 408 | $84,310 |
| Mean Family Income | 408 | $98,620 |
| Median Household Income | 630 | $77,917 |
| Mean Household Income | 630 | $84,910 |
| Income Deficit | 408 | $11,945 |
| Wage / Income Gap (%) | 1,543 | 57.28% |
| Wage / Income Gap ($) | 1,543 | 42.72¢ per $1 |
| Gini / Inequality Index | 1,543 | 0.36 |
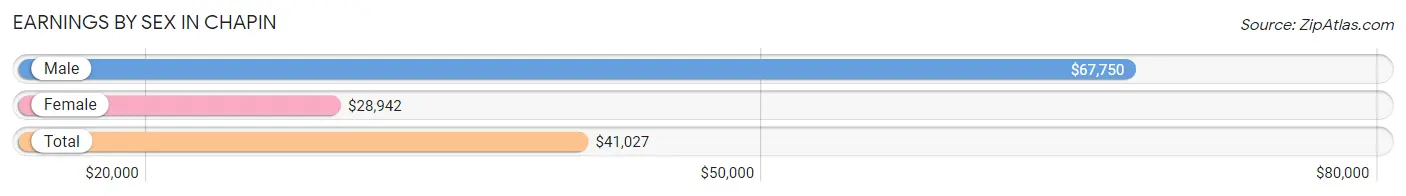
Earnings by Sex in Chapin
Average Earnings in Chapin are $41,027, $67,750 for men and $28,942 for women, a difference of 57.3%.
| Sex | Number | Average Earnings |
| Male | 427 (49.9%) | $67,750 |
| Female | 428 (50.1%) | $28,942 |
| Total | 855 (100.0%) | $41,027 |
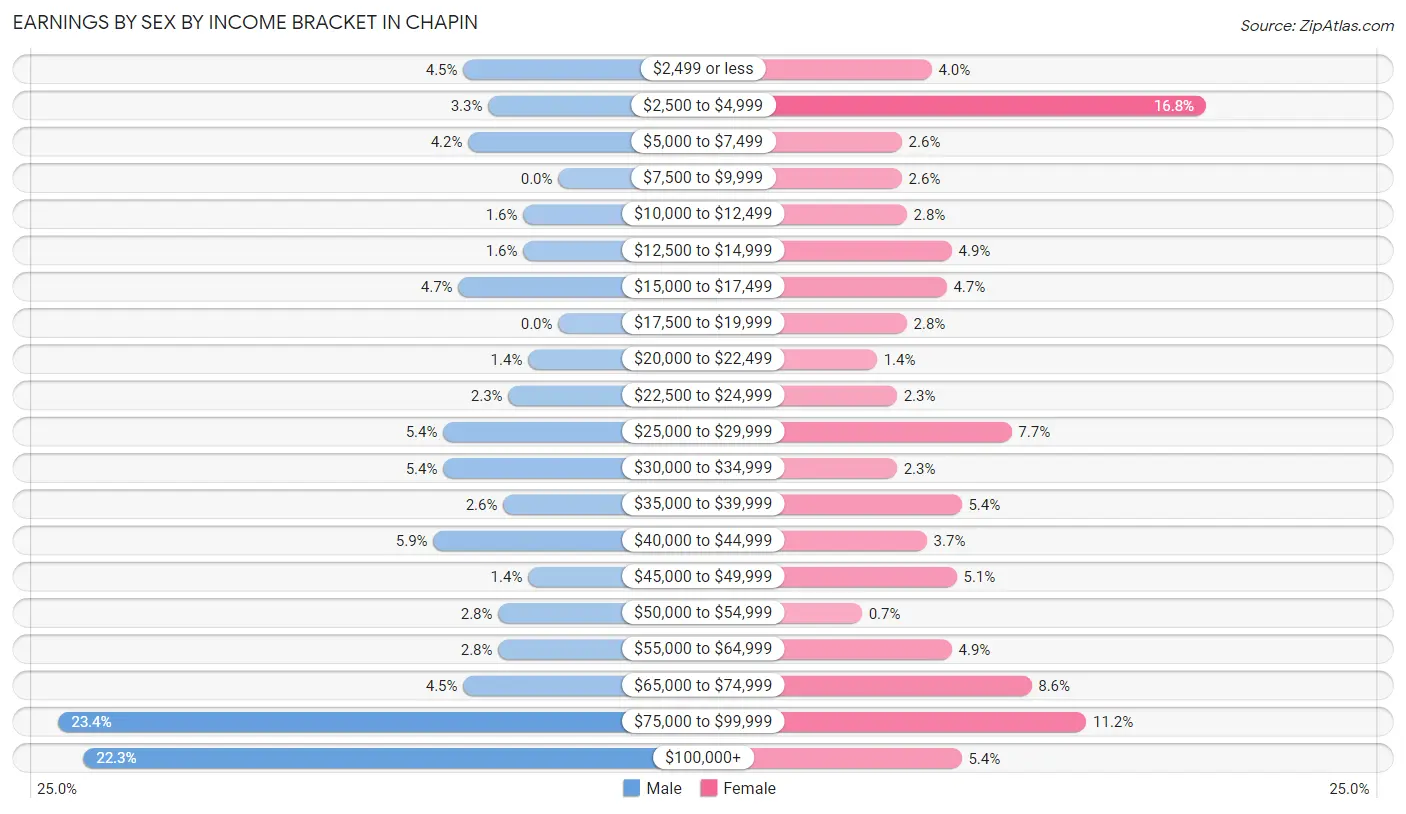
Earnings by Sex by Income Bracket in Chapin
The most common earnings brackets in Chapin are $75,000 to $99,999 for men (100 | 23.4%) and $2,500 to $4,999 for women (72 | 16.8%).
| Income | Male | Female |
| $2,499 or less | 19 (4.4%) | 17 (4.0%) |
| $2,500 to $4,999 | 14 (3.3%) | 72 (16.8%) |
| $5,000 to $7,499 | 18 (4.2%) | 11 (2.6%) |
| $7,500 to $9,999 | 0 (0.0%) | 11 (2.6%) |
| $10,000 to $12,499 | 7 (1.6%) | 12 (2.8%) |
| $12,500 to $14,999 | 7 (1.6%) | 21 (4.9%) |
| $15,000 to $17,499 | 20 (4.7%) | 20 (4.7%) |
| $17,500 to $19,999 | 0 (0.0%) | 12 (2.8%) |
| $20,000 to $22,499 | 6 (1.4%) | 6 (1.4%) |
| $22,500 to $24,999 | 10 (2.3%) | 10 (2.3%) |
| $25,000 to $29,999 | 23 (5.4%) | 33 (7.7%) |
| $30,000 to $34,999 | 23 (5.4%) | 10 (2.3%) |
| $35,000 to $39,999 | 11 (2.6%) | 23 (5.4%) |
| $40,000 to $44,999 | 25 (5.9%) | 16 (3.7%) |
| $45,000 to $49,999 | 6 (1.4%) | 22 (5.1%) |
| $50,000 to $54,999 | 12 (2.8%) | 3 (0.7%) |
| $55,000 to $64,999 | 12 (2.8%) | 21 (4.9%) |
| $65,000 to $74,999 | 19 (4.4%) | 37 (8.6%) |
| $75,000 to $99,999 | 100 (23.4%) | 48 (11.2%) |
| $100,000+ | 95 (22.3%) | 23 (5.4%) |
| Total | 427 (100.0%) | 428 (100.0%) |
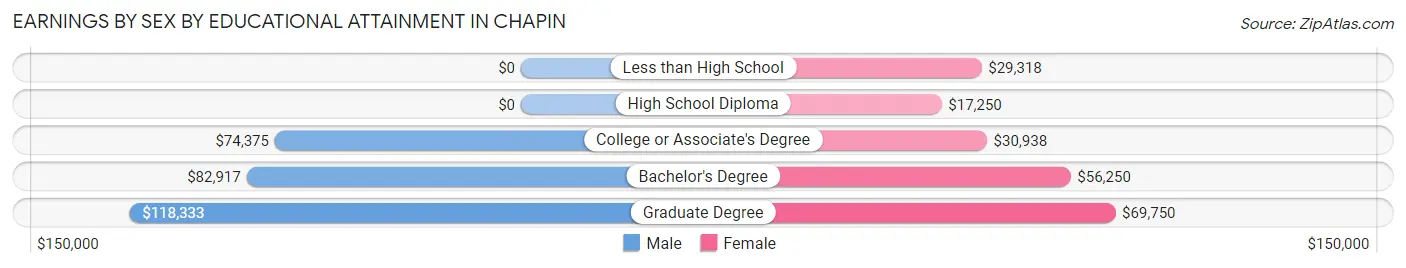
Earnings by Sex by Educational Attainment in Chapin
Average earnings in Chapin are $78,011 for men and $39,432 for women, a difference of 49.4%. Men with an educational attainment of graduate degree enjoy the highest average annual earnings of $118,333, while those with college or associate's degree education earn the least with $74,375. Women with an educational attainment of graduate degree earn the most with the average annual earnings of $69,750, while those with high school diploma education have the smallest earnings of $17,250.
| Educational Attainment | Male Income | Female Income |
| Less than High School | - | - |
| High School Diploma | - | - |
| College or Associate's Degree | $74,375 | $30,938 |
| Bachelor's Degree | $82,917 | $56,250 |
| Graduate Degree | $118,333 | $69,750 |
| Total | $78,011 | $39,432 |
Family Income in Chapin
Family Income Brackets in Chapin
According to the Chapin family income data, there are 105 families falling into the $75,000 to $99,999 income range, which is the most common income bracket and makes up 25.7% of all families. Conversely, the less than $10,000 income bracket is the least frequent group with only 4 families (1.0%) belonging to this category.
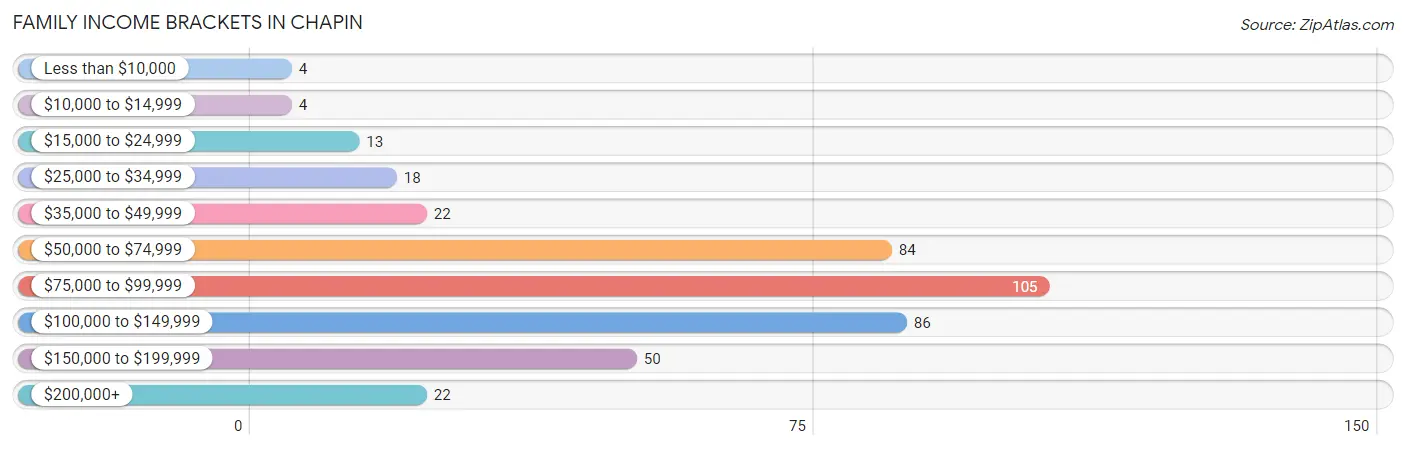
| Income Bracket | # Families | % Families |
| Less than $10,000 | 4 | 1.0% |
| $10,000 to $14,999 | 4 | 1.0% |
| $15,000 to $24,999 | 13 | 3.2% |
| $25,000 to $34,999 | 18 | 4.4% |
| $35,000 to $49,999 | 22 | 5.4% |
| $50,000 to $74,999 | 84 | 20.6% |
| $75,000 to $99,999 | 105 | 25.7% |
| $100,000 to $149,999 | 86 | 21.1% |
| $150,000 to $199,999 | 50 | 12.3% |
| $200,000+ | 22 | 5.4% |
Family Income by Famaliy Size in Chapin
5-person families (26 | 6.4%) account for the highest median family income in Chapin with $144,583 per family, while 2-person families (163 | 40.0%) have the highest median income of $37,266 per family member.
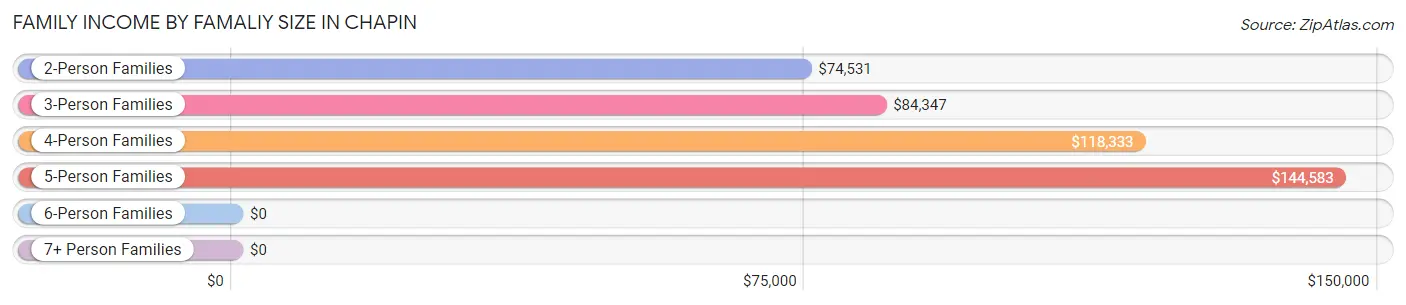
| Income Bracket | # Families | Median Income |
| 2-Person Families | 163 (40.0%) | $74,531 |
| 3-Person Families | 131 (32.1%) | $84,347 |
| 4-Person Families | 78 (19.1%) | $118,333 |
| 5-Person Families | 26 (6.4%) | $144,583 |
| 6-Person Families | 8 (2.0%) | $0 |
| 7+ Person Families | 2 (0.5%) | $0 |
| Total | 408 (100.0%) | $84,310 |
Family Income by Number of Earners in Chapin
The median family income in Chapin is $84,310, with families comprising 3+ earners (37) having the highest median family income of $147,083, while families with no earners (47) have the lowest median family income of $54,107, accounting for 9.1% and 11.5% of families, respectively.
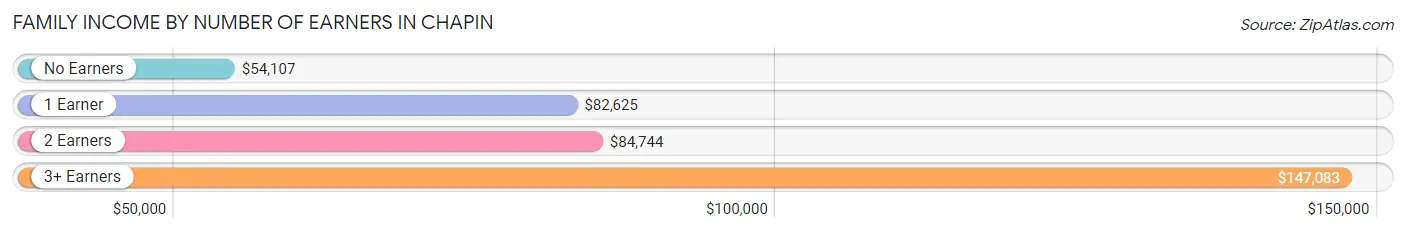
| Number of Earners | # Families | Median Income |
| No Earners | 47 (11.5%) | $54,107 |
| 1 Earner | 133 (32.6%) | $82,625 |
| 2 Earners | 191 (46.8%) | $84,744 |
| 3+ Earners | 37 (9.1%) | $147,083 |
| Total | 408 (100.0%) | $84,310 |
Household Income in Chapin
Household Income Brackets in Chapin
With 137 households falling in the category, the $75,000 to $99,999 income range is the most frequent in Chapin, accounting for 21.7% of all households. In contrast, only 4 households (0.6%) fall into the $10,000 to $14,999 income bracket, making it the least populous group.
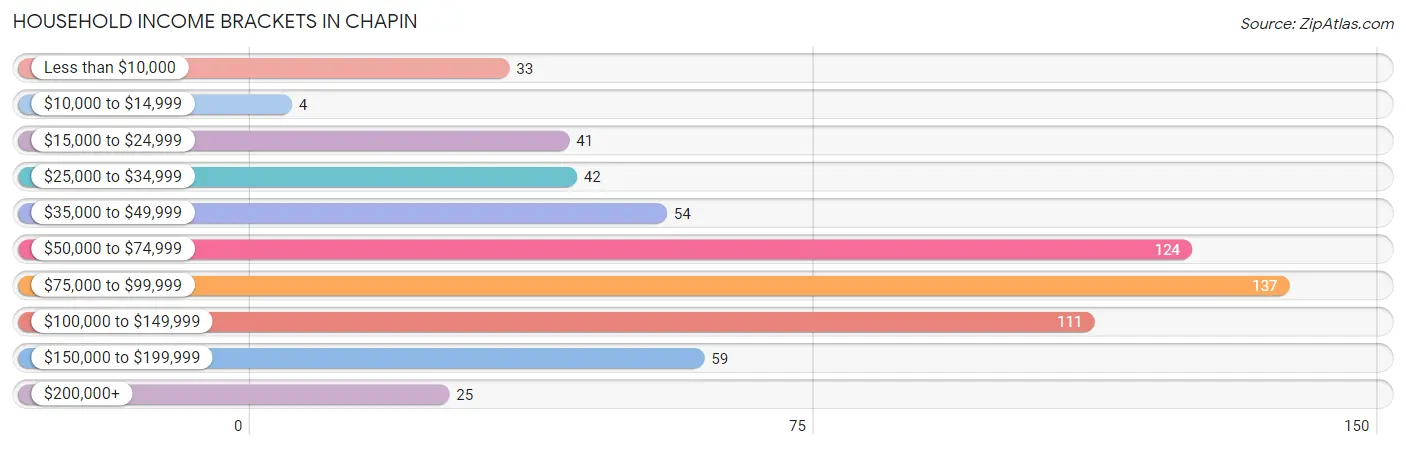
| Income Bracket | # Households | % Households |
| Less than $10,000 | 33 | 5.2% |
| $10,000 to $14,999 | 4 | 0.6% |
| $15,000 to $24,999 | 41 | 6.5% |
| $25,000 to $34,999 | 42 | 6.7% |
| $35,000 to $49,999 | 54 | 8.6% |
| $50,000 to $74,999 | 124 | 19.7% |
| $75,000 to $99,999 | 137 | 21.7% |
| $100,000 to $149,999 | 111 | 17.6% |
| $150,000 to $199,999 | 59 | 9.4% |
| $200,000+ | 25 | 4.0% |
Household Income by Householder Age in Chapin
The median household income in Chapin is $77,917, with the highest median household income of $84,119 found in the 45 to 64 years age bracket for the primary householder. A total of 235 households (37.3%) fall into this category. Meanwhile, the 15 to 24 years age bracket for the primary householder has the lowest median household income of $0, with 9 households (1.4%) in this group.
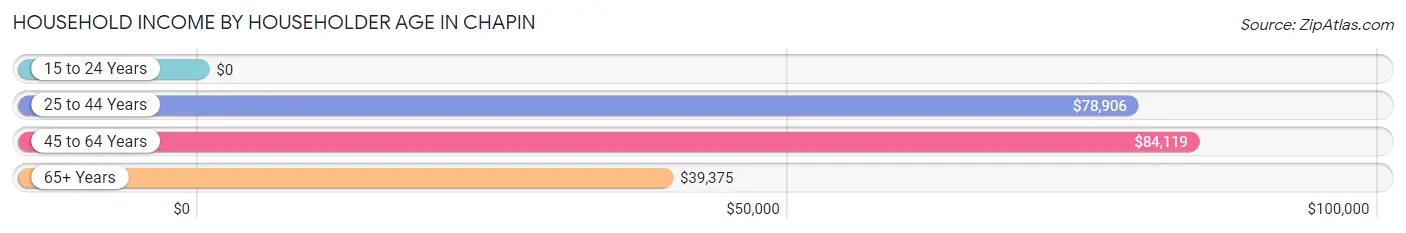
| Income Bracket | # Households | Median Income |
| 15 to 24 Years | 9 (1.4%) | $0 |
| 25 to 44 Years | 237 (37.6%) | $78,906 |
| 45 to 64 Years | 235 (37.3%) | $84,119 |
| 65+ Years | 149 (23.6%) | $39,375 |
| Total | 630 (100.0%) | $77,917 |
Poverty in Chapin
Income Below Poverty by Sex and Age in Chapin
With 4.3% poverty level for males and 6.9% for females among the residents of Chapin, 12 to 14 year old males and 75 year old and over females are the most vulnerable to poverty, with 6 males (33.3%) and 14 females (21.9%) in their respective age groups living below the poverty level.
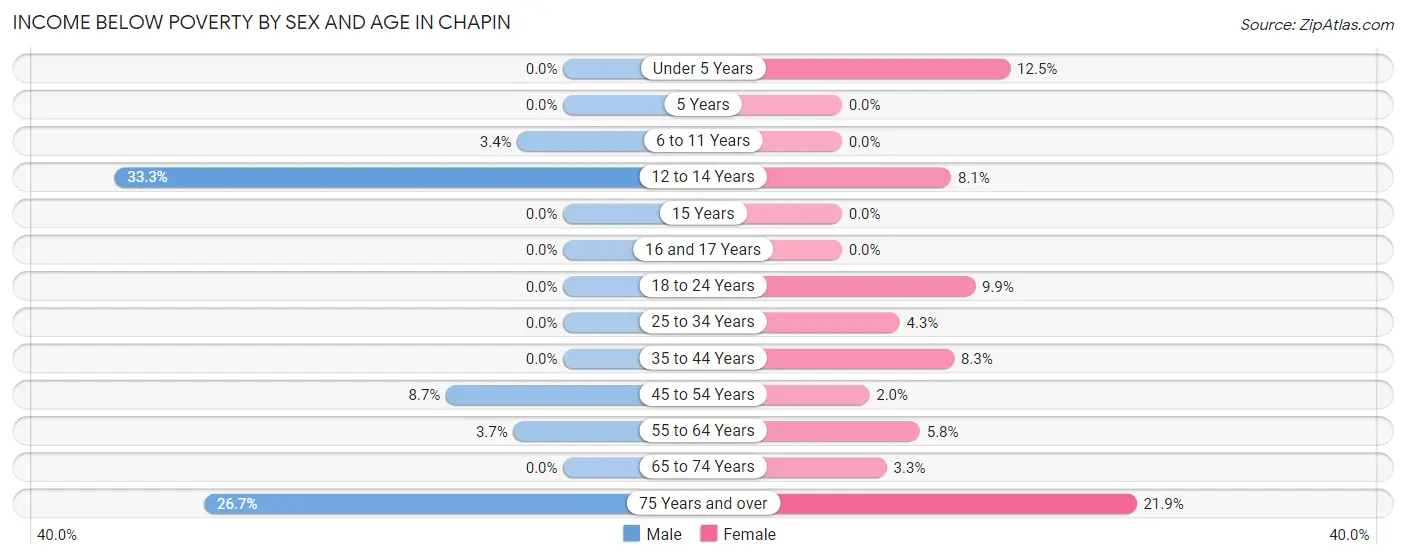
| Age Bracket | Male | Female |
| Under 5 Years | 0 (0.0%) | 3 (12.5%) |
| 5 Years | 0 (0.0%) | 0 (0.0%) |
| 6 to 11 Years | 3 (3.4%) | 0 (0.0%) |
| 12 to 14 Years | 6 (33.3%) | 3 (8.1%) |
| 15 Years | 0 (0.0%) | 0 (0.0%) |
| 16 and 17 Years | 0 (0.0%) | 0 (0.0%) |
| 18 to 24 Years | 0 (0.0%) | 9 (9.9%) |
| 25 to 34 Years | 0 (0.0%) | 3 (4.3%) |
| 35 to 44 Years | 0 (0.0%) | 14 (8.3%) |
| 45 to 54 Years | 10 (8.7%) | 2 (2.0%) |
| 55 to 64 Years | 3 (3.7%) | 7 (5.8%) |
| 65 to 74 Years | 0 (0.0%) | 2 (3.3%) |
| 75 Years and over | 8 (26.7%) | 14 (21.9%) |
| Total | 30 (4.3%) | 57 (6.9%) |
Income Above Poverty by Sex and Age in Chapin
According to the poverty statistics in Chapin, males aged under 5 years and females aged 5 years are the age groups that are most secure financially, with 100.0% of males and 100.0% of females in these age groups living above the poverty line.
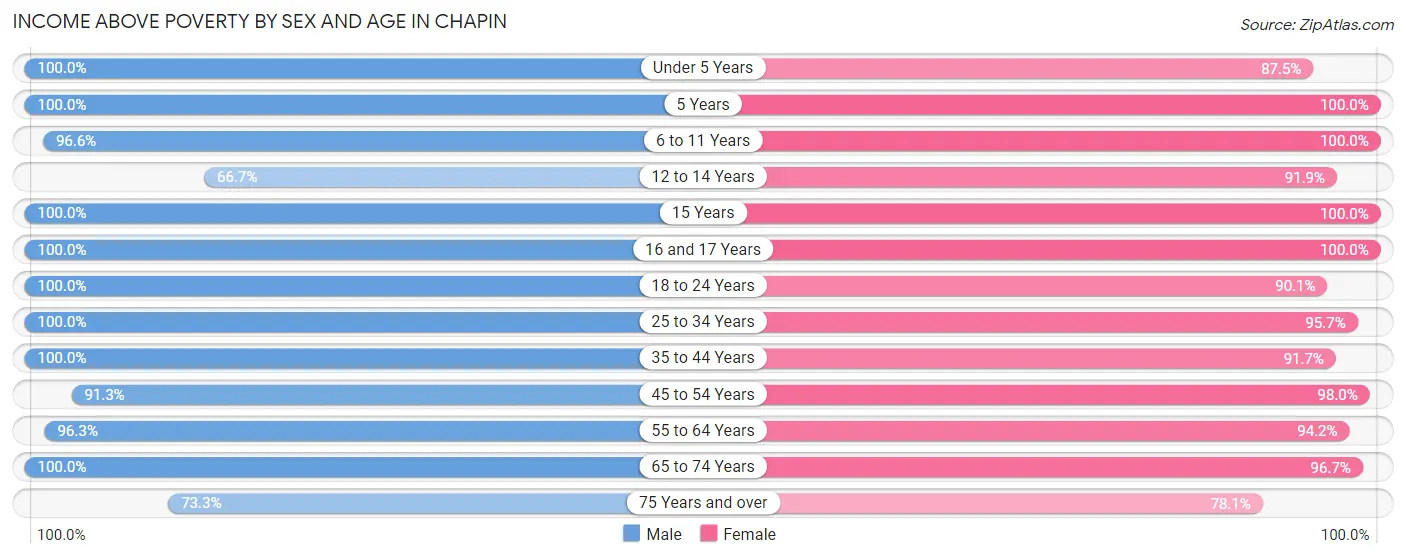
| Age Bracket | Male | Female |
| Under 5 Years | 41 (100.0%) | 21 (87.5%) |
| 5 Years | 3 (100.0%) | 33 (100.0%) |
| 6 to 11 Years | 85 (96.6%) | 46 (100.0%) |
| 12 to 14 Years | 12 (66.7%) | 34 (91.9%) |
| 15 Years | 5 (100.0%) | 12 (100.0%) |
| 16 and 17 Years | 37 (100.0%) | 6 (100.0%) |
| 18 to 24 Years | 39 (100.0%) | 82 (90.1%) |
| 25 to 34 Years | 82 (100.0%) | 67 (95.7%) |
| 35 to 44 Years | 97 (100.0%) | 154 (91.7%) |
| 45 to 54 Years | 105 (91.3%) | 96 (98.0%) |
| 55 to 64 Years | 78 (96.3%) | 114 (94.2%) |
| 65 to 74 Years | 65 (100.0%) | 58 (96.7%) |
| 75 Years and over | 22 (73.3%) | 50 (78.1%) |
| Total | 671 (95.7%) | 773 (93.1%) |
Income Below Poverty Among Married-Couple Families in Chapin
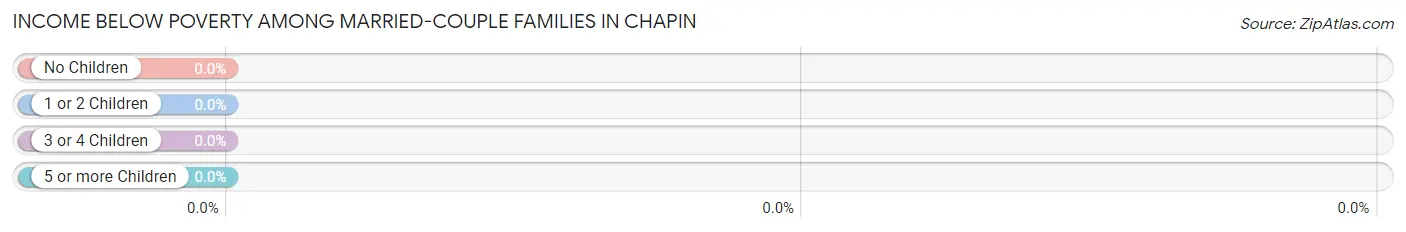
| Children | Above Poverty | Below Poverty |
| No Children | 153 (100.0%) | 0 (0.0%) |
| 1 or 2 Children | 100 (100.0%) | 0 (0.0%) |
| 3 or 4 Children | 23 (100.0%) | 0 (0.0%) |
| 5 or more Children | 0 (0.0%) | 0 (0.0%) |
| Total | 276 (100.0%) | 0 (0.0%) |
Income Below Poverty Among Single-Parent Households in Chapin
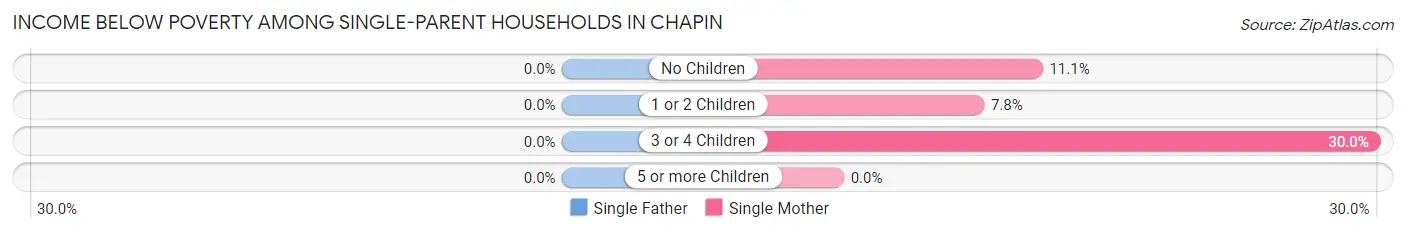
| Children | Single Father | Single Mother |
| No Children | 0 (0.0%) | 4 (11.1%) |
| 1 or 2 Children | 0 (0.0%) | 4 (7.8%) |
| 3 or 4 Children | 0 (0.0%) | 3 (30.0%) |
| 5 or more Children | 0 (0.0%) | 0 (0.0%) |
| Total | 0 (0.0%) | 11 (11.3%) |
Income Below Poverty Among Married-Couple vs Single-Parent Households in Chapin
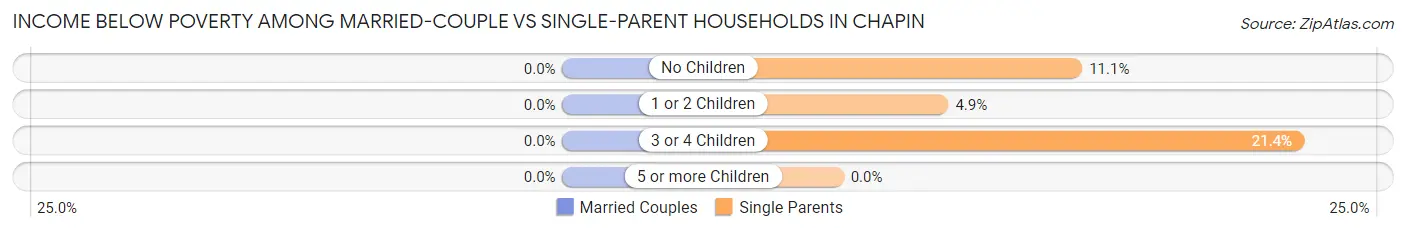
| Children | Married-Couple Families | Single-Parent Households |
| No Children | 0 (0.0%) | 4 (11.1%) |
| 1 or 2 Children | 0 (0.0%) | 4 (4.9%) |
| 3 or 4 Children | 0 (0.0%) | 3 (21.4%) |
| 5 or more Children | 0 (0.0%) | 0 (0.0%) |
| Total | 0 (0.0%) | 11 (8.3%) |
Race in Chapin
The most populous races in Chapin are White / Caucasian (1,287 | 83.4%), Black / African American (165 | 10.7%), and Two or more Races (60 | 3.9%).
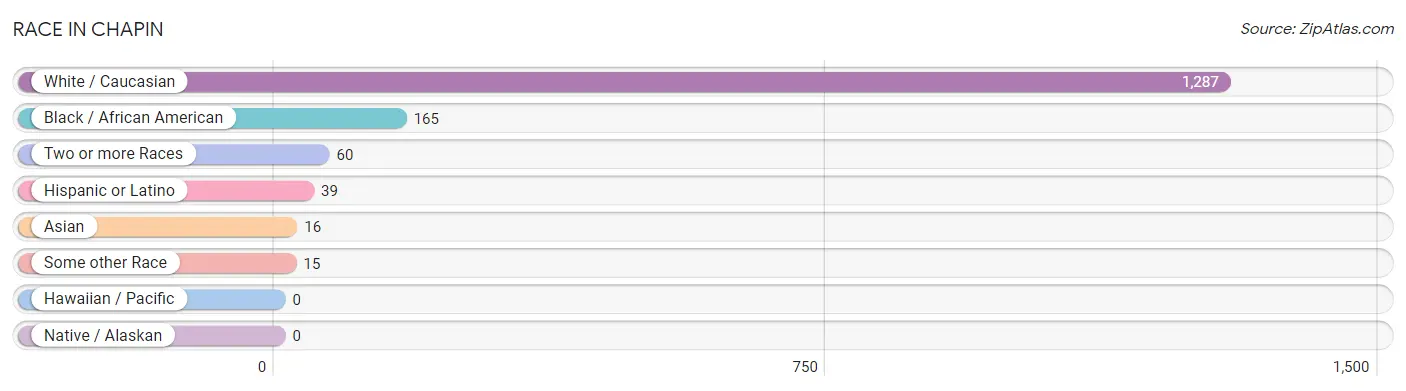
| Race | # Population | % Population |
| Asian | 16 | 1.0% |
| Black / African American | 165 | 10.7% |
| Hawaiian / Pacific | 0 | 0.0% |
| Hispanic or Latino | 39 | 2.5% |
| Native / Alaskan | 0 | 0.0% |
| White / Caucasian | 1,287 | 83.4% |
| Two or more Races | 60 | 3.9% |
| Some other Race | 15 | 1.0% |
| Total | 1,543 | 100.0% |
Ancestry in Chapin
The most populous ancestries reported in Chapin are German (353 | 22.9%), Irish (151 | 9.8%), English (121 | 7.8%), American (120 | 7.8%), and Scottish (93 | 6.0%), together accounting for 54.3% of all Chapin residents.
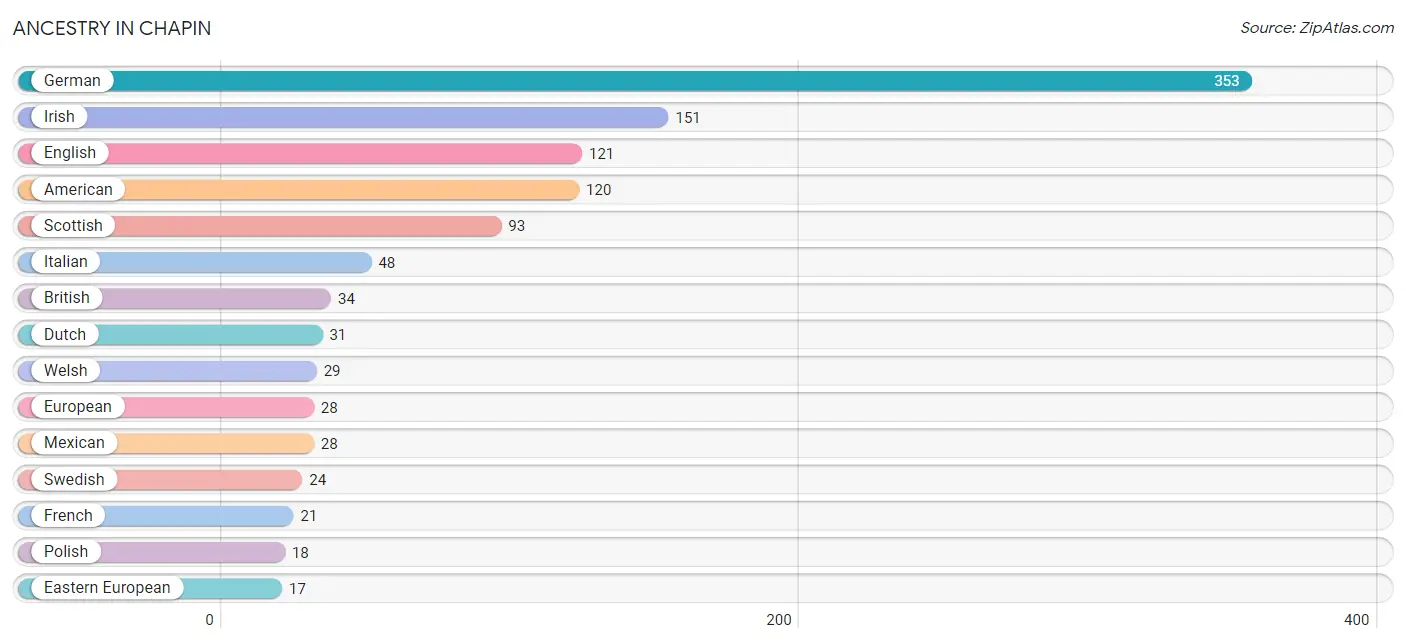
| Ancestry | # Population | % Population |
| African | 6 | 0.4% |
| American | 120 | 7.8% |
| Apache | 5 | 0.3% |
| Argentinean | 11 | 0.7% |
| Austrian | 3 | 0.2% |
| Bhutanese | 6 | 0.4% |
| British | 34 | 2.2% |
| Cherokee | 14 | 0.9% |
| Czech | 2 | 0.1% |
| Danish | 3 | 0.2% |
| Dutch | 31 | 2.0% |
| Eastern European | 17 | 1.1% |
| English | 121 | 7.8% |
| European | 28 | 1.8% |
| French | 21 | 1.4% |
| German | 353 | 22.9% |
| Greek | 7 | 0.4% |
| Hungarian | 3 | 0.2% |
| Indian (Asian) | 10 | 0.6% |
| Irish | 151 | 9.8% |
| Italian | 48 | 3.1% |
| Laotian | 9 | 0.6% |
| Lithuanian | 5 | 0.3% |
| Mexican | 28 | 1.8% |
| Nigerian | 1 | 0.1% |
| Norwegian | 5 | 0.3% |
| Polish | 18 | 1.2% |
| Romanian | 12 | 0.8% |
| Russian | 4 | 0.3% |
| Scandinavian | 13 | 0.8% |
| Scotch-Irish | 14 | 0.9% |
| Scottish | 93 | 6.0% |
| Slovak | 4 | 0.3% |
| South American | 11 | 0.7% |
| Subsaharan African | 7 | 0.4% |
| Swedish | 24 | 1.6% |
| Swiss | 10 | 0.6% |
| Welsh | 29 | 1.9% | View All 38 Rows |
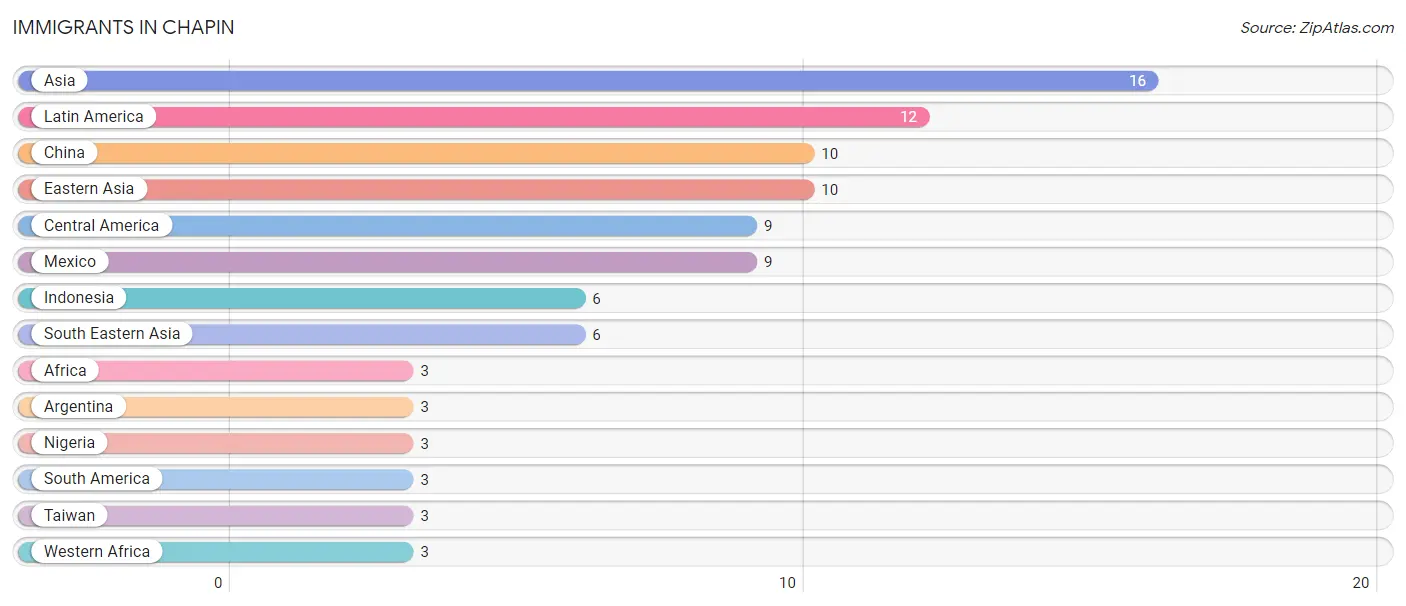
Immigrants in Chapin
The most numerous immigrant groups reported in Chapin came from Asia (16 | 1.0%), Latin America (12 | 0.8%), China (10 | 0.6%), Eastern Asia (10 | 0.6%), and Central America (9 | 0.6%), together accounting for 3.7% of all Chapin residents.
| Immigration Origin | # Population | % Population |
| Africa | 3 | 0.2% |
| Argentina | 3 | 0.2% |
| Asia | 16 | 1.0% |
| Central America | 9 | 0.6% |
| China | 10 | 0.6% |
| Eastern Asia | 10 | 0.6% |
| Indonesia | 6 | 0.4% |
| Latin America | 12 | 0.8% |
| Mexico | 9 | 0.6% |
| Nigeria | 3 | 0.2% |
| South America | 3 | 0.2% |
| South Eastern Asia | 6 | 0.4% |
| Taiwan | 3 | 0.2% |
| Western Africa | 3 | 0.2% | View All 14 Rows |
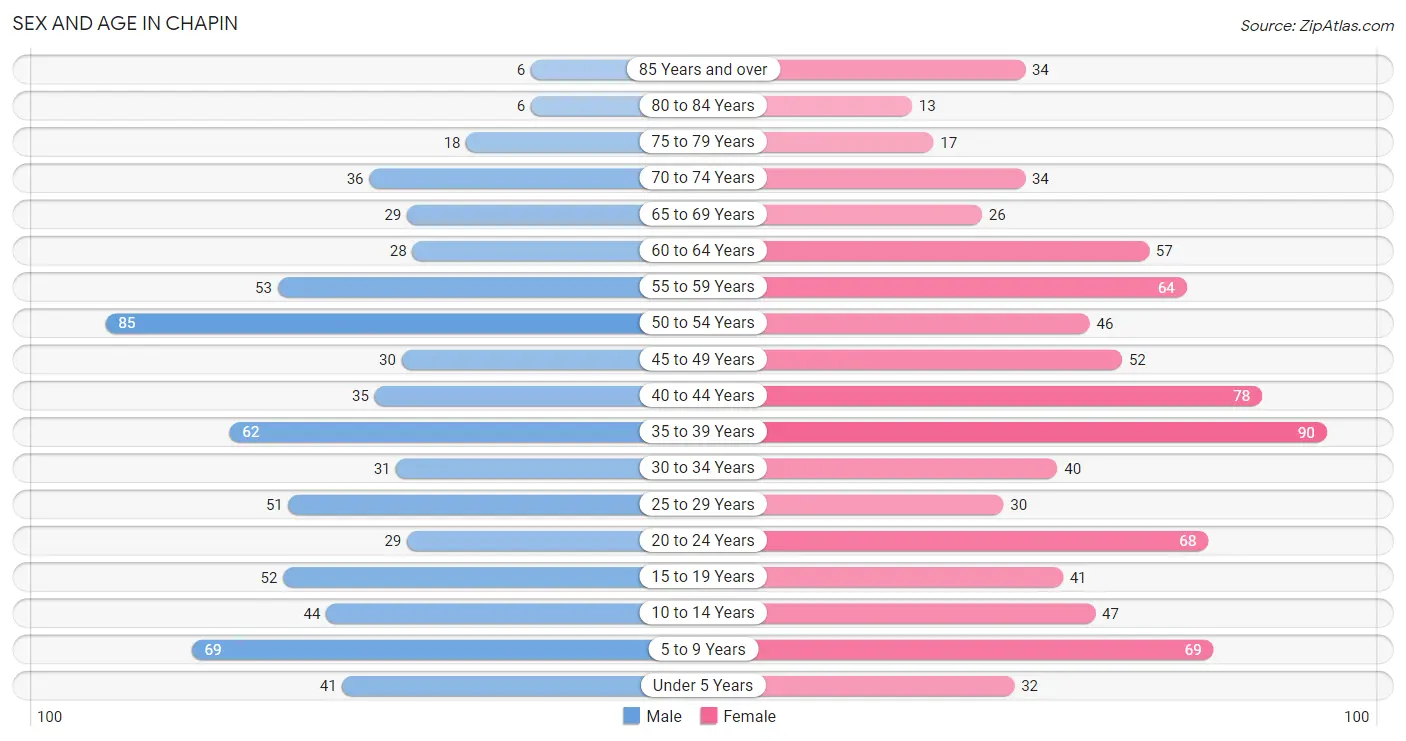
Sex and Age in Chapin
Sex and Age in Chapin
The most populous age groups in Chapin are 50 to 54 Years (85 | 12.1%) for men and 35 to 39 Years (90 | 10.7%) for women.
| Age Bracket | Male | Female |
| Under 5 Years | 41 (5.8%) | 32 (3.8%) |
| 5 to 9 Years | 69 (9.8%) | 69 (8.2%) |
| 10 to 14 Years | 44 (6.2%) | 47 (5.6%) |
| 15 to 19 Years | 52 (7.4%) | 41 (4.9%) |
| 20 to 24 Years | 29 (4.1%) | 68 (8.1%) |
| 25 to 29 Years | 51 (7.2%) | 30 (3.6%) |
| 30 to 34 Years | 31 (4.4%) | 40 (4.8%) |
| 35 to 39 Years | 62 (8.8%) | 90 (10.7%) |
| 40 to 44 Years | 35 (5.0%) | 78 (9.3%) |
| 45 to 49 Years | 30 (4.3%) | 52 (6.2%) |
| 50 to 54 Years | 85 (12.1%) | 46 (5.5%) |
| 55 to 59 Years | 53 (7.5%) | 64 (7.6%) |
| 60 to 64 Years | 28 (4.0%) | 57 (6.8%) |
| 65 to 69 Years | 29 (4.1%) | 26 (3.1%) |
| 70 to 74 Years | 36 (5.1%) | 34 (4.1%) |
| 75 to 79 Years | 18 (2.5%) | 17 (2.0%) |
| 80 to 84 Years | 6 (0.9%) | 13 (1.5%) |
| 85 Years and over | 6 (0.9%) | 34 (4.1%) |
| Total | 705 (100.0%) | 838 (100.0%) |
Families and Households in Chapin
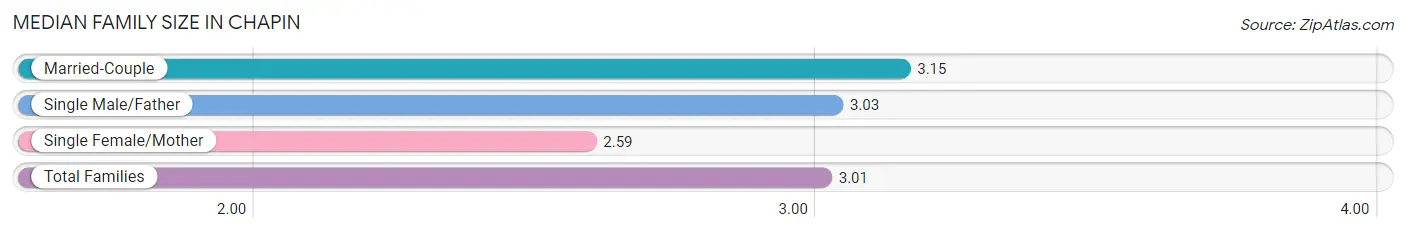
Median Family Size in Chapin
The median family size in Chapin is 3.01 persons per family, with married-couple families (276 | 67.6%) accounting for the largest median family size of 3.15 persons per family. On the other hand, single female/mother families (97 | 23.8%) represent the smallest median family size with 2.59 persons per family.
| Family Type | # Families | Family Size |
| Married-Couple | 276 (67.6%) | 3.15 |
| Single Male/Father | 35 (8.6%) | 3.03 |
| Single Female/Mother | 97 (23.8%) | 2.59 |
| Total Families | 408 (100.0%) | 3.01 |
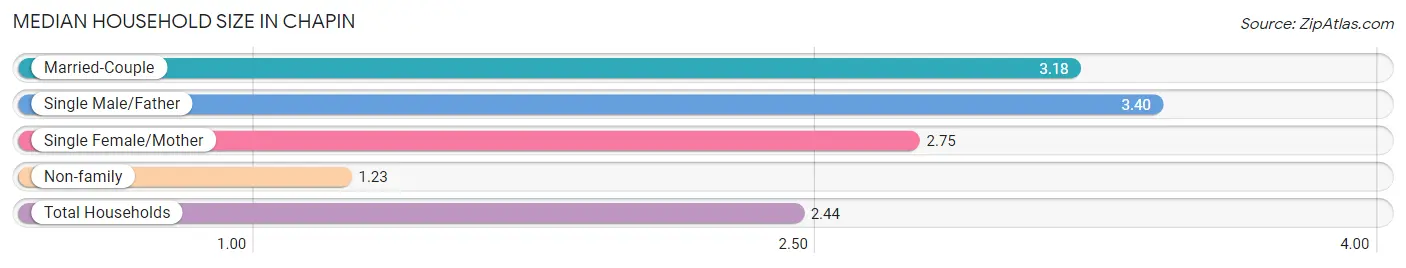
Median Household Size in Chapin
The median household size in Chapin is 2.44 persons per household, with single male/father households (35 | 5.6%) accounting for the largest median household size of 3.4 persons per household. non-family households (222 | 35.2%) represent the smallest median household size with 1.23 persons per household.
| Household Type | # Households | Household Size |
| Married-Couple | 276 (43.8%) | 3.18 |
| Single Male/Father | 35 (5.6%) | 3.40 |
| Single Female/Mother | 97 (15.4%) | 2.75 |
| Non-family | 222 (35.2%) | 1.23 |
| Total Households | 630 (100.0%) | 2.44 |
Household Size by Marriage Status in Chapin
Out of a total of 630 households in Chapin, 408 (64.8%) are family households, while 222 (35.2%) are nonfamily households. The most numerous type of family households are 3-person households, comprising 153, and the most common type of nonfamily households are 1-person households, comprising 181.
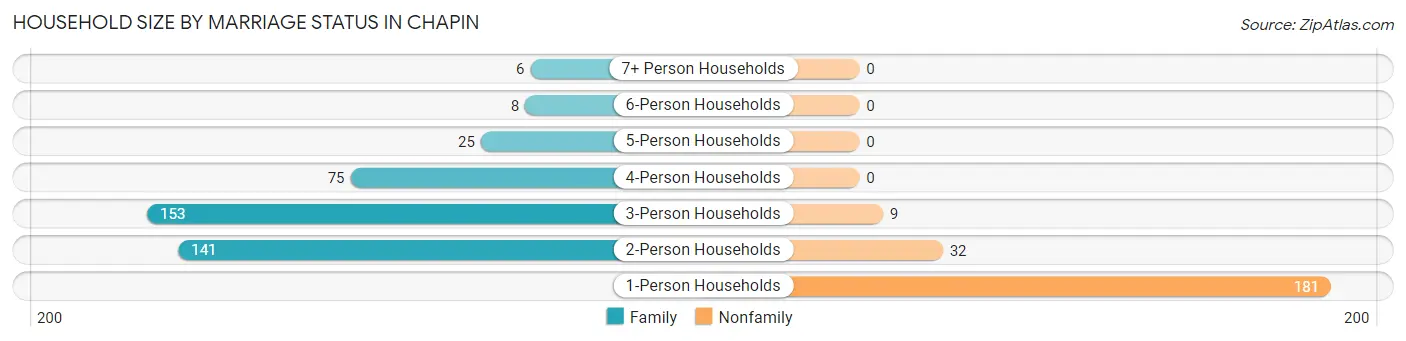
| Household Size | Family Households | Nonfamily Households |
| 1-Person Households | - | 181 (28.7%) |
| 2-Person Households | 141 (22.4%) | 32 (5.1%) |
| 3-Person Households | 153 (24.3%) | 9 (1.4%) |
| 4-Person Households | 75 (11.9%) | 0 (0.0%) |
| 5-Person Households | 25 (4.0%) | 0 (0.0%) |
| 6-Person Households | 8 (1.3%) | 0 (0.0%) |
| 7+ Person Households | 6 (0.9%) | 0 (0.0%) |
| Total | 408 (64.8%) | 222 (35.2%) |
Female Fertility in Chapin
Fertility by Age in Chapin
Average fertility rate in Chapin is 7.0 births per 1,000 women. Women in the age bracket of 20 to 34 years have the highest fertility rate with 22.0 births per 1,000 women. Women in the age bracket of 20 to 34 years acount for 100.0% of all women with births.
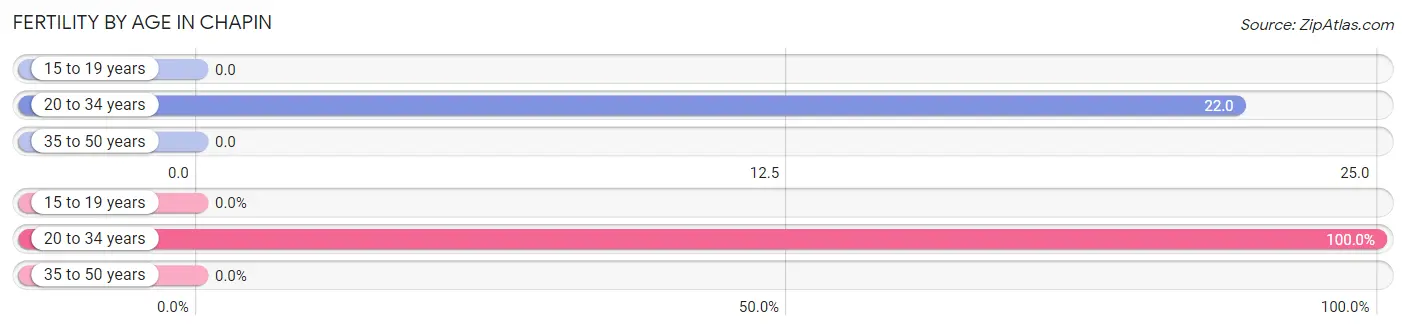
| Age Bracket | Women with Births | Births / 1,000 Women |
| 15 to 19 years | 0 (0.0%) | 0.0 |
| 20 to 34 years | 3 (100.0%) | 22.0 |
| 35 to 50 years | 0 (0.0%) | 0.0 |
| Total | 3 (100.0%) | 7.0 |
Fertility by Age by Marriage Status in Chapin
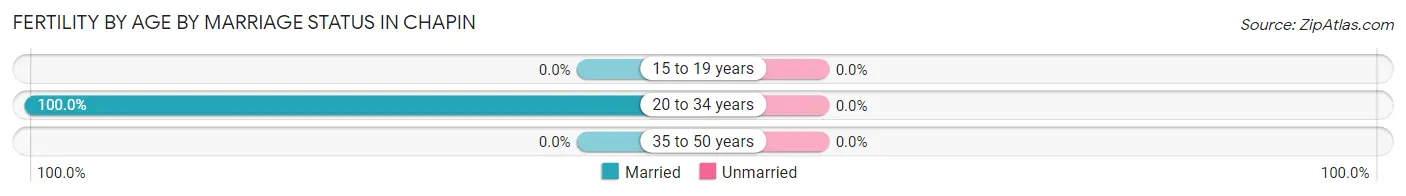
| Age Bracket | Married | Unmarried |
| 15 to 19 years | 0 (0.0%) | 0 (0.0%) |
| 20 to 34 years | 3 (100.0%) | 0 (0.0%) |
| 35 to 50 years | 0 (0.0%) | 0 (0.0%) |
| Total | 3 (100.0%) | 0 (0.0%) |
Fertility by Education in Chapin
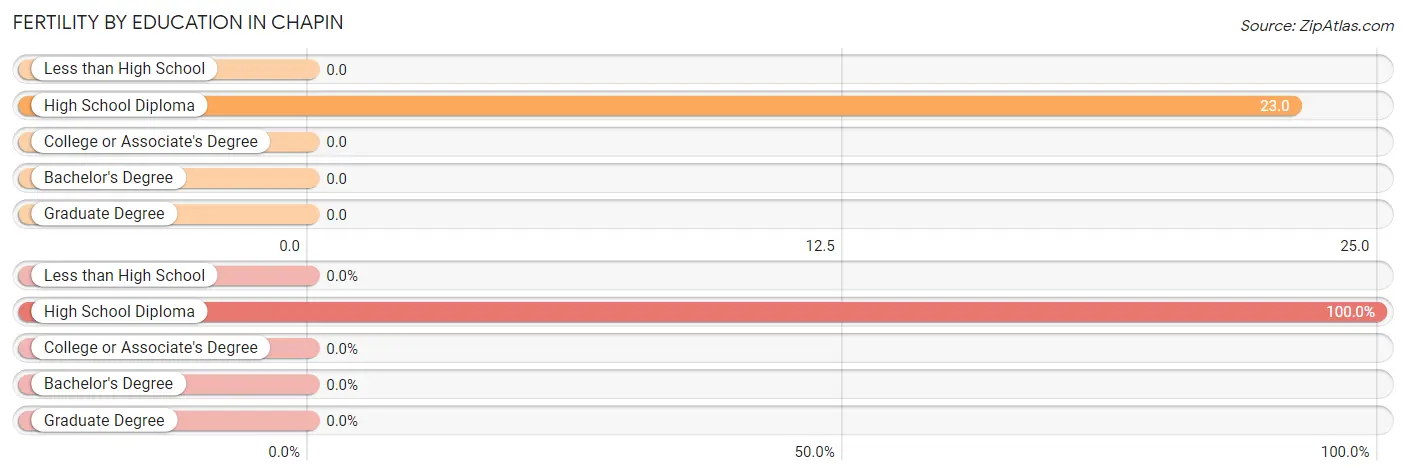
| Educational Attainment | Women with Births | Births / 1,000 Women |
| Less than High School | 0 (0.0%) | 0.0 |
| High School Diploma | 3 (100.0%) | 23.0 |
| College or Associate's Degree | 0 (0.0%) | 0.0 |
| Bachelor's Degree | 0 (0.0%) | 0.0 |
| Graduate Degree | 0 (0.0%) | 0.0 |
| Total | 3 (100.0%) | 7.0 |
Fertility by Education by Marriage Status in Chapin
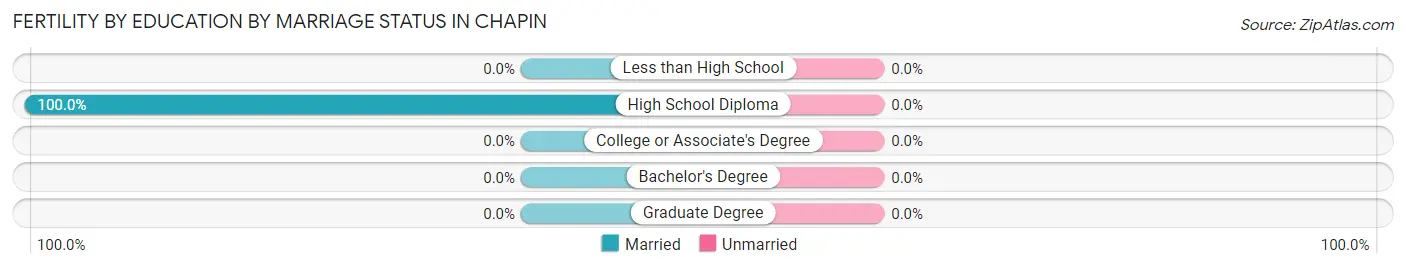
| Educational Attainment | Married | Unmarried |
| Less than High School | 0 (0.0%) | 0 (0.0%) |
| High School Diploma | 3 (100.0%) | 0 (0.0%) |
| College or Associate's Degree | 0 (0.0%) | 0 (0.0%) |
| Bachelor's Degree | 0 (0.0%) | 0 (0.0%) |
| Graduate Degree | 0 (0.0%) | 0 (0.0%) |
| Total | 3 (100.0%) | 0 (0.0%) |
Employment Characteristics in Chapin
Employment by Class of Employer in Chapin
Among the 747 employed individuals in Chapin, private company employees (456 | 61.0%), state government employees (90 | 12.0%), and not-for-profit organizations (52 | 7.0%) make up the most common classes of employment.
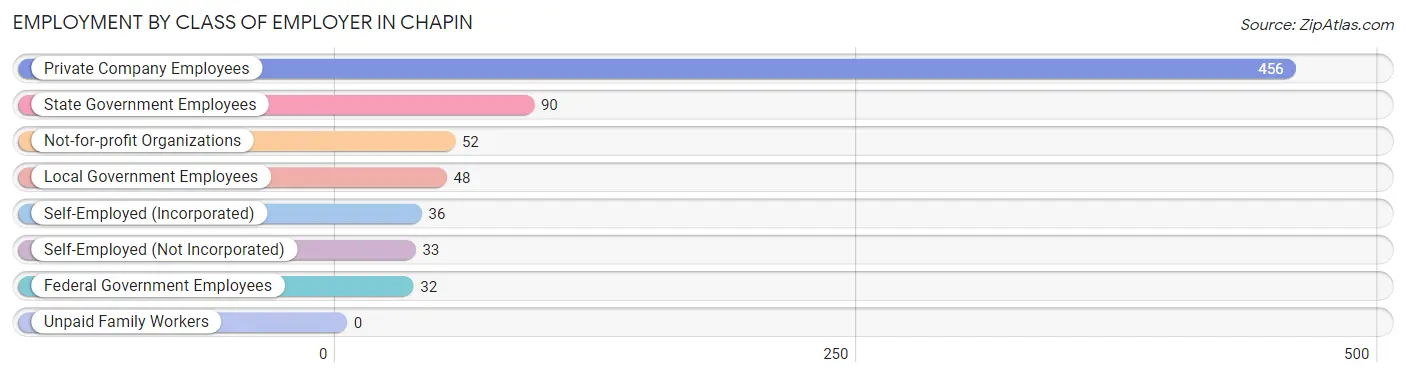
| Employer Class | # Employees | % Employees |
| Private Company Employees | 456 | 61.0% |
| Self-Employed (Incorporated) | 36 | 4.8% |
| Self-Employed (Not Incorporated) | 33 | 4.4% |
| Not-for-profit Organizations | 52 | 7.0% |
| Local Government Employees | 48 | 6.4% |
| State Government Employees | 90 | 12.0% |
| Federal Government Employees | 32 | 4.3% |
| Unpaid Family Workers | 0 | 0.0% |
| Total | 747 | 100.0% |
Employment Status by Age in Chapin
According to the labor force statistics for Chapin, out of the total population over 16 years of age (1,224), 68.6% or 840 individuals are in the labor force, with 9.3% or 78 of them unemployed. The age group with the highest labor force participation rate is 20 to 24 years, with 100.0% or 97 individuals in the labor force. Within the labor force, the 20 to 24 years age range has the highest percentage of unemployed individuals, with 63.9% or 62 of them being unemployed.
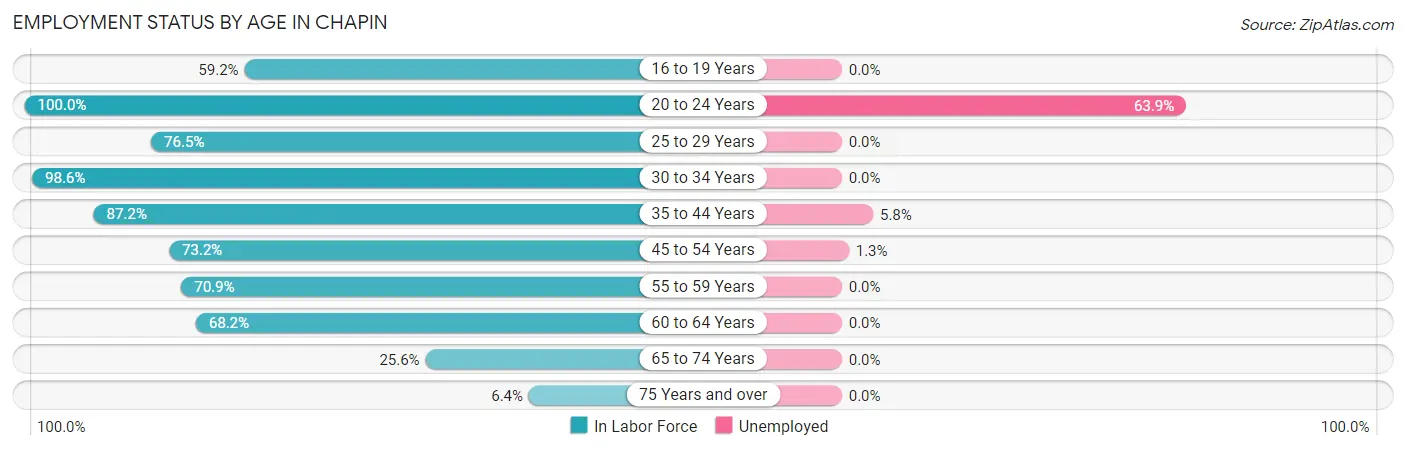
| Age Bracket | In Labor Force | Unemployed |
| 16 to 19 Years | 45 (59.2%) | 0 (0.0%) |
| 20 to 24 Years | 97 (100.0%) | 62 (63.9%) |
| 25 to 29 Years | 62 (76.5%) | 0 (0.0%) |
| 30 to 34 Years | 70 (98.6%) | 0 (0.0%) |
| 35 to 44 Years | 231 (87.2%) | 13 (5.8%) |
| 45 to 54 Years | 156 (73.2%) | 2 (1.3%) |
| 55 to 59 Years | 83 (70.9%) | 0 (0.0%) |
| 60 to 64 Years | 58 (68.2%) | 0 (0.0%) |
| 65 to 74 Years | 32 (25.6%) | 0 (0.0%) |
| 75 Years and over | 6 (6.4%) | 0 (0.0%) |
| Total | 840 (68.6%) | 78 (9.3%) |
Employment Status by Educational Attainment in Chapin
According to labor force statistics for Chapin, 79.3% of individuals (660) out of the total population between 25 and 64 years of age (832) are in the labor force, with 2.3% or 15 of them being unemployed. The group with the highest labor force participation rate are those with the educational attainment of college / associate degree, with 86.1% or 278 individuals in the labor force. Within the labor force, individuals with college / associate degree education have the highest percentage of unemployment, with 3.6% or 10 of them being unemployed.
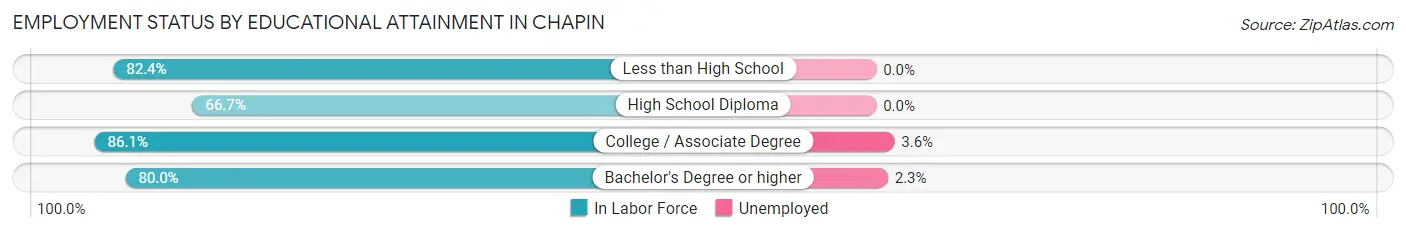
| Educational Attainment | In Labor Force | Unemployed |
| Less than High School | 28 (82.4%) | 0 (0.0%) |
| High School Diploma | 130 (66.7%) | 0 (0.0%) |
| College / Associate Degree | 278 (86.1%) | 12 (3.6%) |
| Bachelor's Degree or higher | 224 (80.0%) | 6 (2.3%) |
| Total | 660 (79.3%) | 19 (2.3%) |
Employment Occupations by Sex in Chapin
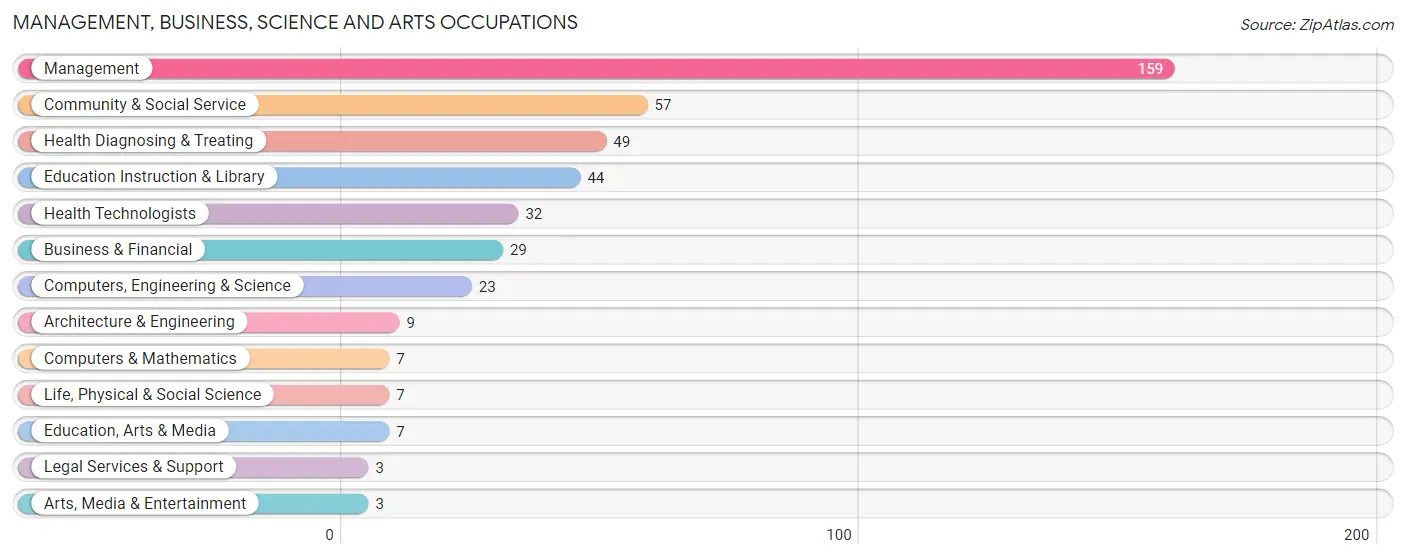
Management, Business, Science and Arts Occupations
The most common Management, Business, Science and Arts occupations in Chapin are Management (159 | 21.1%), Community & Social Service (57 | 7.5%), Health Diagnosing & Treating (49 | 6.5%), Education Instruction & Library (44 | 5.8%), and Health Technologists (32 | 4.2%).
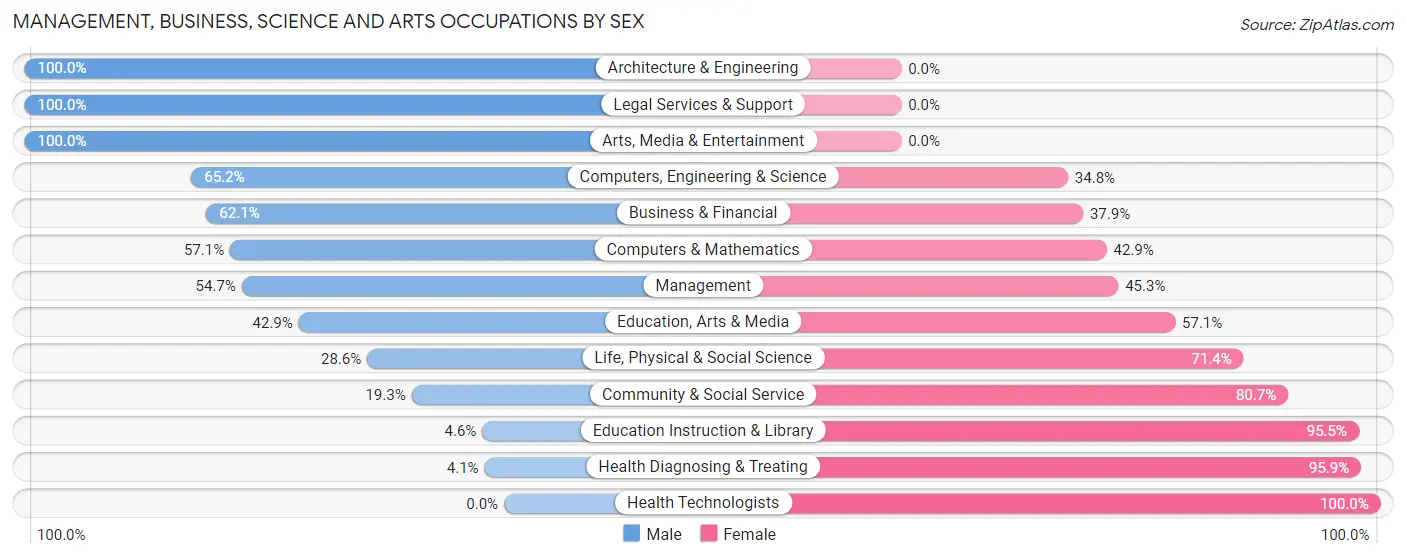
Management, Business, Science and Arts Occupations by Sex
Within the Management, Business, Science and Arts occupations in Chapin, the most male-oriented occupations are Architecture & Engineering (100.0%), Legal Services & Support (100.0%), and Arts, Media & Entertainment (100.0%), while the most female-oriented occupations are Health Technologists (100.0%), Health Diagnosing & Treating (95.9%), and Education Instruction & Library (95.5%).
| Occupation | Male | Female |
| Management | 87 (54.7%) | 72 (45.3%) |
| Business & Financial | 18 (62.1%) | 11 (37.9%) |
| Computers, Engineering & Science | 15 (65.2%) | 8 (34.8%) |
| Computers & Mathematics | 4 (57.1%) | 3 (42.9%) |
| Architecture & Engineering | 9 (100.0%) | 0 (0.0%) |
| Life, Physical & Social Science | 2 (28.6%) | 5 (71.4%) |
| Community & Social Service | 11 (19.3%) | 46 (80.7%) |
| Education, Arts & Media | 3 (42.9%) | 4 (57.1%) |
| Legal Services & Support | 3 (100.0%) | 0 (0.0%) |
| Education Instruction & Library | 2 (4.5%) | 42 (95.5%) |
| Arts, Media & Entertainment | 3 (100.0%) | 0 (0.0%) |
| Health Diagnosing & Treating | 2 (4.1%) | 47 (95.9%) |
| Health Technologists | 0 (0.0%) | 32 (100.0%) |
| Total (Category) | 133 (42.0%) | 184 (58.0%) |
| Total (Overall) | 397 (52.6%) | 358 (47.4%) |
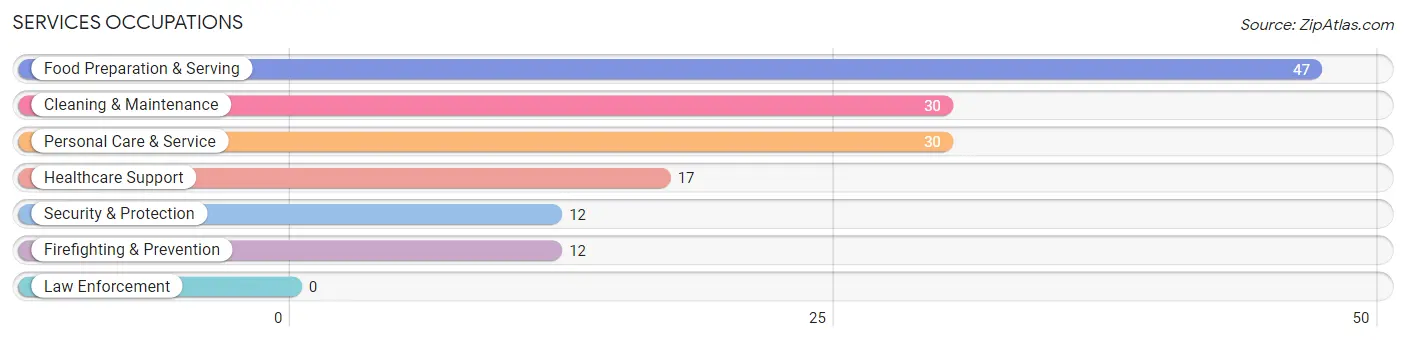
Services Occupations
The most common Services occupations in Chapin are Food Preparation & Serving (47 | 6.2%), Cleaning & Maintenance (30 | 4.0%), Personal Care & Service (30 | 4.0%), Healthcare Support (17 | 2.2%), and Security & Protection (12 | 1.6%).
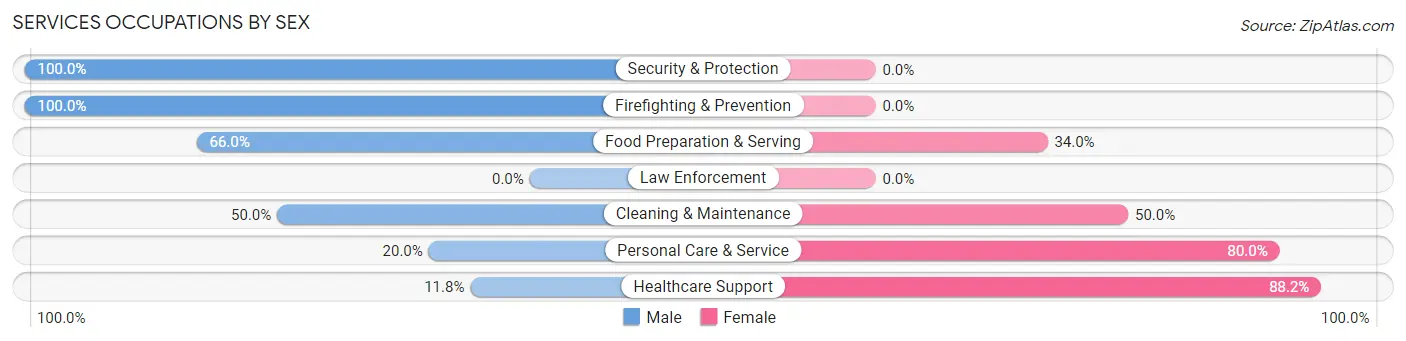
Services Occupations by Sex
Within the Services occupations in Chapin, the most male-oriented occupations are Security & Protection (100.0%), Firefighting & Prevention (100.0%), and Food Preparation & Serving (66.0%), while the most female-oriented occupations are Healthcare Support (88.2%), Personal Care & Service (80.0%), and Cleaning & Maintenance (50.0%).
| Occupation | Male | Female |
| Healthcare Support | 2 (11.8%) | 15 (88.2%) |
| Security & Protection | 12 (100.0%) | 0 (0.0%) |
| Firefighting & Prevention | 12 (100.0%) | 0 (0.0%) |
| Law Enforcement | 0 (0.0%) | 0 (0.0%) |
| Food Preparation & Serving | 31 (66.0%) | 16 (34.0%) |
| Cleaning & Maintenance | 15 (50.0%) | 15 (50.0%) |
| Personal Care & Service | 6 (20.0%) | 24 (80.0%) |
| Total (Category) | 66 (48.5%) | 70 (51.5%) |
| Total (Overall) | 397 (52.6%) | 358 (47.4%) |
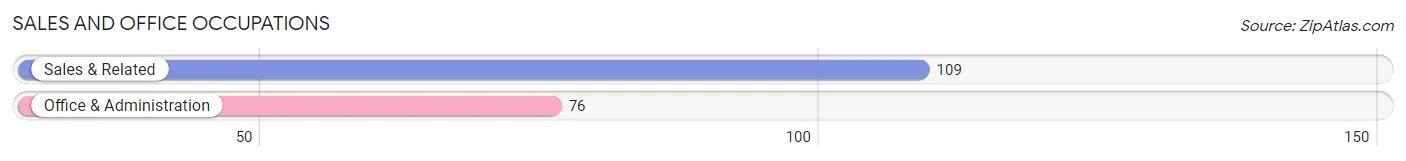
Sales and Office Occupations
The most common Sales and Office occupations in Chapin are Sales & Related (109 | 14.4%), and Office & Administration (76 | 10.1%).
Sales and Office Occupations by Sex
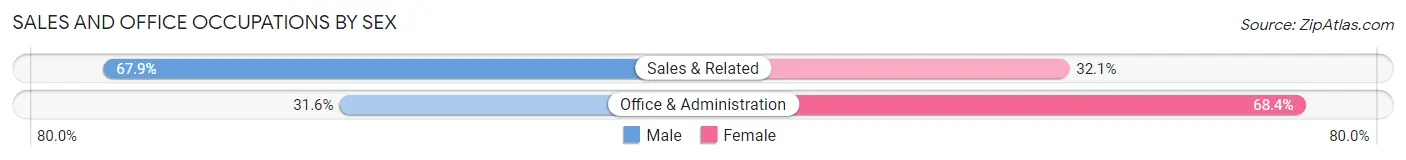
| Occupation | Male | Female |
| Sales & Related | 74 (67.9%) | 35 (32.1%) |
| Office & Administration | 24 (31.6%) | 52 (68.4%) |
| Total (Category) | 98 (53.0%) | 87 (47.0%) |
| Total (Overall) | 397 (52.6%) | 358 (47.4%) |
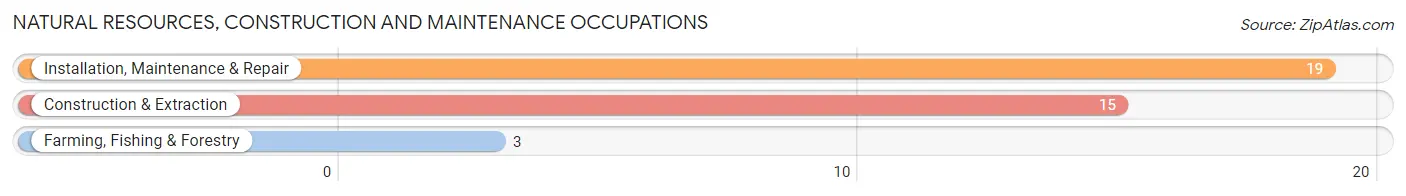
Natural Resources, Construction and Maintenance Occupations
The most common Natural Resources, Construction and Maintenance occupations in Chapin are Installation, Maintenance & Repair (19 | 2.5%), Construction & Extraction (15 | 2.0%), and Farming, Fishing & Forestry (3 | 0.4%).
Natural Resources, Construction and Maintenance Occupations by Sex
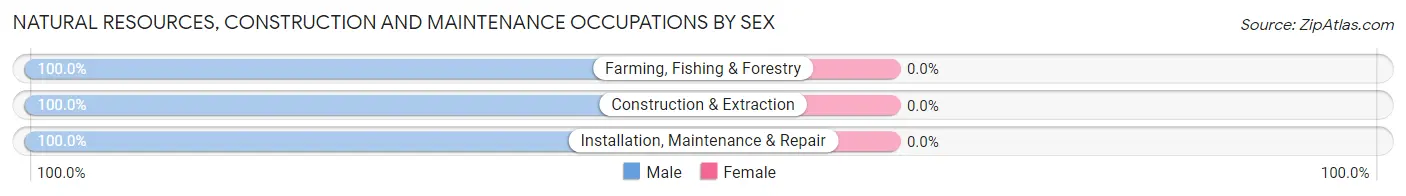
| Occupation | Male | Female |
| Farming, Fishing & Forestry | 3 (100.0%) | 0 (0.0%) |
| Construction & Extraction | 15 (100.0%) | 0 (0.0%) |
| Installation, Maintenance & Repair | 19 (100.0%) | 0 (0.0%) |
| Total (Category) | 37 (100.0%) | 0 (0.0%) |
| Total (Overall) | 397 (52.6%) | 358 (47.4%) |
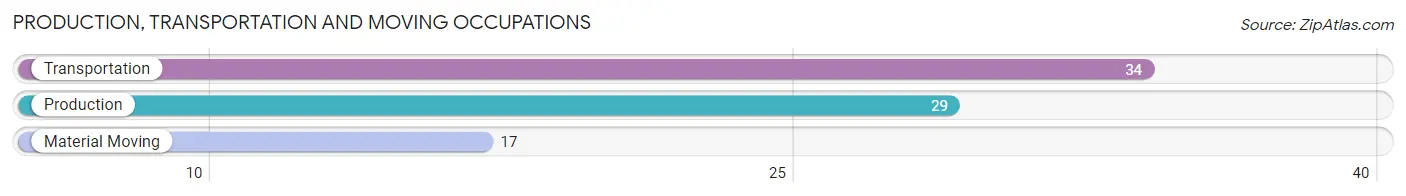
Production, Transportation and Moving Occupations
The most common Production, Transportation and Moving occupations in Chapin are Transportation (34 | 4.5%), Production (29 | 3.8%), and Material Moving (17 | 2.2%).
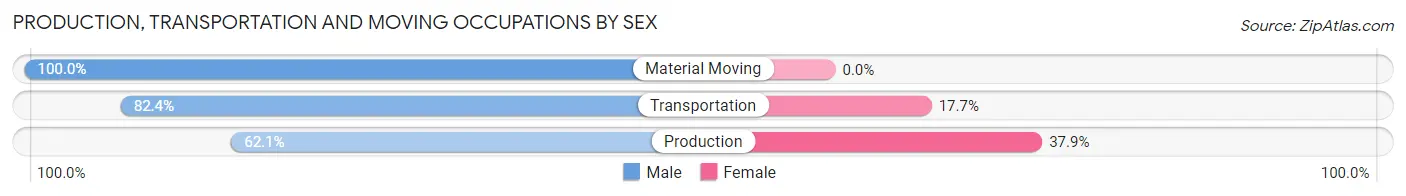
Production, Transportation and Moving Occupations by Sex
| Occupation | Male | Female |
| Production | 18 (62.1%) | 11 (37.9%) |
| Transportation | 28 (82.4%) | 6 (17.6%) |
| Material Moving | 17 (100.0%) | 0 (0.0%) |
| Total (Category) | 63 (78.7%) | 17 (21.2%) |
| Total (Overall) | 397 (52.6%) | 358 (47.4%) |
Employment Industries by Sex in Chapin
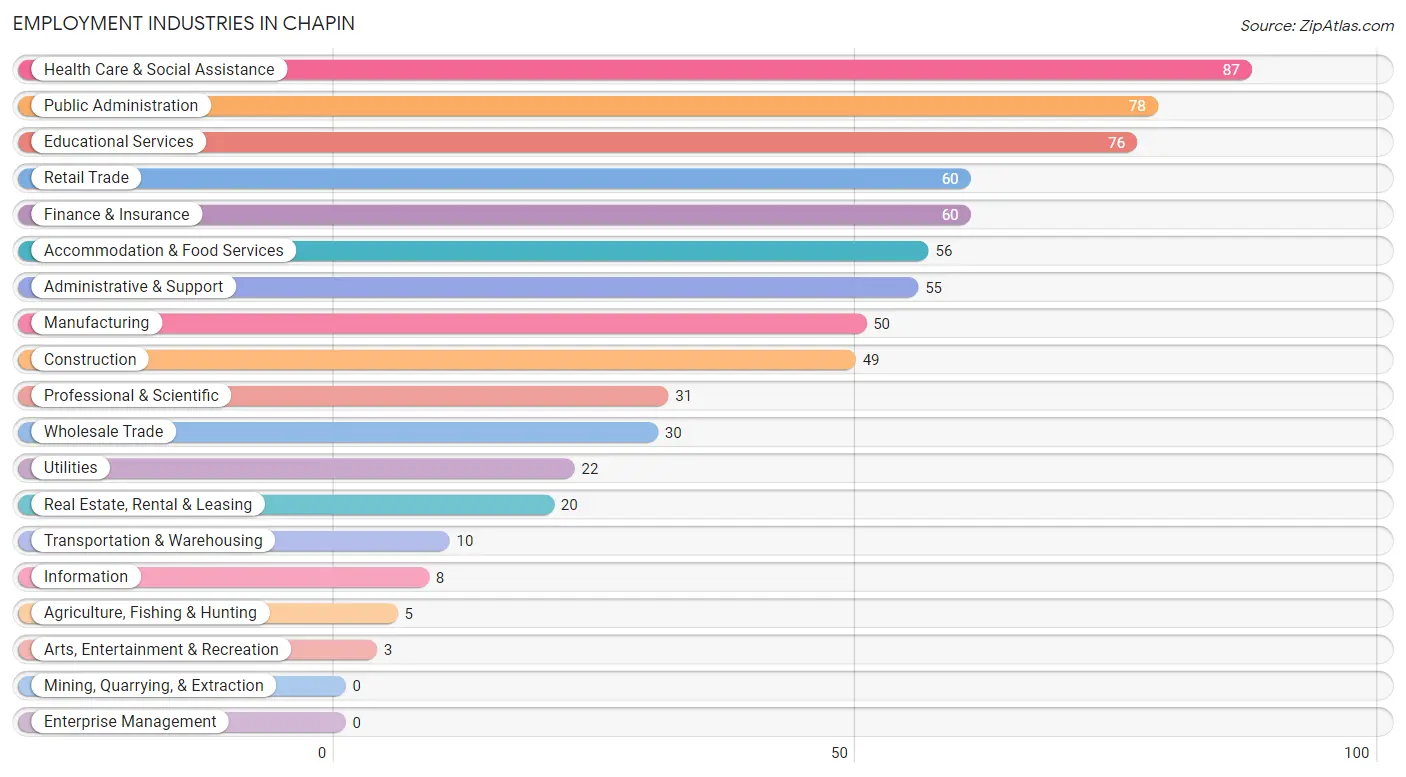
Employment Industries in Chapin
The major employment industries in Chapin include Health Care & Social Assistance (87 | 11.5%), Public Administration (78 | 10.3%), Educational Services (76 | 10.1%), Retail Trade (60 | 8.0%), and Finance & Insurance (60 | 8.0%).
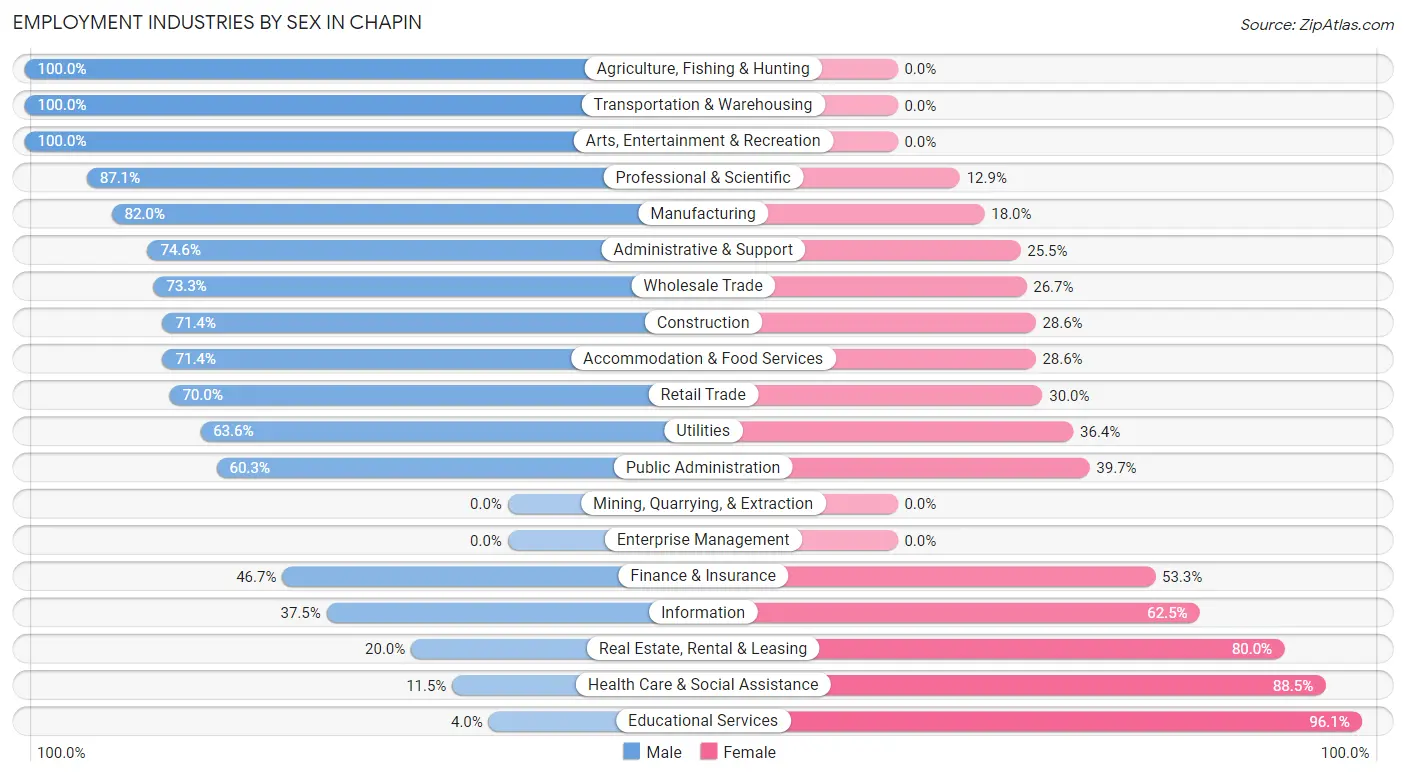
Employment Industries by Sex in Chapin
The Chapin industries that see more men than women are Agriculture, Fishing & Hunting (100.0%), Transportation & Warehousing (100.0%), and Arts, Entertainment & Recreation (100.0%), whereas the industries that tend to have a higher number of women are Educational Services (96.1%), Health Care & Social Assistance (88.5%), and Real Estate, Rental & Leasing (80.0%).
| Industry | Male | Female |
| Agriculture, Fishing & Hunting | 5 (100.0%) | 0 (0.0%) |
| Mining, Quarrying, & Extraction | 0 (0.0%) | 0 (0.0%) |
| Construction | 35 (71.4%) | 14 (28.6%) |
| Manufacturing | 41 (82.0%) | 9 (18.0%) |
| Wholesale Trade | 22 (73.3%) | 8 (26.7%) |
| Retail Trade | 42 (70.0%) | 18 (30.0%) |
| Transportation & Warehousing | 10 (100.0%) | 0 (0.0%) |
| Utilities | 14 (63.6%) | 8 (36.4%) |
| Information | 3 (37.5%) | 5 (62.5%) |
| Finance & Insurance | 28 (46.7%) | 32 (53.3%) |
| Real Estate, Rental & Leasing | 4 (20.0%) | 16 (80.0%) |
| Professional & Scientific | 27 (87.1%) | 4 (12.9%) |
| Enterprise Management | 0 (0.0%) | 0 (0.0%) |
| Administrative & Support | 41 (74.6%) | 14 (25.5%) |
| Educational Services | 3 (4.0%) | 73 (96.1%) |
| Health Care & Social Assistance | 10 (11.5%) | 77 (88.5%) |
| Arts, Entertainment & Recreation | 3 (100.0%) | 0 (0.0%) |
| Accommodation & Food Services | 40 (71.4%) | 16 (28.6%) |
| Public Administration | 47 (60.3%) | 31 (39.7%) |
| Total | 397 (52.6%) | 358 (47.4%) |
Education in Chapin
School Enrollment in Chapin
The most common levels of schooling among the 376 students in Chapin are elementary school (97 | 25.8%), middle school (78 | 20.7%), and high school (76 | 20.2%).
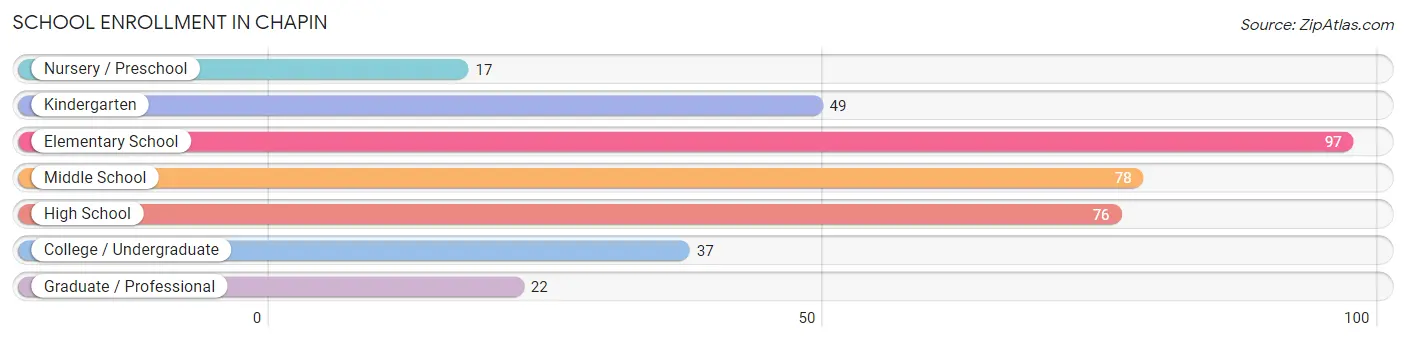
| School Level | # Students | % Students |
| Nursery / Preschool | 17 | 4.5% |
| Kindergarten | 49 | 13.0% |
| Elementary School | 97 | 25.8% |
| Middle School | 78 | 20.7% |
| High School | 76 | 20.2% |
| College / Undergraduate | 37 | 9.8% |
| Graduate / Professional | 22 | 5.9% |
| Total | 376 | 100.0% |
School Enrollment by Age by Funding Source in Chapin
Out of a total of 376 students who are enrolled in schools in Chapin, 38 (10.1%) attend a private institution, while the remaining 338 (89.9%) are enrolled in public schools. The age group of 20 to 24 year olds has the highest likelihood of being enrolled in private schools, with 12 (66.7% in the age bracket) enrolled. Conversely, the age group of 18 to 19 year olds has the lowest likelihood of being enrolled in a private school, with 21 (100.0% in the age bracket) attending a public institution.
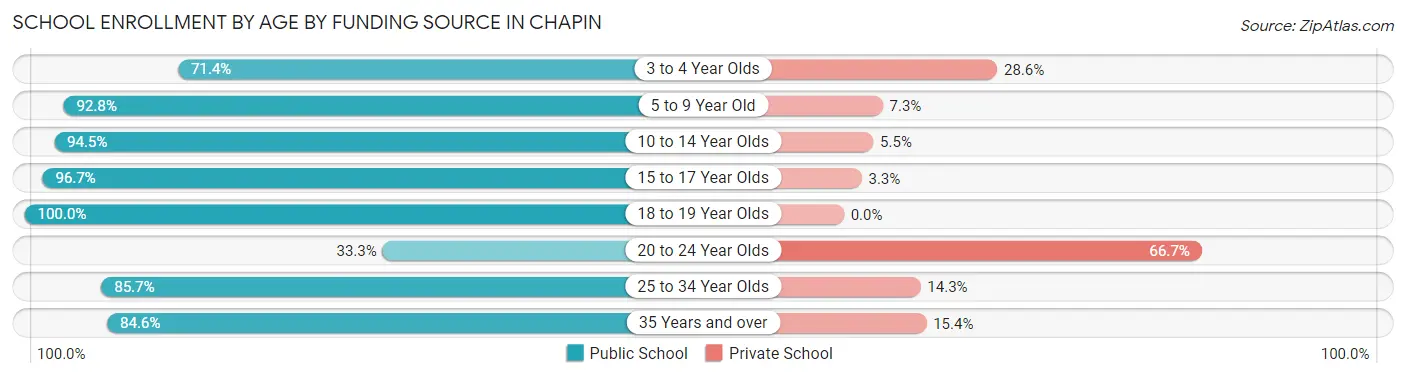
| Age Bracket | Public School | Private School |
| 3 to 4 Year Olds | 10 (71.4%) | 4 (28.6%) |
| 5 to 9 Year Old | 128 (92.7%) | 10 (7.2%) |
| 10 to 14 Year Olds | 86 (94.5%) | 5 (5.5%) |
| 15 to 17 Year Olds | 58 (96.7%) | 2 (3.3%) |
| 18 to 19 Year Olds | 21 (100.0%) | 0 (0.0%) |
| 20 to 24 Year Olds | 6 (33.3%) | 12 (66.7%) |
| 25 to 34 Year Olds | 18 (85.7%) | 3 (14.3%) |
| 35 Years and over | 11 (84.6%) | 2 (15.4%) |
| Total | 338 (89.9%) | 38 (10.1%) |
Educational Attainment by Field of Study in Chapin
Business (75 | 21.4%), education (42 | 12.0%), engineering (35 | 10.0%), arts & humanities (33 | 9.4%), and bio, nature & agricultural (27 | 7.7%) are the most common fields of study among 350 individuals in Chapin who have obtained a bachelor's degree or higher.
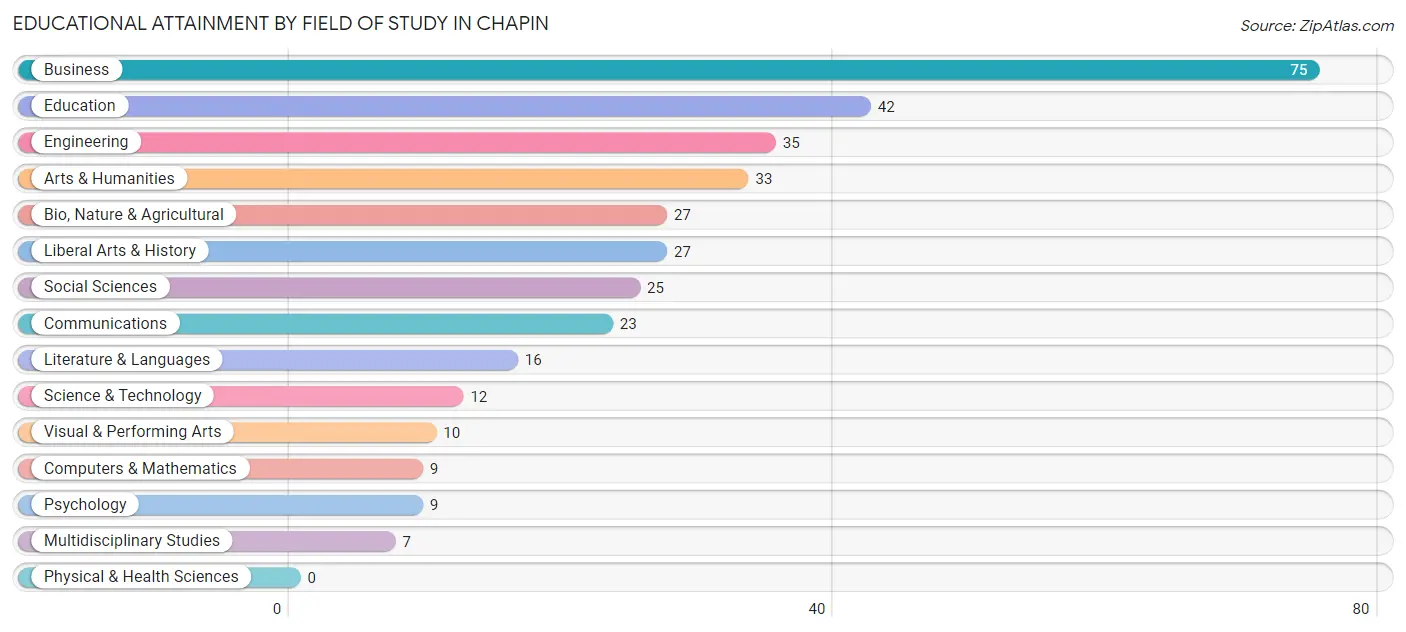
| Field of Study | # Graduates | % Graduates |
| Computers & Mathematics | 9 | 2.6% |
| Bio, Nature & Agricultural | 27 | 7.7% |
| Physical & Health Sciences | 0 | 0.0% |
| Psychology | 9 | 2.6% |
| Social Sciences | 25 | 7.1% |
| Engineering | 35 | 10.0% |
| Multidisciplinary Studies | 7 | 2.0% |
| Science & Technology | 12 | 3.4% |
| Business | 75 | 21.4% |
| Education | 42 | 12.0% |
| Literature & Languages | 16 | 4.6% |
| Liberal Arts & History | 27 | 7.7% |
| Visual & Performing Arts | 10 | 2.9% |
| Communications | 23 | 6.6% |
| Arts & Humanities | 33 | 9.4% |
| Total | 350 | 100.0% |
Transportation & Commute in Chapin
Vehicle Availability by Sex in Chapin
The most prevalent vehicle ownership categories in Chapin are males with 2 vehicles (180, accounting for 46.3%) and females with 2 vehicles (146, making up 50.6%).
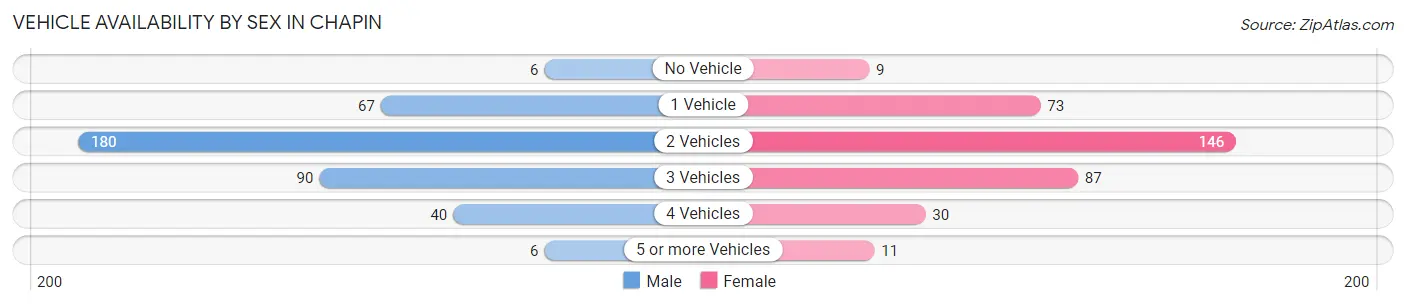
| Vehicles Available | Male | Female |
| No Vehicle | 6 (1.5%) | 9 (2.5%) |
| 1 Vehicle | 67 (17.2%) | 73 (20.5%) |
| 2 Vehicles | 180 (46.3%) | 146 (41.0%) |
| 3 Vehicles | 90 (23.1%) | 87 (24.4%) |
| 4 Vehicles | 40 (10.3%) | 30 (8.4%) |
| 5 or more Vehicles | 6 (1.5%) | 11 (3.1%) |
| Total | 389 (100.0%) | 356 (100.0%) |
Commute Time in Chapin
The most frequently occuring commute durations in Chapin are 20 to 24 minutes (125 commuters, 18.0%), 30 to 34 minutes (117 commuters, 16.8%), and 15 to 19 minutes (68 commuters, 9.8%).
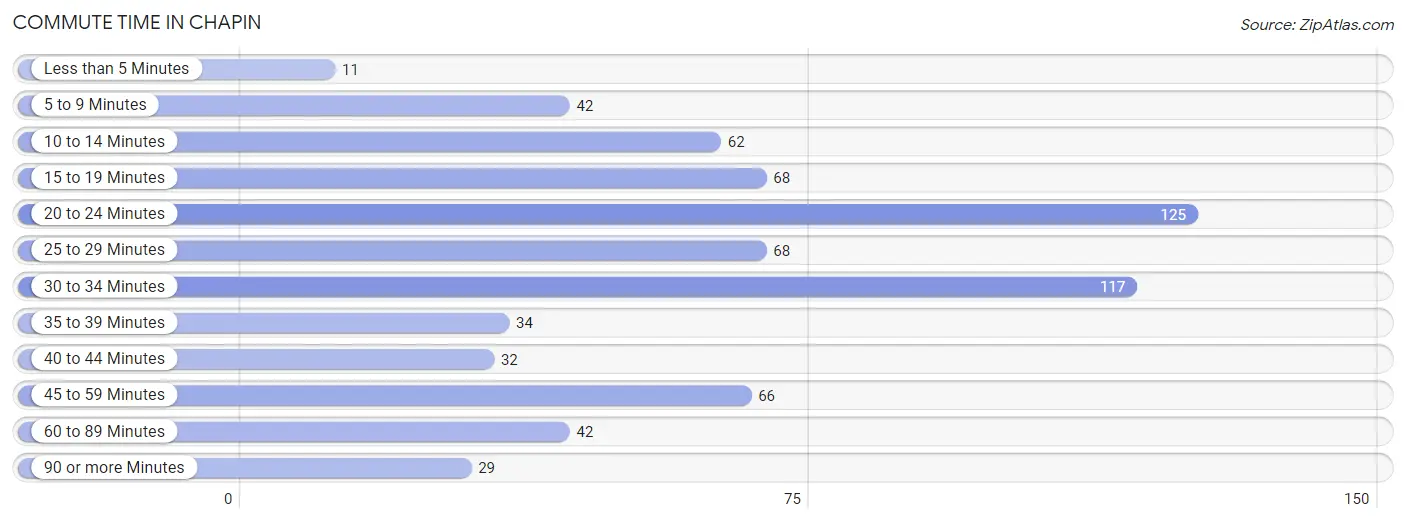
| Commute Time | # Commuters | % Commuters |
| Less than 5 Minutes | 11 | 1.6% |
| 5 to 9 Minutes | 42 | 6.0% |
| 10 to 14 Minutes | 62 | 8.9% |
| 15 to 19 Minutes | 68 | 9.8% |
| 20 to 24 Minutes | 125 | 18.0% |
| 25 to 29 Minutes | 68 | 9.8% |
| 30 to 34 Minutes | 117 | 16.8% |
| 35 to 39 Minutes | 34 | 4.9% |
| 40 to 44 Minutes | 32 | 4.6% |
| 45 to 59 Minutes | 66 | 9.5% |
| 60 to 89 Minutes | 42 | 6.0% |
| 90 or more Minutes | 29 | 4.2% |
Commute Time by Sex in Chapin
The most common commute times in Chapin are 20 to 24 minutes (78 commuters, 22.5%) for males and 30 to 34 minutes (54 commuters, 15.4%) for females.
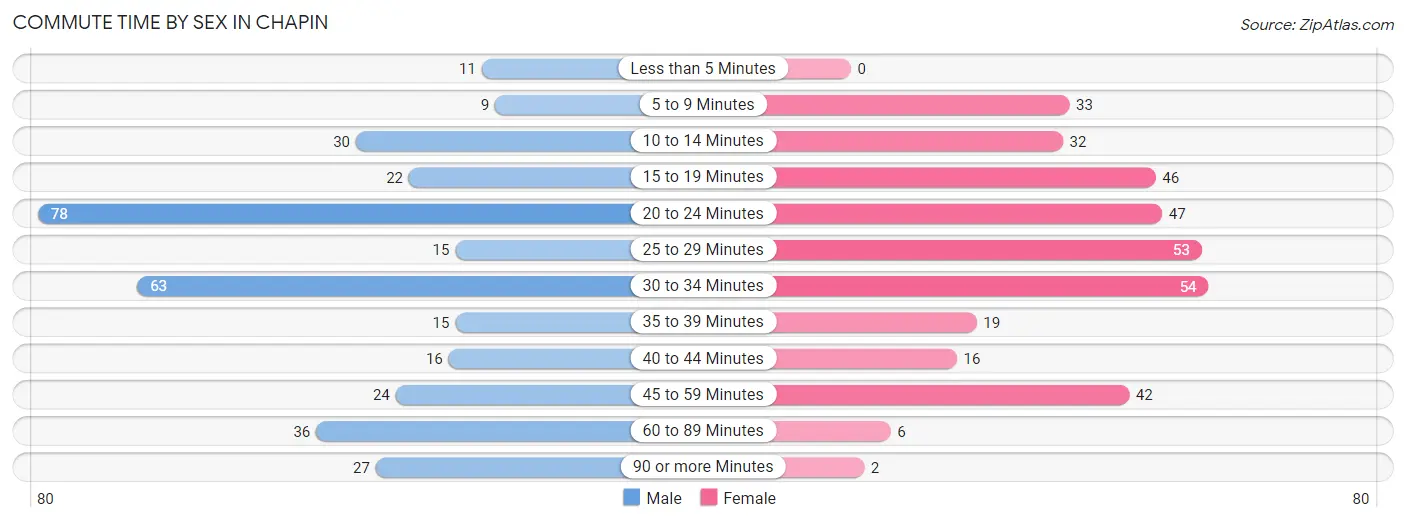
| Commute Time | Male | Female |
| Less than 5 Minutes | 11 (3.2%) | 0 (0.0%) |
| 5 to 9 Minutes | 9 (2.6%) | 33 (9.4%) |
| 10 to 14 Minutes | 30 (8.7%) | 32 (9.1%) |
| 15 to 19 Minutes | 22 (6.4%) | 46 (13.1%) |
| 20 to 24 Minutes | 78 (22.5%) | 47 (13.4%) |
| 25 to 29 Minutes | 15 (4.3%) | 53 (15.1%) |
| 30 to 34 Minutes | 63 (18.2%) | 54 (15.4%) |
| 35 to 39 Minutes | 15 (4.3%) | 19 (5.4%) |
| 40 to 44 Minutes | 16 (4.6%) | 16 (4.6%) |
| 45 to 59 Minutes | 24 (6.9%) | 42 (12.0%) |
| 60 to 89 Minutes | 36 (10.4%) | 6 (1.7%) |
| 90 or more Minutes | 27 (7.8%) | 2 (0.6%) |
Time of Departure to Work by Sex in Chapin
The most frequent times of departure to work in Chapin are 7:00 AM to 7:29 AM (79, 22.8%) for males and 7:00 AM to 7:29 AM (100, 28.6%) for females.
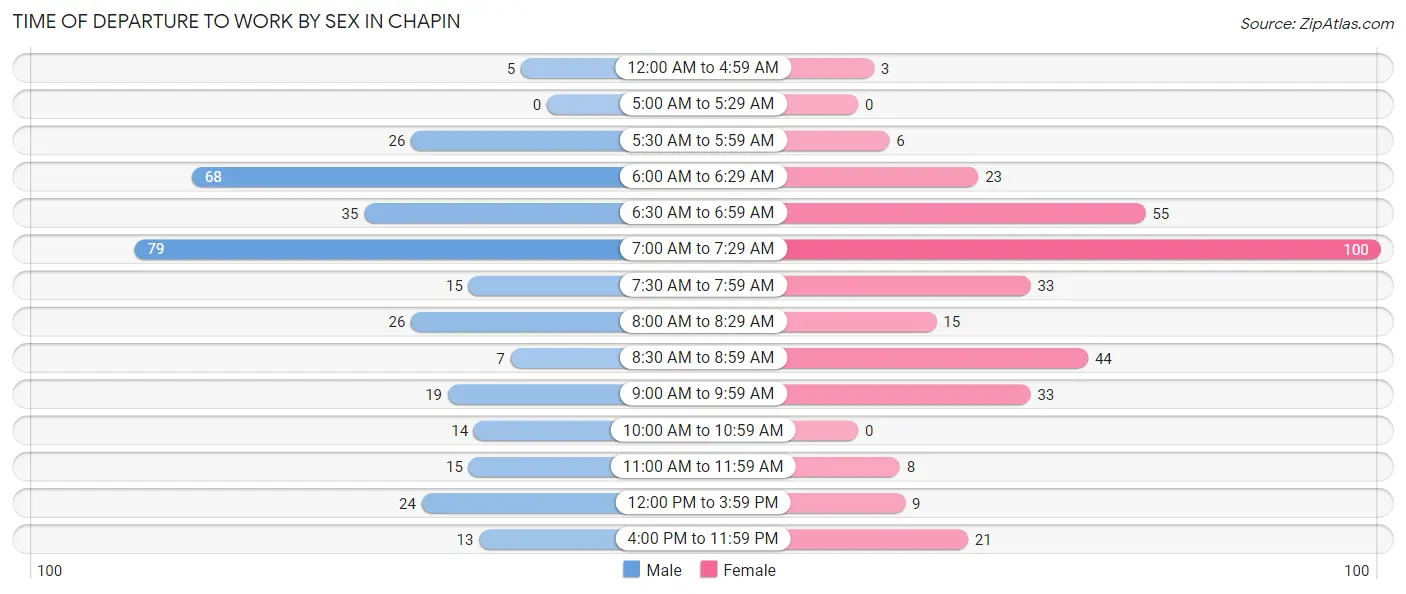
| Time of Departure | Male | Female |
| 12:00 AM to 4:59 AM | 5 (1.5%) | 3 (0.9%) |
| 5:00 AM to 5:29 AM | 0 (0.0%) | 0 (0.0%) |
| 5:30 AM to 5:59 AM | 26 (7.5%) | 6 (1.7%) |
| 6:00 AM to 6:29 AM | 68 (19.7%) | 23 (6.6%) |
| 6:30 AM to 6:59 AM | 35 (10.1%) | 55 (15.7%) |
| 7:00 AM to 7:29 AM | 79 (22.8%) | 100 (28.6%) |
| 7:30 AM to 7:59 AM | 15 (4.3%) | 33 (9.4%) |
| 8:00 AM to 8:29 AM | 26 (7.5%) | 15 (4.3%) |
| 8:30 AM to 8:59 AM | 7 (2.0%) | 44 (12.6%) |
| 9:00 AM to 9:59 AM | 19 (5.5%) | 33 (9.4%) |
| 10:00 AM to 10:59 AM | 14 (4.1%) | 0 (0.0%) |
| 11:00 AM to 11:59 AM | 15 (4.3%) | 8 (2.3%) |
| 12:00 PM to 3:59 PM | 24 (6.9%) | 9 (2.6%) |
| 4:00 PM to 11:59 PM | 13 (3.8%) | 21 (6.0%) |
| Total | 346 (100.0%) | 350 (100.0%) |
Housing Occupancy in Chapin
Occupancy by Ownership in Chapin
Of the total 630 dwellings in Chapin, owner-occupied units account for 520 (82.5%), while renter-occupied units make up 110 (17.5%).
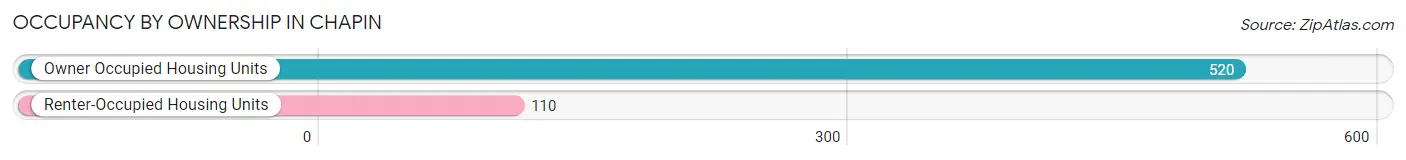
| Occupancy | # Housing Units | % Housing Units |
| Owner Occupied Housing Units | 520 | 82.5% |
| Renter-Occupied Housing Units | 110 | 17.5% |
| Total Occupied Housing Units | 630 | 100.0% |
Occupancy by Household Size in Chapin
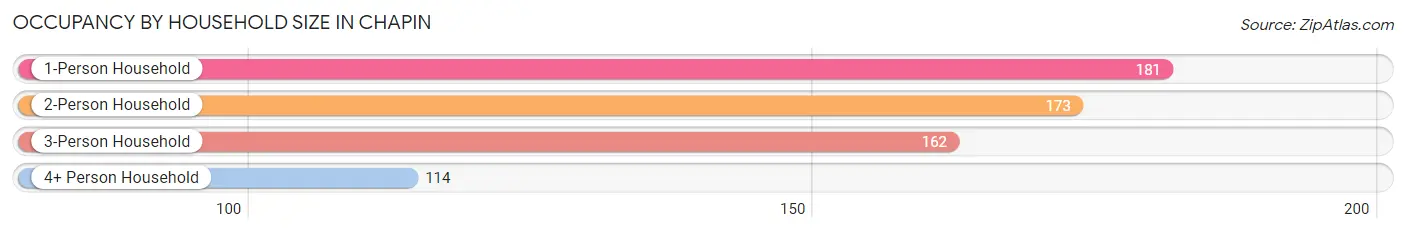
| Household Size | # Housing Units | % Housing Units |
| 1-Person Household | 181 | 28.7% |
| 2-Person Household | 173 | 27.5% |
| 3-Person Household | 162 | 25.7% |
| 4+ Person Household | 114 | 18.1% |
| Total Housing Units | 630 | 100.0% |
Occupancy by Ownership by Household Size in Chapin
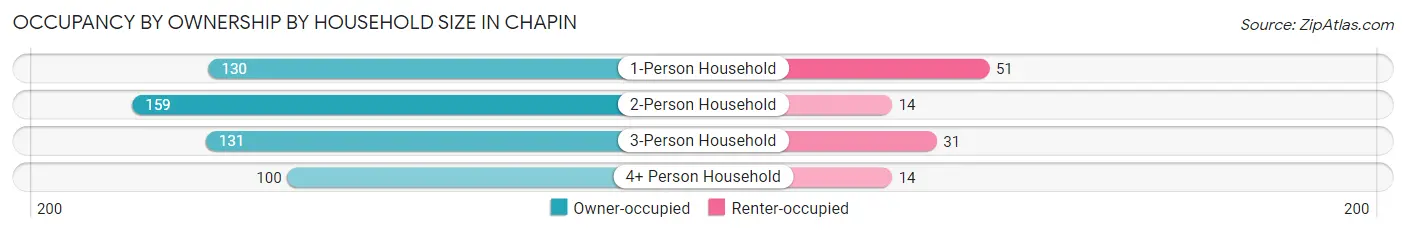
| Household Size | Owner-occupied | Renter-occupied |
| 1-Person Household | 130 (71.8%) | 51 (28.2%) |
| 2-Person Household | 159 (91.9%) | 14 (8.1%) |
| 3-Person Household | 131 (80.9%) | 31 (19.1%) |
| 4+ Person Household | 100 (87.7%) | 14 (12.3%) |
| Total Housing Units | 520 (82.5%) | 110 (17.5%) |
Occupancy by Educational Attainment in Chapin
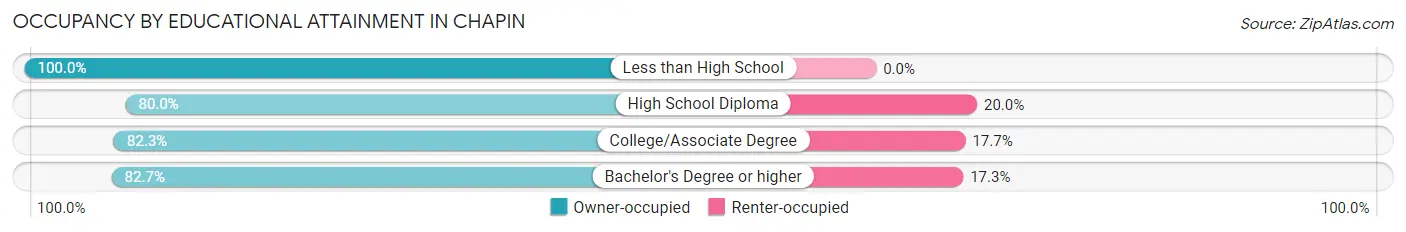
| Household Size | Owner-occupied | Renter-occupied |
| Less than High School | 18 (100.0%) | 0 (0.0%) |
| High School Diploma | 92 (80.0%) | 23 (20.0%) |
| College/Associate Degree | 223 (82.3%) | 48 (17.7%) |
| Bachelor's Degree or higher | 187 (82.7%) | 39 (17.3%) |
Occupancy by Age of Householder in Chapin
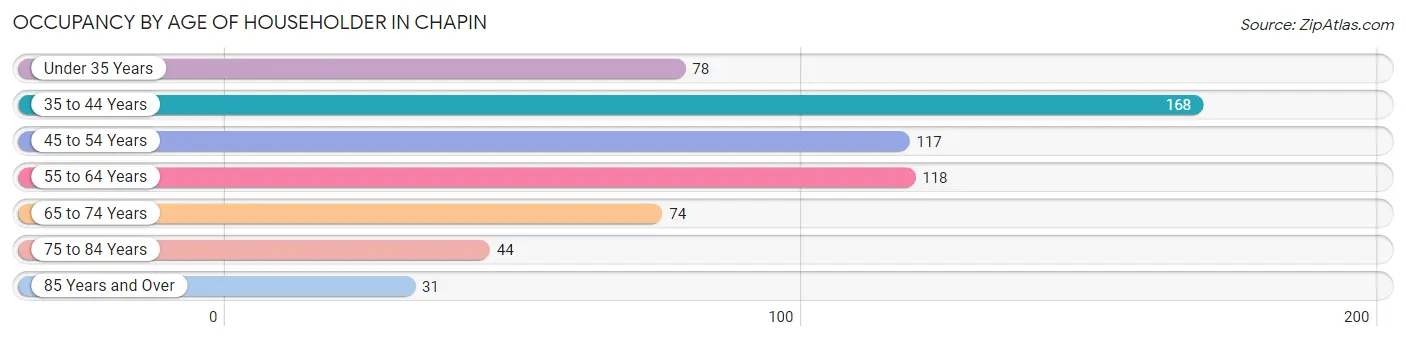
| Age Bracket | # Households | % Households |
| Under 35 Years | 78 | 12.4% |
| 35 to 44 Years | 168 | 26.7% |
| 45 to 54 Years | 117 | 18.6% |
| 55 to 64 Years | 118 | 18.7% |
| 65 to 74 Years | 74 | 11.7% |
| 75 to 84 Years | 44 | 7.0% |
| 85 Years and Over | 31 | 4.9% |
| Total | 630 | 100.0% |
Housing Finances in Chapin
Median Income by Occupancy in Chapin

| Occupancy Type | # Households | Median Income |
| Owner-Occupied | 520 (82.5%) | $83,103 |
| Renter-Occupied | 110 (17.5%) | $57,727 |
| Average | 630 (100.0%) | $77,917 |
Occupancy by Householder Income Bracket in Chapin
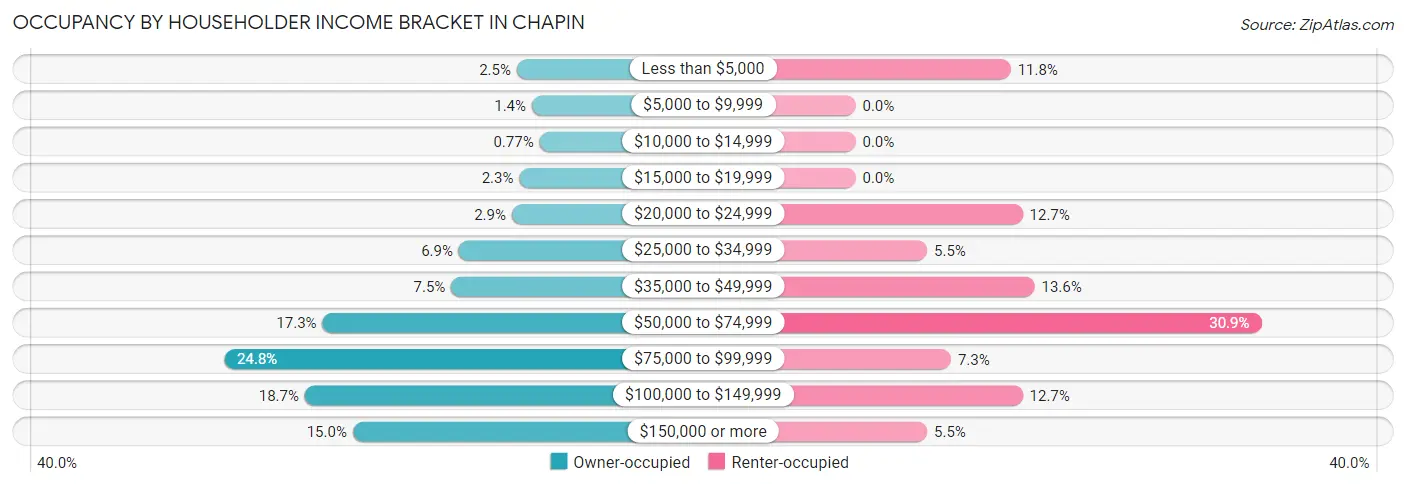
| Income Bracket | Owner-occupied | Renter-occupied |
| Less than $5,000 | 13 (2.5%) | 13 (11.8%) |
| $5,000 to $9,999 | 7 (1.3%) | 0 (0.0%) |
| $10,000 to $14,999 | 4 (0.8%) | 0 (0.0%) |
| $15,000 to $19,999 | 12 (2.3%) | 0 (0.0%) |
| $20,000 to $24,999 | 15 (2.9%) | 14 (12.7%) |
| $25,000 to $34,999 | 36 (6.9%) | 6 (5.4%) |
| $35,000 to $49,999 | 39 (7.5%) | 15 (13.6%) |
| $50,000 to $74,999 | 90 (17.3%) | 34 (30.9%) |
| $75,000 to $99,999 | 129 (24.8%) | 8 (7.3%) |
| $100,000 to $149,999 | 97 (18.6%) | 14 (12.7%) |
| $150,000 or more | 78 (15.0%) | 6 (5.4%) |
| Total | 520 (100.0%) | 110 (100.0%) |
Monthly Housing Cost Tiers in Chapin
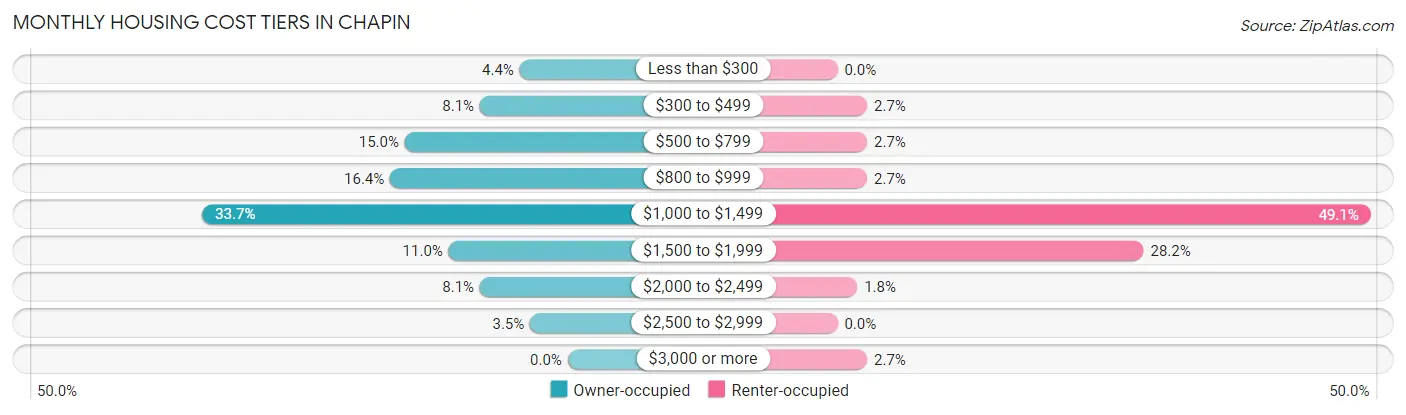
| Monthly Cost | Owner-occupied | Renter-occupied |
| Less than $300 | 23 (4.4%) | 0 (0.0%) |
| $300 to $499 | 42 (8.1%) | 3 (2.7%) |
| $500 to $799 | 78 (15.0%) | 3 (2.7%) |
| $800 to $999 | 85 (16.4%) | 3 (2.7%) |
| $1,000 to $1,499 | 175 (33.7%) | 54 (49.1%) |
| $1,500 to $1,999 | 57 (11.0%) | 31 (28.2%) |
| $2,000 to $2,499 | 42 (8.1%) | 2 (1.8%) |
| $2,500 to $2,999 | 18 (3.5%) | 0 (0.0%) |
| $3,000 or more | 0 (0.0%) | 3 (2.7%) |
| Total | 520 (100.0%) | 110 (100.0%) |
Physical Housing Characteristics in Chapin
Housing Structures in Chapin
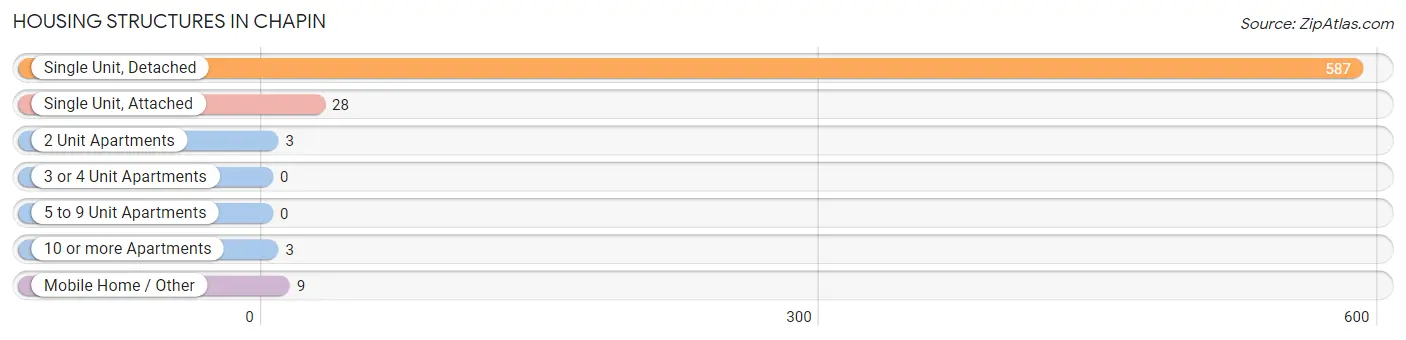
| Structure Type | # Housing Units | % Housing Units |
| Single Unit, Detached | 587 | 93.2% |
| Single Unit, Attached | 28 | 4.4% |
| 2 Unit Apartments | 3 | 0.5% |
| 3 or 4 Unit Apartments | 0 | 0.0% |
| 5 to 9 Unit Apartments | 0 | 0.0% |
| 10 or more Apartments | 3 | 0.5% |
| Mobile Home / Other | 9 | 1.4% |
| Total | 630 | 100.0% |
Housing Structures by Occupancy in Chapin
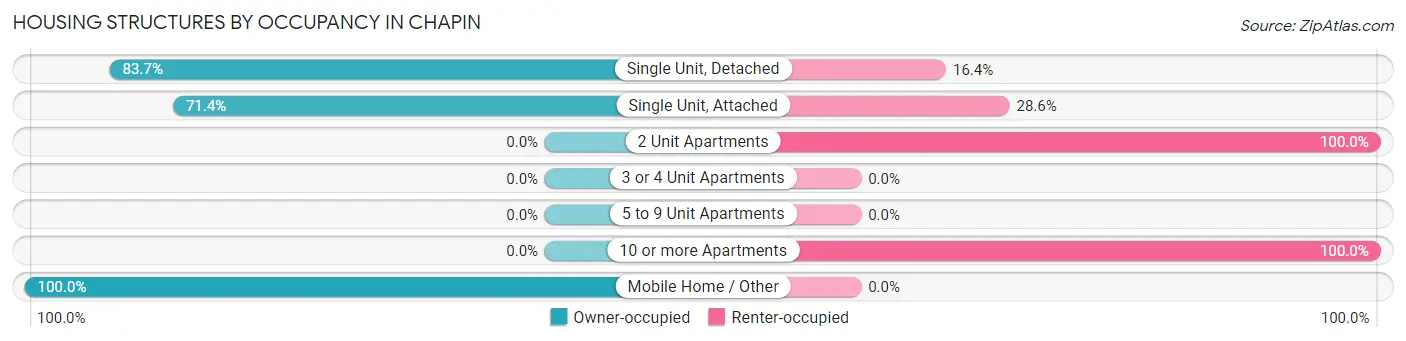
| Structure Type | Owner-occupied | Renter-occupied |
| Single Unit, Detached | 491 (83.7%) | 96 (16.4%) |
| Single Unit, Attached | 20 (71.4%) | 8 (28.6%) |
| 2 Unit Apartments | 0 (0.0%) | 3 (100.0%) |
| 3 or 4 Unit Apartments | 0 (0.0%) | 0 (0.0%) |
| 5 to 9 Unit Apartments | 0 (0.0%) | 0 (0.0%) |
| 10 or more Apartments | 0 (0.0%) | 3 (100.0%) |
| Mobile Home / Other | 9 (100.0%) | 0 (0.0%) |
| Total | 520 (82.5%) | 110 (17.5%) |
Housing Structures by Number of Rooms in Chapin
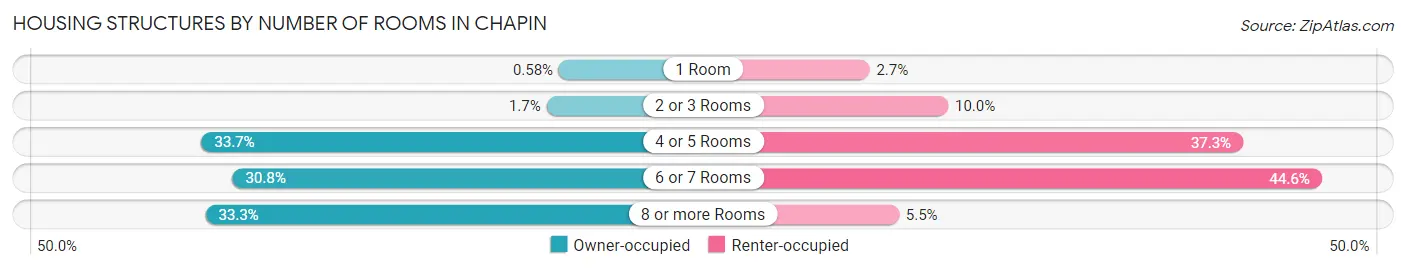
| Number of Rooms | Owner-occupied | Renter-occupied |
| 1 Room | 3 (0.6%) | 3 (2.7%) |
| 2 or 3 Rooms | 9 (1.7%) | 11 (10.0%) |
| 4 or 5 Rooms | 175 (33.7%) | 41 (37.3%) |
| 6 or 7 Rooms | 160 (30.8%) | 49 (44.6%) |
| 8 or more Rooms | 173 (33.3%) | 6 (5.4%) |
| Total | 520 (100.0%) | 110 (100.0%) |
Housing Structure by Heating Type in Chapin
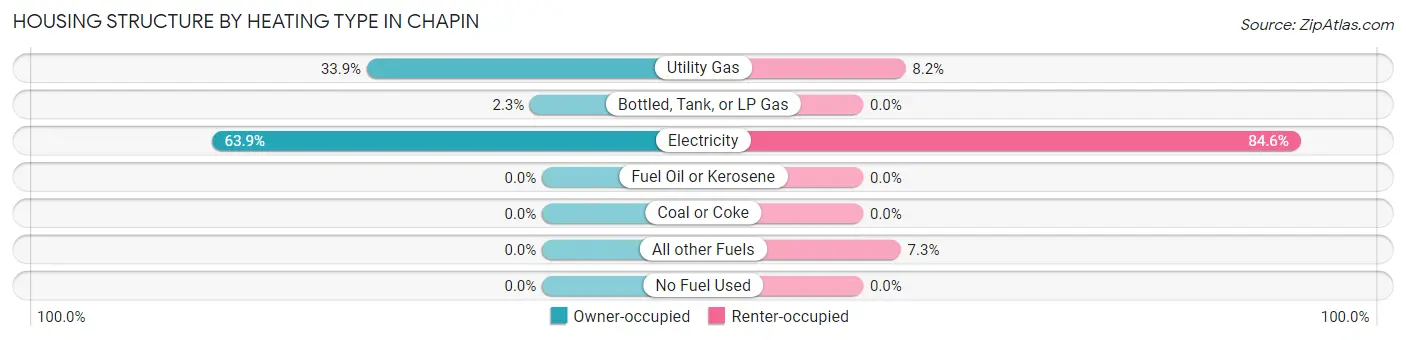
| Heating Type | Owner-occupied | Renter-occupied |
| Utility Gas | 176 (33.9%) | 9 (8.2%) |
| Bottled, Tank, or LP Gas | 12 (2.3%) | 0 (0.0%) |
| Electricity | 332 (63.8%) | 93 (84.6%) |
| Fuel Oil or Kerosene | 0 (0.0%) | 0 (0.0%) |
| Coal or Coke | 0 (0.0%) | 0 (0.0%) |
| All other Fuels | 0 (0.0%) | 8 (7.3%) |
| No Fuel Used | 0 (0.0%) | 0 (0.0%) |
| Total | 520 (100.0%) | 110 (100.0%) |
Household Vehicle Usage in Chapin
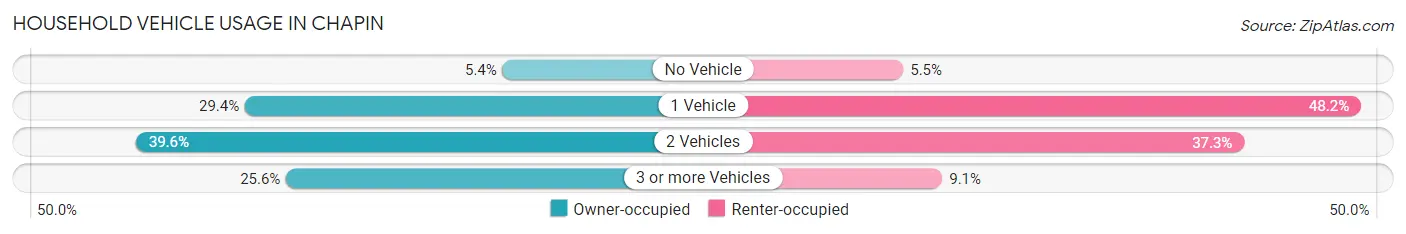
| Vehicles per Household | Owner-occupied | Renter-occupied |
| No Vehicle | 28 (5.4%) | 6 (5.4%) |
| 1 Vehicle | 153 (29.4%) | 53 (48.2%) |
| 2 Vehicles | 206 (39.6%) | 41 (37.3%) |
| 3 or more Vehicles | 133 (25.6%) | 10 (9.1%) |
| Total | 520 (100.0%) | 110 (100.0%) |
Real Estate & Mortgages in Chapin
Real Estate and Mortgage Overview in Chapin
| Characteristic | Without Mortgage | With Mortgage |
| Housing Units | 133 | 387 |
| Median Property Value | $300,900 | $174,600 |
| Median Household Income | $78,438 | $75 |
| Monthly Housing Costs | $510 | $0 |
| Real Estate Taxes | $1,408 | $17 |
Property Value by Mortgage Status in Chapin
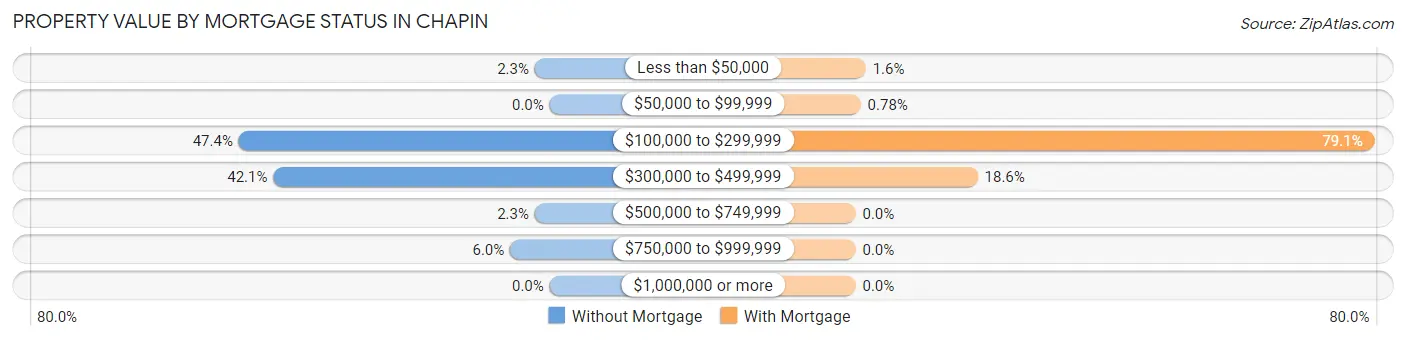
| Property Value | Without Mortgage | With Mortgage |
| Less than $50,000 | 3 (2.3%) | 6 (1.5%) |
| $50,000 to $99,999 | 0 (0.0%) | 3 (0.8%) |
| $100,000 to $299,999 | 63 (47.4%) | 306 (79.1%) |
| $300,000 to $499,999 | 56 (42.1%) | 72 (18.6%) |
| $500,000 to $749,999 | 3 (2.3%) | 0 (0.0%) |
| $750,000 to $999,999 | 8 (6.0%) | 0 (0.0%) |
| $1,000,000 or more | 0 (0.0%) | 0 (0.0%) |
| Total | 133 (100.0%) | 387 (100.0%) |
Household Income by Mortgage Status in Chapin
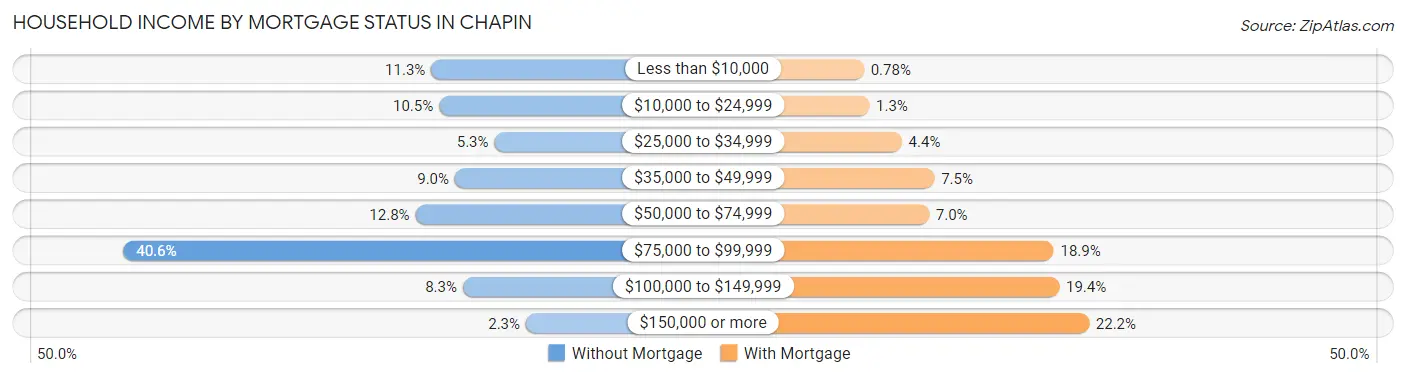
| Household Income | Without Mortgage | With Mortgage |
| Less than $10,000 | 15 (11.3%) | 3 (0.8%) |
| $10,000 to $24,999 | 14 (10.5%) | 5 (1.3%) |
| $25,000 to $34,999 | 7 (5.3%) | 17 (4.4%) |
| $35,000 to $49,999 | 12 (9.0%) | 29 (7.5%) |
| $50,000 to $74,999 | 17 (12.8%) | 27 (7.0%) |
| $75,000 to $99,999 | 54 (40.6%) | 73 (18.9%) |
| $100,000 to $149,999 | 11 (8.3%) | 75 (19.4%) |
| $150,000 or more | 3 (2.3%) | 86 (22.2%) |
| Total | 133 (100.0%) | 387 (100.0%) |
Property Value to Household Income Ratio in Chapin
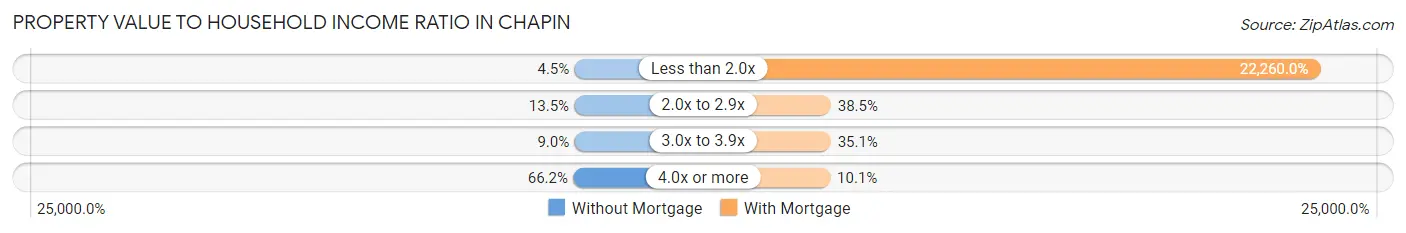
| Value-to-Income Ratio | Without Mortgage | With Mortgage |
| Less than 2.0x | 6 (4.5%) | 86,146 (22,260.0%) |
| 2.0x to 2.9x | 18 (13.5%) | 149 (38.5%) |
| 3.0x to 3.9x | 12 (9.0%) | 136 (35.1%) |
| 4.0x or more | 88 (66.2%) | 39 (10.1%) |
| Total | 133 (100.0%) | 387 (100.0%) |
Real Estate Taxes by Mortgage Status in Chapin
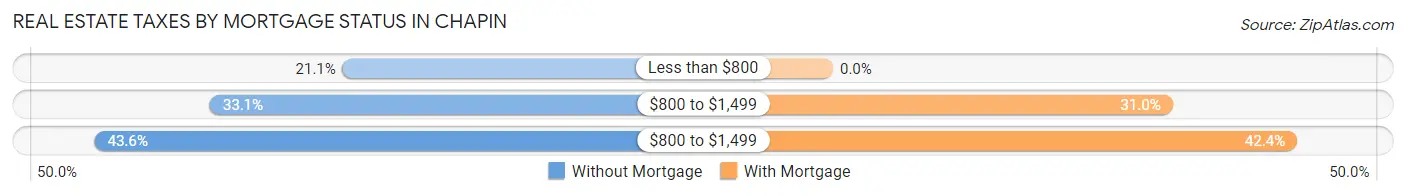
| Property Taxes | Without Mortgage | With Mortgage |
| Less than $800 | 28 (21.0%) | 0 (0.0%) |
| $800 to $1,499 | 44 (33.1%) | 120 (31.0%) |
| $800 to $1,499 | 58 (43.6%) | 164 (42.4%) |
| Total | 133 (100.0%) | 387 (100.0%) |
Health & Disability in Chapin
Health Insurance Coverage by Age in Chapin
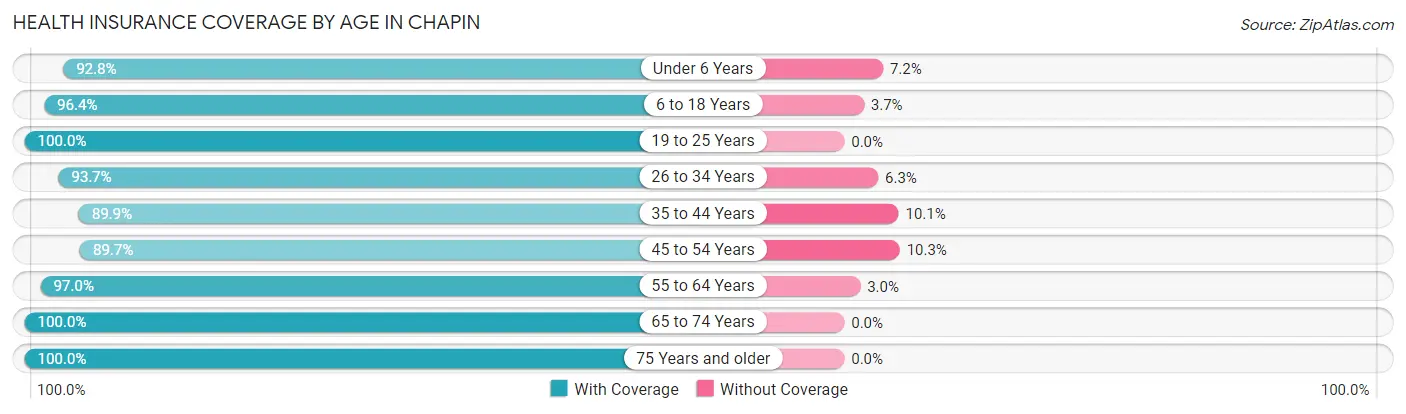
| Age Bracket | With Coverage | Without Coverage |
| Under 6 Years | 103 (92.8%) | 8 (7.2%) |
| 6 to 18 Years | 264 (96.4%) | 10 (3.6%) |
| 19 to 25 Years | 132 (100.0%) | 0 (0.0%) |
| 26 to 34 Years | 119 (93.7%) | 8 (6.3%) |
| 35 to 44 Years | 231 (89.9%) | 26 (10.1%) |
| 45 to 54 Years | 191 (89.7%) | 22 (10.3%) |
| 55 to 64 Years | 196 (97.0%) | 6 (3.0%) |
| 65 to 74 Years | 125 (100.0%) | 0 (0.0%) |
| 75 Years and older | 94 (100.0%) | 0 (0.0%) |
| Total | 1,455 (94.8%) | 80 (5.2%) |
Health Insurance Coverage by Citizenship Status in Chapin
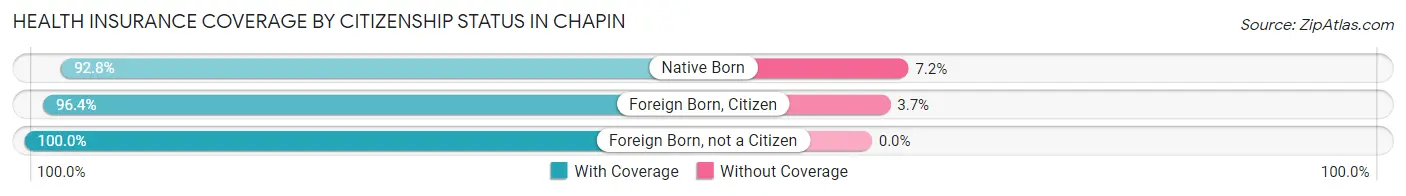
| Citizenship Status | With Coverage | Without Coverage |
| Native Born | 103 (92.8%) | 8 (7.2%) |
| Foreign Born, Citizen | 264 (96.4%) | 10 (3.6%) |
| Foreign Born, not a Citizen | 132 (100.0%) | 0 (0.0%) |
Health Insurance Coverage by Household Income in Chapin
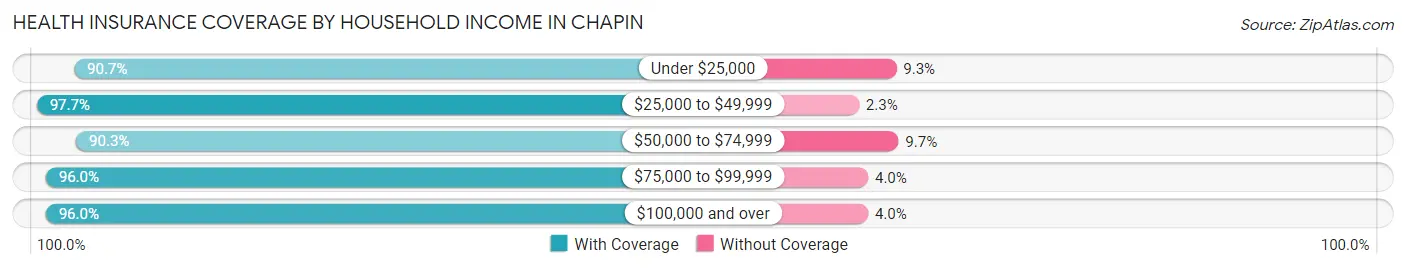
| Household Income | With Coverage | Without Coverage |
| Under $25,000 | 88 (90.7%) | 9 (9.3%) |
| $25,000 to $49,999 | 172 (97.7%) | 4 (2.3%) |
| $50,000 to $74,999 | 271 (90.3%) | 29 (9.7%) |
| $75,000 to $99,999 | 314 (96.0%) | 13 (4.0%) |
| $100,000 and over | 604 (96.0%) | 25 (4.0%) |
Public vs Private Health Insurance Coverage by Age in Chapin
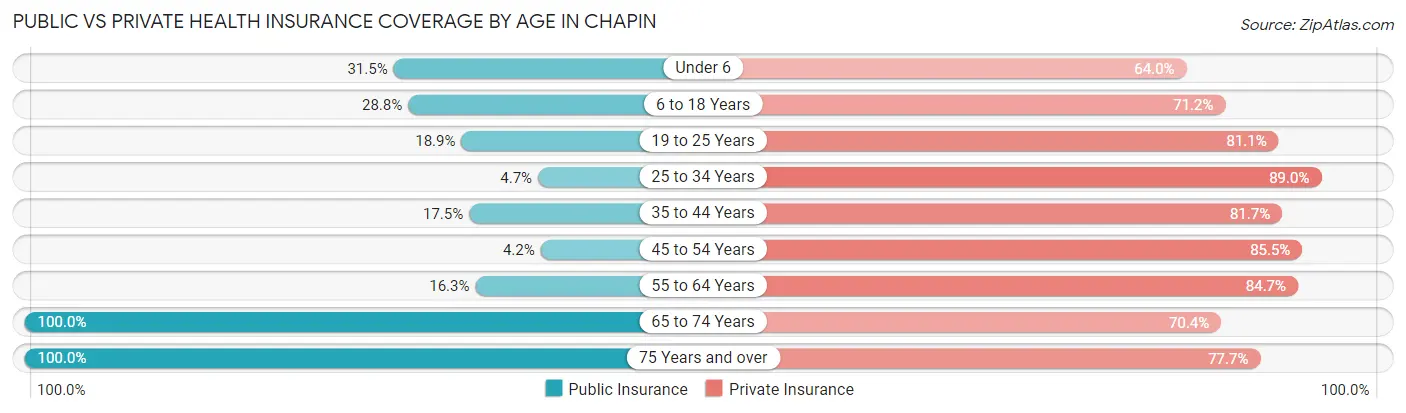
| Age Bracket | Public Insurance | Private Insurance |
| Under 6 | 35 (31.5%) | 71 (64.0%) |
| 6 to 18 Years | 79 (28.8%) | 195 (71.2%) |
| 19 to 25 Years | 25 (18.9%) | 107 (81.1%) |
| 25 to 34 Years | 6 (4.7%) | 113 (89.0%) |
| 35 to 44 Years | 45 (17.5%) | 210 (81.7%) |
| 45 to 54 Years | 9 (4.2%) | 182 (85.5%) |
| 55 to 64 Years | 33 (16.3%) | 171 (84.7%) |
| 65 to 74 Years | 125 (100.0%) | 88 (70.4%) |
| 75 Years and over | 94 (100.0%) | 73 (77.7%) |
| Total | 451 (29.4%) | 1,210 (78.8%) |
Disability Status by Sex by Age in Chapin
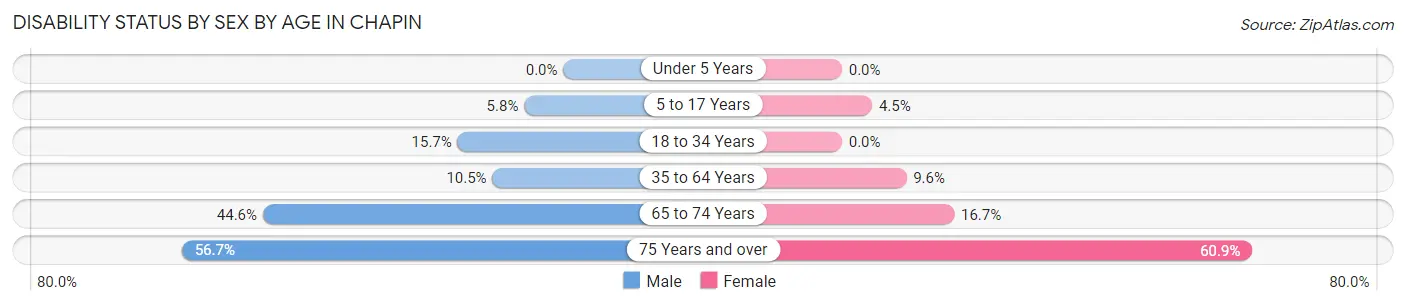
| Age Bracket | Male | Female |
| Under 5 Years | 0 (0.0%) | 0 (0.0%) |
| 5 to 17 Years | 9 (5.8%) | 6 (4.5%) |
| 18 to 34 Years | 19 (15.7%) | 0 (0.0%) |
| 35 to 64 Years | 30 (10.5%) | 37 (9.6%) |
| 65 to 74 Years | 29 (44.6%) | 10 (16.7%) |
| 75 Years and over | 17 (56.7%) | 39 (60.9%) |
Disability Class by Sex by Age in Chapin
Disability Class: Hearing Difficulty
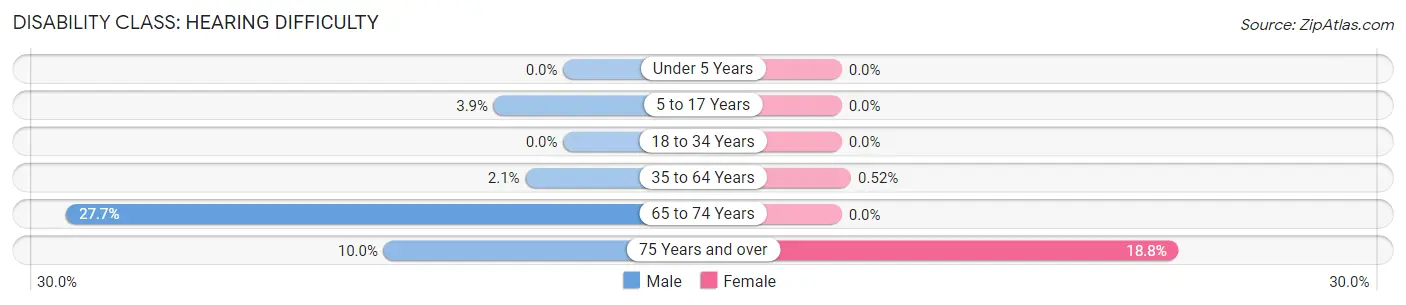
| Age Bracket | Male | Female |
| Under 5 Years | 0 (0.0%) | 0 (0.0%) |
| 5 to 17 Years | 6 (3.9%) | 0 (0.0%) |
| 18 to 34 Years | 0 (0.0%) | 0 (0.0%) |
| 35 to 64 Years | 6 (2.1%) | 2 (0.5%) |
| 65 to 74 Years | 18 (27.7%) | 0 (0.0%) |
| 75 Years and over | 3 (10.0%) | 12 (18.8%) |
Disability Class: Vision Difficulty
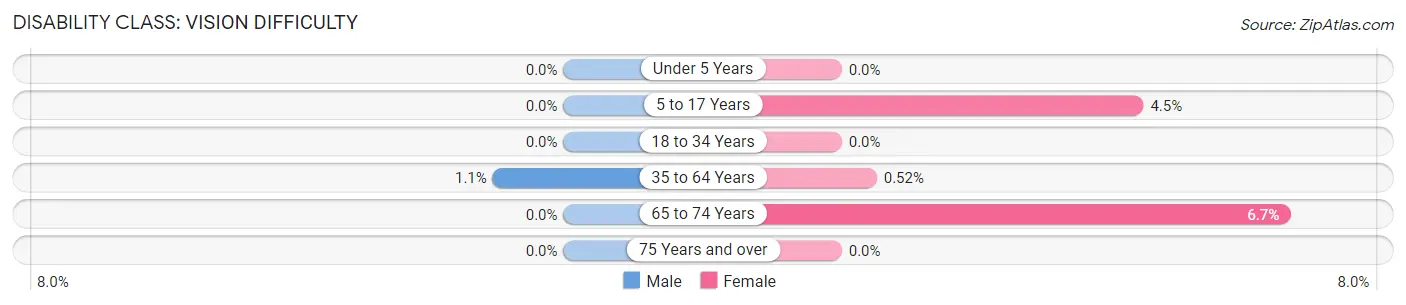
| Age Bracket | Male | Female |
| Under 5 Years | 0 (0.0%) | 0 (0.0%) |
| 5 to 17 Years | 0 (0.0%) | 6 (4.5%) |
| 18 to 34 Years | 0 (0.0%) | 0 (0.0%) |
| 35 to 64 Years | 3 (1.1%) | 2 (0.5%) |
| 65 to 74 Years | 0 (0.0%) | 4 (6.7%) |
| 75 Years and over | 0 (0.0%) | 0 (0.0%) |
Disability Class: Cognitive Difficulty
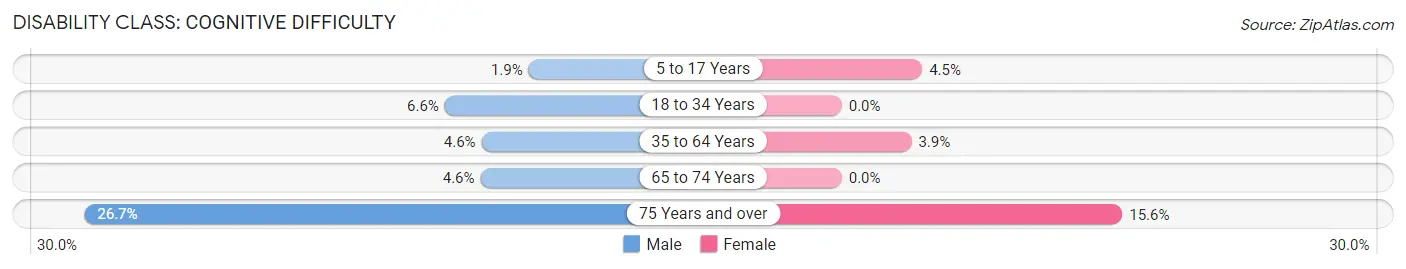
| Age Bracket | Male | Female |
| 5 to 17 Years | 3 (1.9%) | 6 (4.5%) |
| 18 to 34 Years | 8 (6.6%) | 0 (0.0%) |
| 35 to 64 Years | 13 (4.6%) | 15 (3.9%) |
| 65 to 74 Years | 3 (4.6%) | 0 (0.0%) |
| 75 Years and over | 8 (26.7%) | 10 (15.6%) |
Disability Class: Ambulatory Difficulty
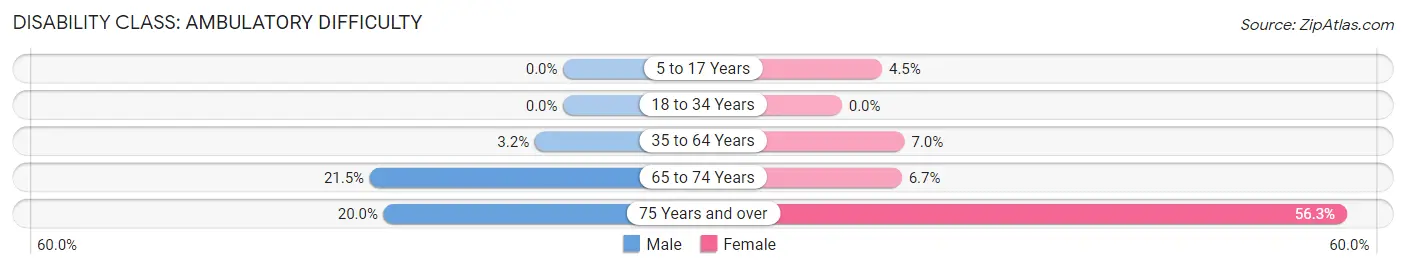
| Age Bracket | Male | Female |
| 5 to 17 Years | 0 (0.0%) | 6 (4.5%) |
| 18 to 34 Years | 0 (0.0%) | 0 (0.0%) |
| 35 to 64 Years | 9 (3.2%) | 27 (7.0%) |
| 65 to 74 Years | 14 (21.5%) | 4 (6.7%) |
| 75 Years and over | 6 (20.0%) | 36 (56.2%) |
Disability Class: Self-Care Difficulty
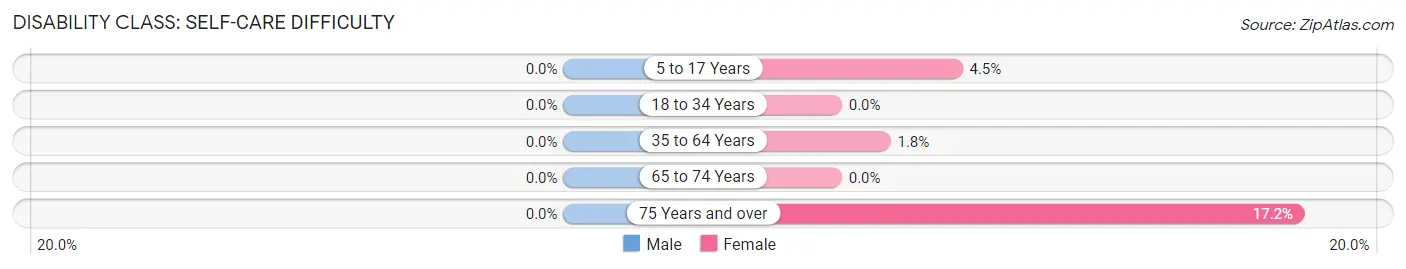
| Age Bracket | Male | Female |
| 5 to 17 Years | 0 (0.0%) | 6 (4.5%) |
| 18 to 34 Years | 0 (0.0%) | 0 (0.0%) |
| 35 to 64 Years | 0 (0.0%) | 7 (1.8%) |
| 65 to 74 Years | 0 (0.0%) | 0 (0.0%) |
| 75 Years and over | 0 (0.0%) | 11 (17.2%) |
Technology Access in Chapin
Computing Device Access in Chapin
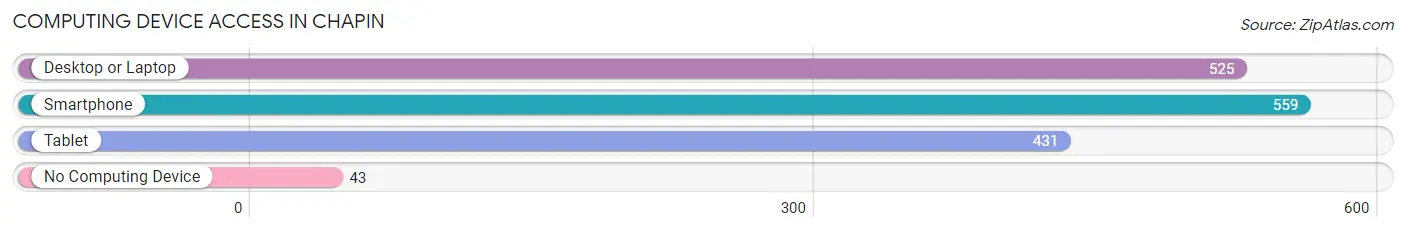
| Device Type | # Households | % Households |
| Desktop or Laptop | 525 | 83.3% |
| Smartphone | 559 | 88.7% |
| Tablet | 431 | 68.4% |
| No Computing Device | 43 | 6.8% |
| Total | 630 | 100.0% |
Internet Access in Chapin
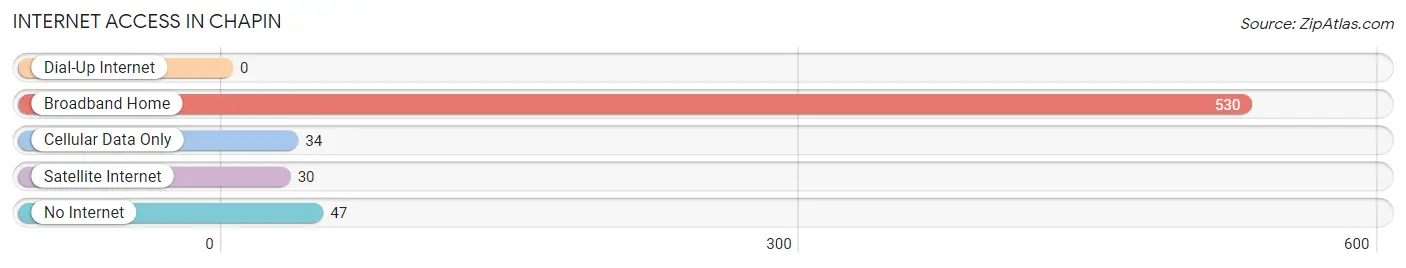
| Internet Type | # Households | % Households |
| Dial-Up Internet | 0 | 0.0% |
| Broadband Home | 530 | 84.1% |
| Cellular Data Only | 34 | 5.4% |
| Satellite Internet | 30 | 4.8% |
| No Internet | 47 | 7.5% |
| Total | 630 | 100.0% |
Chapin Summary
Chapin is a small town located in Lexington County, South Carolina. It is situated in the Midlands region of the state, approximately 20 miles northwest of the state capital, Columbia. The town was founded in 1891 and is named after Martin Chapin, a local landowner. As of the 2010 census, the population of Chapin was 1,554.
Geography
Chapin is located at 34°10'25"N 81°14'45"W (34.173611, -81.245833). It is situated in the Midlands region of South Carolina, approximately 20 miles northwest of the state capital, Columbia. The town is located on the western shore of Lake Murray, a 50,000-acre reservoir created by the construction of the Saluda Dam in 1930. The town is bordered by the towns of Little Mountain to the north, Irmo to the east, and Lexington to the south.
The town has a total area of 2.2 square miles, all of which is land. The terrain is mostly flat, with some rolling hills in the northern part of town. The climate is humid subtropical, with hot, humid summers and mild winters.
Demographics
As of the 2010 census, the population of Chapin was 1,554. The racial makeup of the town was 87.3% White, 8.2% African American, 0.3% Native American, 1.2% Asian, 0.1% Pacific Islander, 1.2% from other races, and 1.7% from two or more races. Hispanic or Latino of any race were 3.2% of the population.
The median household income in Chapin was $50,938 in 2018, and the median family income was $60,938. The per capita income was $27,938. About 8.2% of families and 10.2% of the population were below the poverty line, including 14.2% of those under age 18 and 8.2% of those age 65 or over.
Economy
The economy of Chapin is largely based on agriculture and tourism. The town is home to several farms, including a large peach farm, and is a popular destination for fishing and boating on Lake Murray. The town is also home to several small businesses, including restaurants, retail stores, and professional services.
The town is served by the Lexington County School District, which operates three elementary schools, one middle school, and one high school. The town is also home to several churches, including the First Baptist Church of Chapin, which was founded in 1891.
Conclusion
Chapin is a small town located in Lexington County, South Carolina. It is situated in the Midlands region of the state, approximately 20 miles northwest of the state capital, Columbia. The town was founded in 1891 and is named after Martin Chapin, a local landowner. As of the 2010 census, the population of Chapin was 1,554. The town is located on the western shore of Lake Murray, a 50,000-acre reservoir created by the construction of the Saluda Dam in 1930. The economy of Chapin is largely based on agriculture and tourism. The town is served by the Lexington County School District, which operates three elementary schools, one middle school, and one high school. The town is also home to several churches, including the First Baptist Church of Chapin, which was founded in 1891.
Common Questions
What is Per Capita Income in Chapin?
Per Capita income in Chapin is $35,205.
What is the Median Family Income in Chapin?
Median Family Income in Chapin is $84,310.
What is the Median Household income in Chapin?
Median Household Income in Chapin is $77,917.
What is Income or Wage Gap in Chapin?
Income or Wage Gap in Chapin is 57.3%.
Women in Chapin earn 42.7 cents for every dollar earned by a man.
What is Family Income Deficit in Chapin?
Family Income Deficit in Chapin is $11,945.
Families that are below poverty line in Chapin earn $11,945 less on average than the poverty threshold level.
What is Inequality or Gini Index in Chapin?
Inequality or Gini Index in Chapin is 0.36.
What is the Total Population of Chapin?
Total Population of Chapin is 1,543.
What is the Total Male Population of Chapin?
Total Male Population of Chapin is 705.
What is the Total Female Population of Chapin?
Total Female Population of Chapin is 838.
What is the Ratio of Males per 100 Females in Chapin?
There are 84.13 Males per 100 Females in Chapin.
What is the Ratio of Females per 100 Males in Chapin?
There are 118.87 Females per 100 Males in Chapin.
What is the Median Population Age in Chapin?
Median Population Age in Chapin is 38.9 Years.
What is the Average Family Size in Chapin
Average Family Size in Chapin is 3.0 People.
What is the Average Household Size in Chapin
Average Household Size in Chapin is 2.4 People.
How Large is the Labor Force in Chapin?
There are 840 People in the Labor Forcein in Chapin.
What is the Percentage of People in the Labor Force in Chapin?
68.6% of People are in the Labor Force in Chapin.
What is the Unemployment Rate in Chapin?
Unemployment Rate in Chapin is 9.3%.