Jackson, SC Map & Demographics
Jackson Map
Jackson Overview
$26,439
PER CAPITA INCOME
$37,166
AVG FAMILY INCOME
$36,632
AVG HOUSEHOLD INCOME
7.2%
WAGE / INCOME GAP [ % ]
92.8¢/ $1
WAGE / INCOME GAP [ $ ]
0.38
INEQUALITY / GINI INDEX
1,882
TOTAL POPULATION
840
MALE POPULATION
1,042
FEMALE POPULATION
80.61
MALES / 100 FEMALES
124.05
FEMALES / 100 MALES
58.3
MEDIAN AGE
2.4
AVG FAMILY SIZE
1.9
AVG HOUSEHOLD SIZE
782
LABOR FORCE [ PEOPLE ]
48.6%
PERCENT IN LABOR FORCE
3.6%
UNEMPLOYMENT RATE
Jackson Zip Codes
Jackson Area Codes
Income in Jackson
Income Overview in Jackson
Per Capita Income in Jackson is $26,439, while median incomes of families and households are $37,166 and $36,632 respectively.
| Characteristic | Number | Measure |
| Per Capita Income | 1,882 | $26,439 |
| Median Family Income | 595 | $37,166 |
| Mean Family Income | 595 | $63,661 |
| Median Household Income | 967 | $36,632 |
| Mean Household Income | 967 | $53,683 |
| Income Deficit | 595 | $0 |
| Wage / Income Gap (%) | 1,882 | 7.23% |
| Wage / Income Gap ($) | 1,882 | 92.77¢ per $1 |
| Gini / Inequality Index | 1,882 | 0.38 |
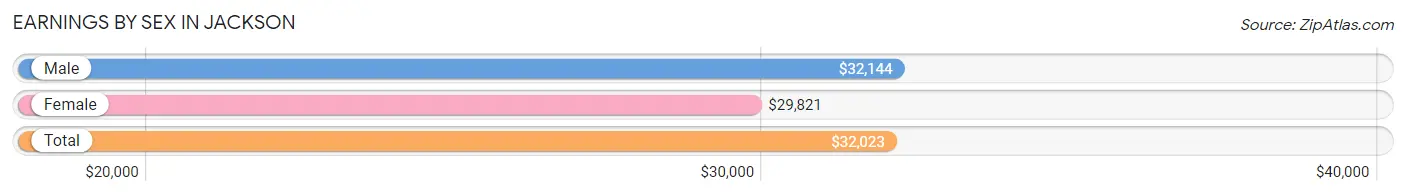
Earnings by Sex in Jackson
Average Earnings in Jackson are $32,023, $32,144 for men and $29,821 for women, a difference of 7.2%.
| Sex | Number | Average Earnings |
| Male | 459 (56.9%) | $32,144 |
| Female | 348 (43.1%) | $29,821 |
| Total | 807 (100.0%) | $32,023 |
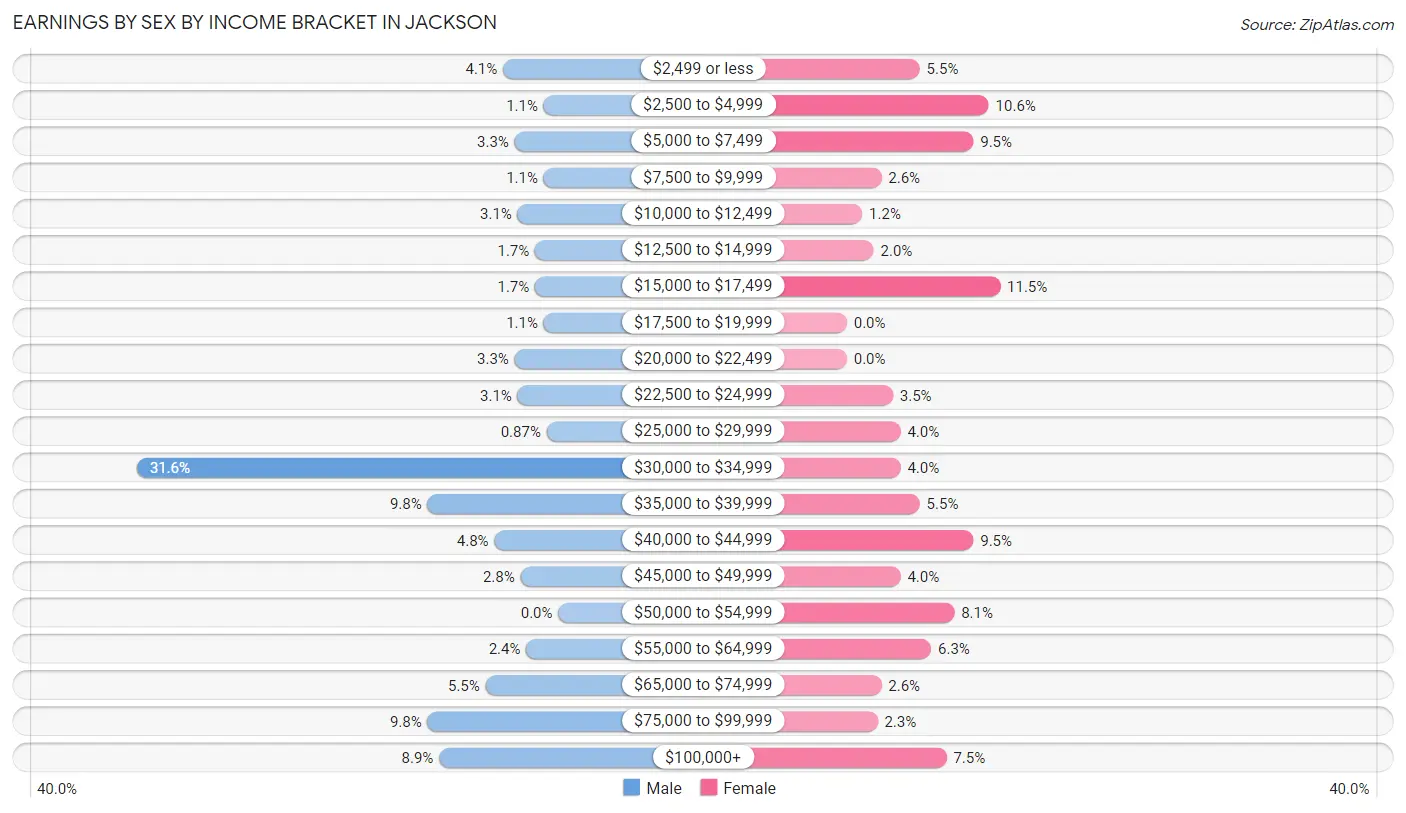
Earnings by Sex by Income Bracket in Jackson
The most common earnings brackets in Jackson are $30,000 to $34,999 for men (145 | 31.6%) and $15,000 to $17,499 for women (40 | 11.5%).
| Income | Male | Female |
| $2,499 or less | 19 (4.1%) | 19 (5.5%) |
| $2,500 to $4,999 | 5 (1.1%) | 37 (10.6%) |
| $5,000 to $7,499 | 15 (3.3%) | 33 (9.5%) |
| $7,500 to $9,999 | 5 (1.1%) | 9 (2.6%) |
| $10,000 to $12,499 | 14 (3.0%) | 4 (1.1%) |
| $12,500 to $14,999 | 8 (1.7%) | 7 (2.0%) |
| $15,000 to $17,499 | 8 (1.7%) | 40 (11.5%) |
| $17,500 to $19,999 | 5 (1.1%) | 0 (0.0%) |
| $20,000 to $22,499 | 15 (3.3%) | 0 (0.0%) |
| $22,500 to $24,999 | 14 (3.0%) | 12 (3.5%) |
| $25,000 to $29,999 | 4 (0.9%) | 14 (4.0%) |
| $30,000 to $34,999 | 145 (31.6%) | 14 (4.0%) |
| $35,000 to $39,999 | 45 (9.8%) | 19 (5.5%) |
| $40,000 to $44,999 | 22 (4.8%) | 33 (9.5%) |
| $45,000 to $49,999 | 13 (2.8%) | 14 (4.0%) |
| $50,000 to $54,999 | 0 (0.0%) | 28 (8.1%) |
| $55,000 to $64,999 | 11 (2.4%) | 22 (6.3%) |
| $65,000 to $74,999 | 25 (5.4%) | 9 (2.6%) |
| $75,000 to $99,999 | 45 (9.8%) | 8 (2.3%) |
| $100,000+ | 41 (8.9%) | 26 (7.5%) |
| Total | 459 (100.0%) | 348 (100.0%) |
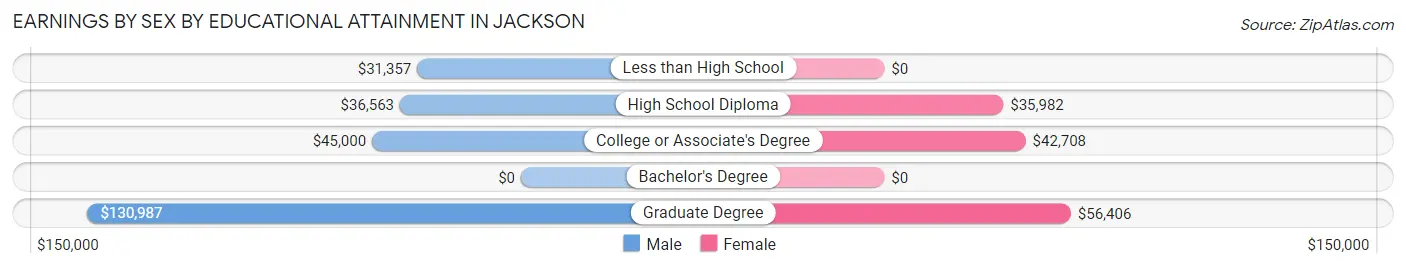
Earnings by Sex by Educational Attainment in Jackson
Average earnings in Jackson are $33,333 for men and $35,268 for women, a difference of 5.5%. Men with an educational attainment of graduate degree enjoy the highest average annual earnings of $130,987, while those with less than high school education earn the least with $31,357. Women with an educational attainment of graduate degree earn the most with the average annual earnings of $56,406, while those with high school diploma education have the smallest earnings of $35,982.
| Educational Attainment | Male Income | Female Income |
| Less than High School | $31,357 | $0 |
| High School Diploma | $36,563 | $35,982 |
| College or Associate's Degree | $45,000 | $42,708 |
| Bachelor's Degree | - | - |
| Graduate Degree | $130,987 | $56,406 |
| Total | $33,333 | $35,268 |
Family Income in Jackson
Family Income Brackets in Jackson
According to the Jackson family income data, there are 276 families falling into the $35,000 to $49,999 income range, which is the most common income bracket and makes up 46.4% of all families. Conversely, the $10,000 to $14,999 income bracket is the least frequent group with only 1 families (0.2%) belonging to this category.
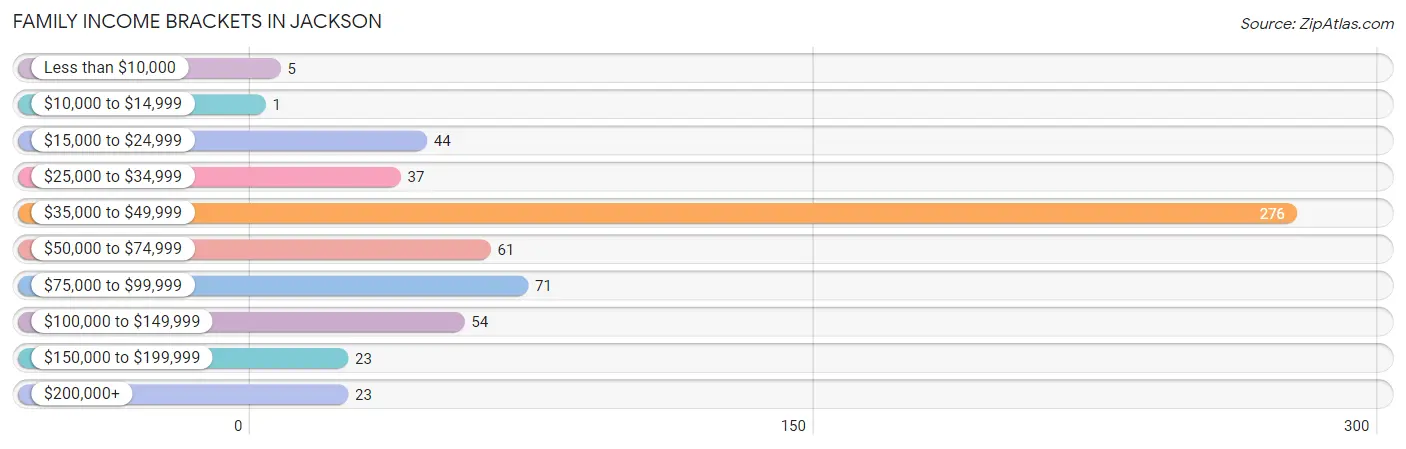
| Income Bracket | # Families | % Families |
| Less than $10,000 | 5 | 0.8% |
| $10,000 to $14,999 | 1 | 0.2% |
| $15,000 to $24,999 | 44 | 7.4% |
| $25,000 to $34,999 | 37 | 6.2% |
| $35,000 to $49,999 | 276 | 46.4% |
| $50,000 to $74,999 | 61 | 10.3% |
| $75,000 to $99,999 | 71 | 11.9% |
| $100,000 to $149,999 | 54 | 9.1% |
| $150,000 to $199,999 | 23 | 3.9% |
| $200,000+ | 23 | 3.9% |
Family Income by Famaliy Size in Jackson
4-person families (13 | 2.2%) account for the highest median family income in Jackson with $161,875 per family, while 4-person families (13 | 2.2%) have the highest median income of $40,469 per family member.
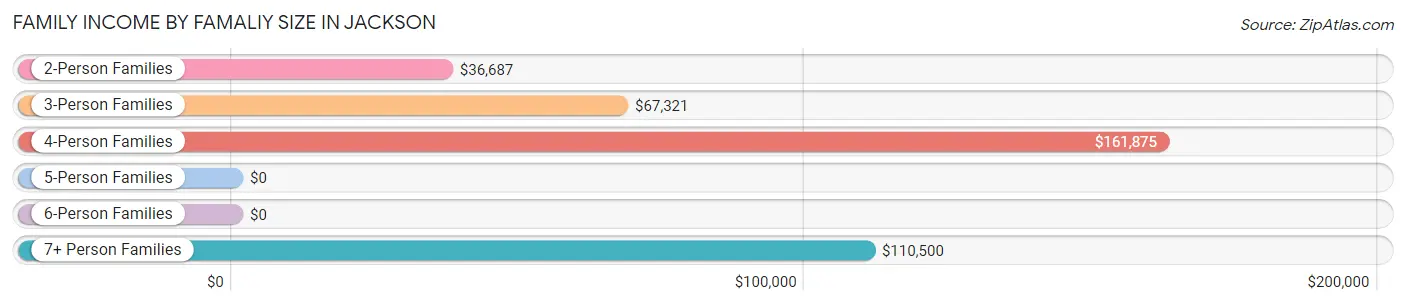
| Income Bracket | # Families | Median Income |
| 2-Person Families | 454 (76.3%) | $36,687 |
| 3-Person Families | 81 (13.6%) | $67,321 |
| 4-Person Families | 13 (2.2%) | $161,875 |
| 5-Person Families | 14 (2.4%) | $0 |
| 6-Person Families | 13 (2.2%) | $0 |
| 7+ Person Families | 20 (3.4%) | $110,500 |
| Total | 595 (100.0%) | $37,166 |
Family Income by Number of Earners in Jackson
The median family income in Jackson is $37,166, with families comprising 2 earners (152) having the highest median family income of $117,778, while families with no earners (299) have the lowest median family income of $36,165, accounting for 25.6% and 50.2% of families, respectively.
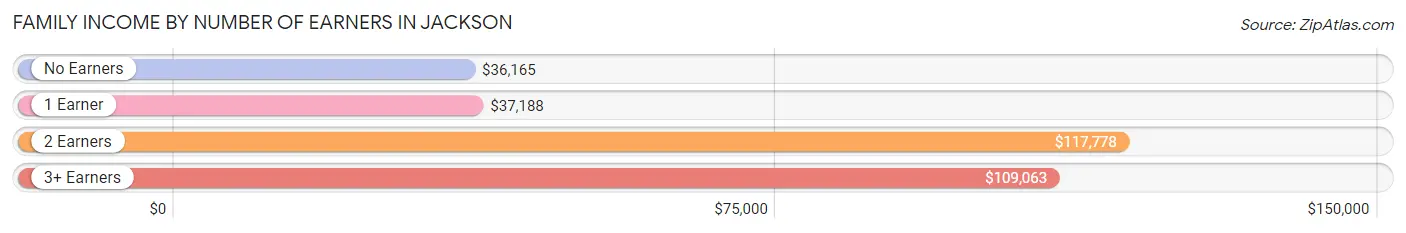
| Number of Earners | # Families | Median Income |
| No Earners | 299 (50.2%) | $36,165 |
| 1 Earner | 119 (20.0%) | $37,188 |
| 2 Earners | 152 (25.6%) | $117,778 |
| 3+ Earners | 25 (4.2%) | $109,063 |
| Total | 595 (100.0%) | $37,166 |
Household Income in Jackson
Household Income Brackets in Jackson
With 301 households falling in the category, the $35,000 to $49,999 income range is the most frequent in Jackson, accounting for 31.1% of all households. In contrast, only 8 households (0.8%) fall into the $10,000 to $14,999 income bracket, making it the least populous group.
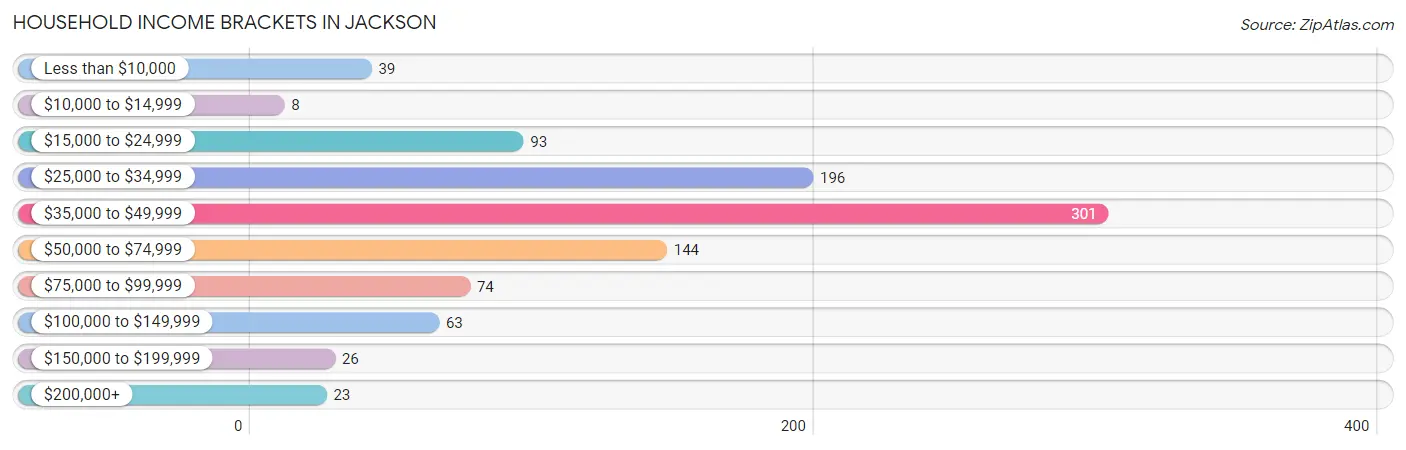
| Income Bracket | # Households | % Households |
| Less than $10,000 | 39 | 4.0% |
| $10,000 to $14,999 | 8 | 0.8% |
| $15,000 to $24,999 | 93 | 9.6% |
| $25,000 to $34,999 | 196 | 20.3% |
| $35,000 to $49,999 | 301 | 31.1% |
| $50,000 to $74,999 | 144 | 14.9% |
| $75,000 to $99,999 | 74 | 7.7% |
| $100,000 to $149,999 | 63 | 6.5% |
| $150,000 to $199,999 | 26 | 2.7% |
| $200,000+ | 23 | 2.4% |
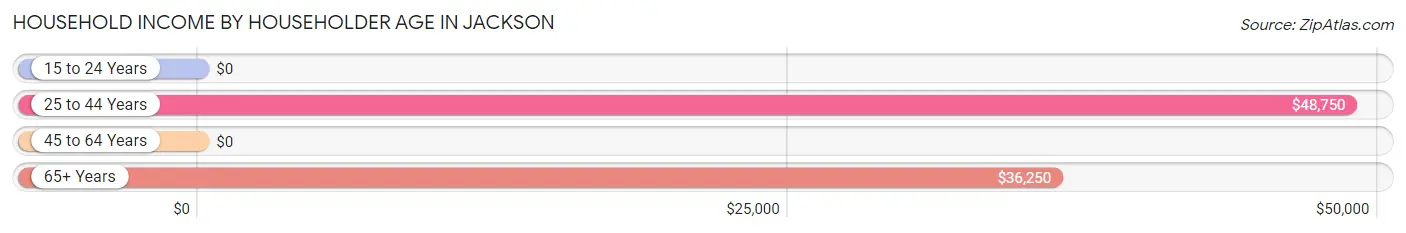
Household Income by Householder Age in Jackson
The median household income in Jackson is $36,632, with the highest median household income of $48,750 found in the 25 to 44 years age bracket for the primary householder. A total of 147 households (15.2%) fall into this category.
| Income Bracket | # Households | Median Income |
| 15 to 24 Years | 0 (0.0%) | $0 |
| 25 to 44 Years | 147 (15.2%) | $48,750 |
| 45 to 64 Years | 366 (37.9%) | $0 |
| 65+ Years | 454 (46.9%) | $36,250 |
| Total | 967 (100.0%) | $36,632 |
Poverty in Jackson
Income Below Poverty by Sex and Age in Jackson
With 9.3% poverty level for males and 8.9% for females among the residents of Jackson, 12 to 14 year old males and 16 and 17 year old females are the most vulnerable to poverty, with 4 males (100.0%) and 7 females (46.7%) in their respective age groups living below the poverty level.
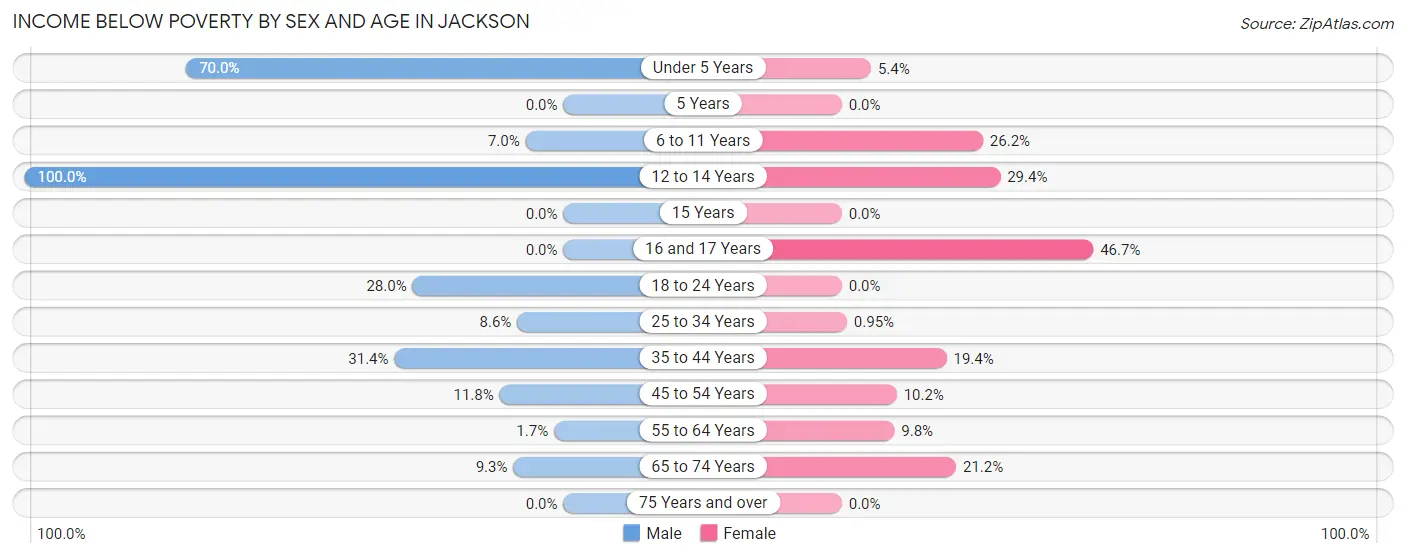
| Age Bracket | Male | Female |
| Under 5 Years | 7 (70.0%) | 6 (5.4%) |
| 5 Years | 0 (0.0%) | 0 (0.0%) |
| 6 to 11 Years | 4 (7.0%) | 11 (26.2%) |
| 12 to 14 Years | 4 (100.0%) | 10 (29.4%) |
| 15 Years | 0 (0.0%) | 0 (0.0%) |
| 16 and 17 Years | 0 (0.0%) | 7 (46.7%) |
| 18 to 24 Years | 14 (28.0%) | 0 (0.0%) |
| 25 to 34 Years | 6 (8.6%) | 1 (0.9%) |
| 35 to 44 Years | 16 (31.4%) | 14 (19.4%) |
| 45 to 54 Years | 9 (11.8%) | 11 (10.2%) |
| 55 to 64 Years | 5 (1.7%) | 12 (9.8%) |
| 65 to 74 Years | 13 (9.3%) | 21 (21.2%) |
| 75 Years and over | 0 (0.0%) | 0 (0.0%) |
| Total | 78 (9.3%) | 93 (8.9%) |
Income Above Poverty by Sex and Age in Jackson
According to the poverty statistics in Jackson, males aged 15 years and females aged 15 years are the age groups that are most secure financially, with 100.0% of males and 100.0% of females in these age groups living above the poverty line.
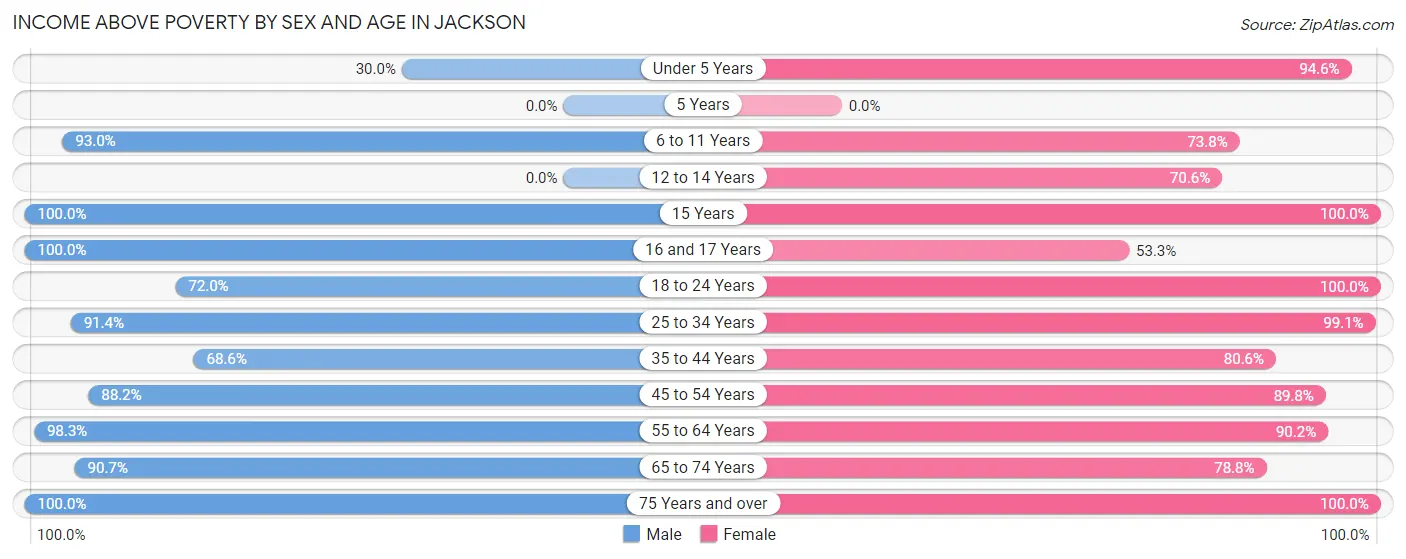
| Age Bracket | Male | Female |
| Under 5 Years | 3 (30.0%) | 105 (94.6%) |
| 5 Years | 0 (0.0%) | 0 (0.0%) |
| 6 to 11 Years | 53 (93.0%) | 31 (73.8%) |
| 12 to 14 Years | 0 (0.0%) | 24 (70.6%) |
| 15 Years | 1 (100.0%) | 14 (100.0%) |
| 16 and 17 Years | 9 (100.0%) | 8 (53.3%) |
| 18 to 24 Years | 36 (72.0%) | 44 (100.0%) |
| 25 to 34 Years | 64 (91.4%) | 104 (99.1%) |
| 35 to 44 Years | 35 (68.6%) | 58 (80.6%) |
| 45 to 54 Years | 67 (88.2%) | 97 (89.8%) |
| 55 to 64 Years | 282 (98.3%) | 111 (90.2%) |
| 65 to 74 Years | 127 (90.7%) | 78 (78.8%) |
| 75 Years and over | 85 (100.0%) | 275 (100.0%) |
| Total | 762 (90.7%) | 949 (91.1%) |
Income Below Poverty Among Married-Couple Families in Jackson
The poverty statistics for married-couple families in Jackson show that 2.7% or 13 of the total 482 families live below the poverty line. Families with 5 or more children have the highest poverty rate of 100.0%, comprising of 5 families. On the other hand, families with no children have the lowest poverty rate of 0.0%, which includes 0 families.
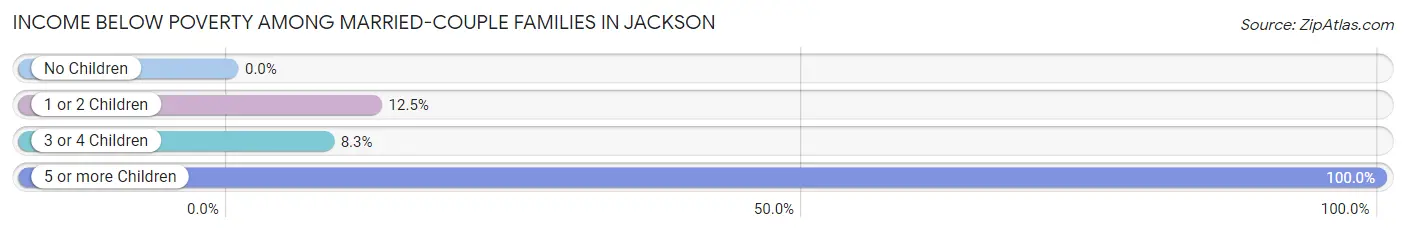
| Children | Above Poverty | Below Poverty |
| No Children | 401 (100.0%) | 0 (0.0%) |
| 1 or 2 Children | 35 (87.5%) | 5 (12.5%) |
| 3 or 4 Children | 33 (91.7%) | 3 (8.3%) |
| 5 or more Children | 0 (0.0%) | 5 (100.0%) |
| Total | 469 (97.3%) | 13 (2.7%) |
Income Below Poverty Among Single-Parent Households in Jackson
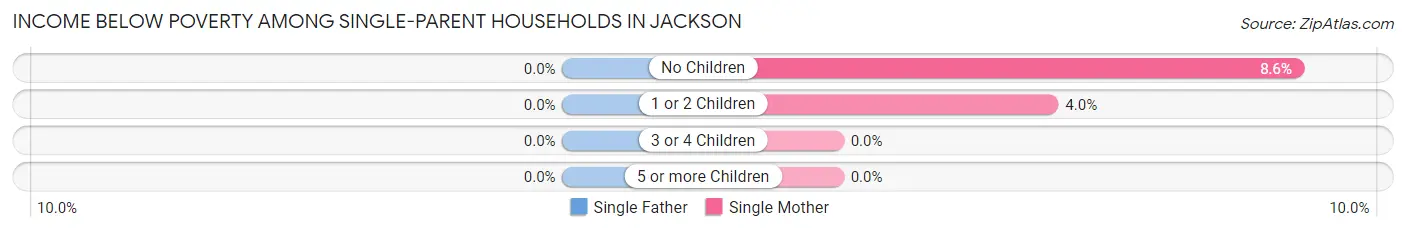
| Children | Single Father | Single Mother |
| No Children | 0 (0.0%) | 3 (8.6%) |
| 1 or 2 Children | 0 (0.0%) | 1 (4.0%) |
| 3 or 4 Children | 0 (0.0%) | 0 (0.0%) |
| 5 or more Children | 0 (0.0%) | 0 (0.0%) |
| Total | 0 (0.0%) | 4 (6.7%) |
Income Below Poverty Among Married-Couple vs Single-Parent Households in Jackson
The poverty data for Jackson shows that 13 of the married-couple family households (2.7%) and 4 of the single-parent households (3.5%) are living below the poverty level. Within the married-couple family households, those with 5 or more children have the highest poverty rate, with 5 households (100.0%) falling below the poverty line. Among the single-parent households, those with no children have the highest poverty rate, with 3 household (6.4%) living below poverty.
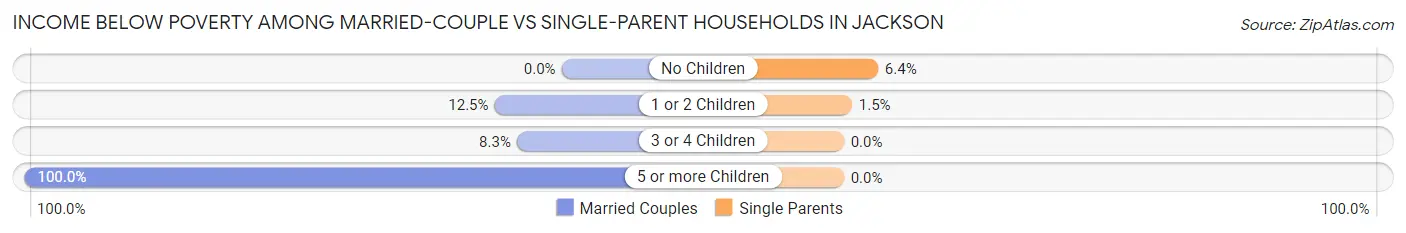
| Children | Married-Couple Families | Single-Parent Households |
| No Children | 0 (0.0%) | 3 (6.4%) |
| 1 or 2 Children | 5 (12.5%) | 1 (1.5%) |
| 3 or 4 Children | 3 (8.3%) | 0 (0.0%) |
| 5 or more Children | 5 (100.0%) | 0 (0.0%) |
| Total | 13 (2.7%) | 4 (3.5%) |
Race in Jackson
The most populous races in Jackson are White / Caucasian (1,074 | 57.1%), Black / African American (699 | 37.1%), and Two or more Races (92 | 4.9%).
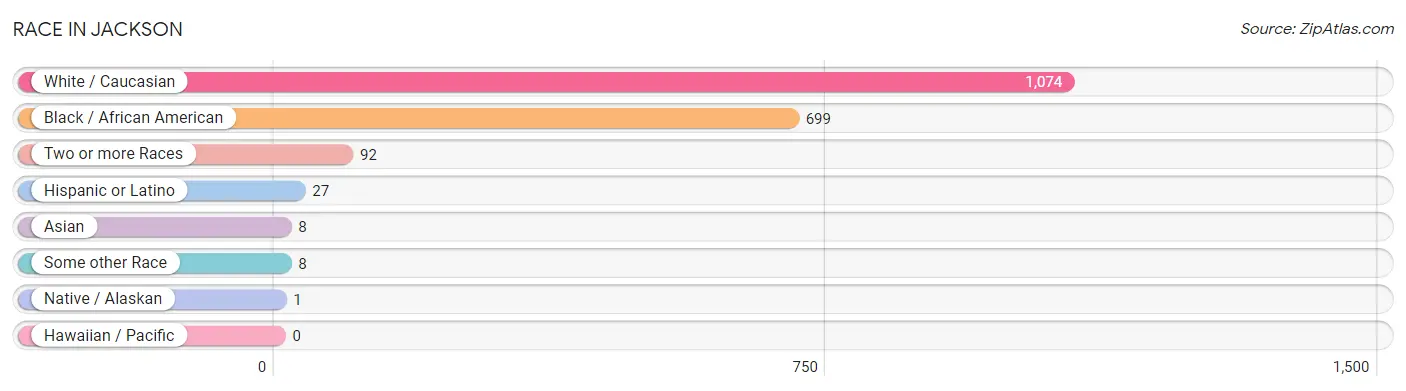
| Race | # Population | % Population |
| Asian | 8 | 0.4% |
| Black / African American | 699 | 37.1% |
| Hawaiian / Pacific | 0 | 0.0% |
| Hispanic or Latino | 27 | 1.4% |
| Native / Alaskan | 1 | 0.1% |
| White / Caucasian | 1,074 | 57.1% |
| Two or more Races | 92 | 4.9% |
| Some other Race | 8 | 0.4% |
| Total | 1,882 | 100.0% |
Ancestry in Jackson
The most populous ancestries reported in Jackson are American (778 | 41.3%), English (138 | 7.3%), Irish (128 | 6.8%), German (114 | 6.1%), and Italian (68 | 3.6%), together accounting for 65.1% of all Jackson residents.
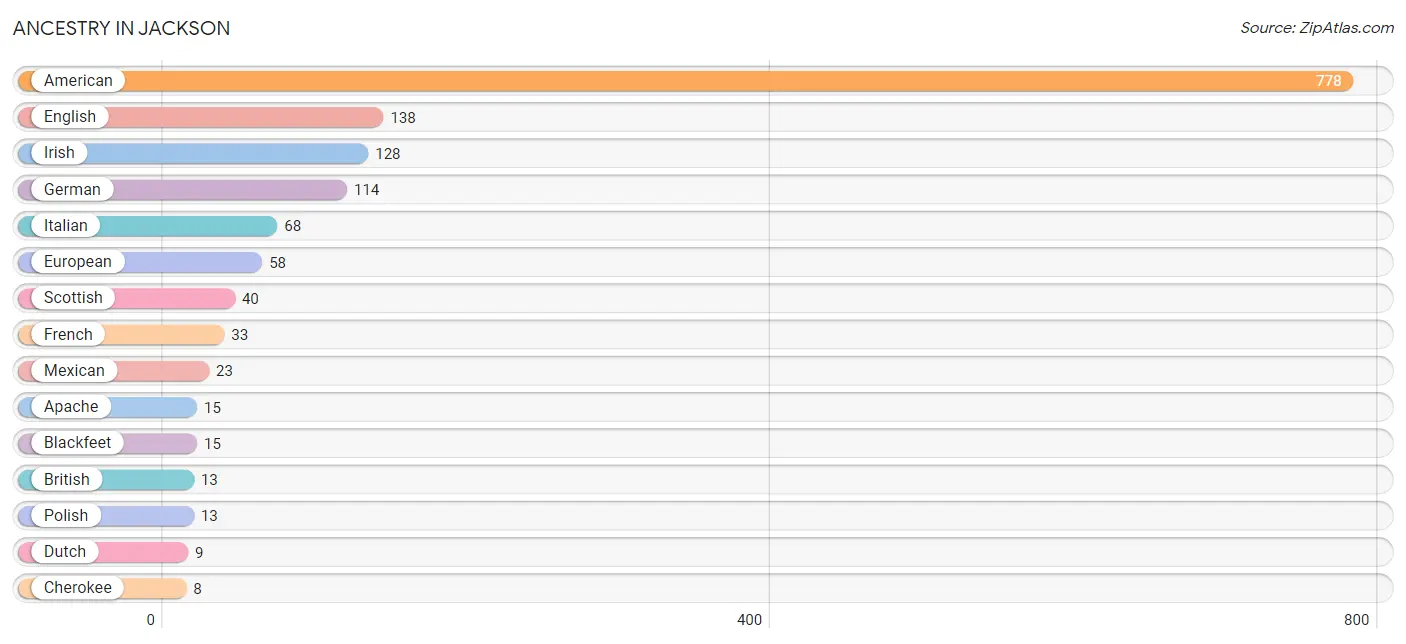
| Ancestry | # Population | % Population |
| American | 778 | 41.3% |
| Apache | 15 | 0.8% |
| Arab | 1 | 0.1% |
| Blackfeet | 15 | 0.8% |
| British | 13 | 0.7% |
| Burmese | 6 | 0.3% |
| Central American | 4 | 0.2% |
| Cherokee | 8 | 0.4% |
| Costa Rican | 4 | 0.2% |
| Dutch | 9 | 0.5% |
| Eastern European | 3 | 0.2% |
| English | 138 | 7.3% |
| European | 58 | 3.1% |
| French | 33 | 1.8% |
| German | 114 | 6.1% |
| Hungarian | 3 | 0.2% |
| Irish | 128 | 6.8% |
| Iroquois | 2 | 0.1% |
| Italian | 68 | 3.6% |
| Korean | 2 | 0.1% |
| Mexican | 23 | 1.2% |
| Moroccan | 1 | 0.1% |
| Northern European | 6 | 0.3% |
| Polish | 13 | 0.7% |
| Portuguese | 7 | 0.4% |
| Russian | 3 | 0.2% |
| Scottish | 40 | 2.1% |
| Welsh | 3 | 0.2% |
| Yugoslavian | 1 | 0.1% | View All 29 Rows |
Immigrants in Jackson
The most numerous immigrant groups reported in Jackson came from Central America (9 | 0.5%), Latin America (9 | 0.5%), Asia (8 | 0.4%), Eastern Asia (6 | 0.3%), and Korea (6 | 0.3%), together accounting for 2.0% of all Jackson residents.
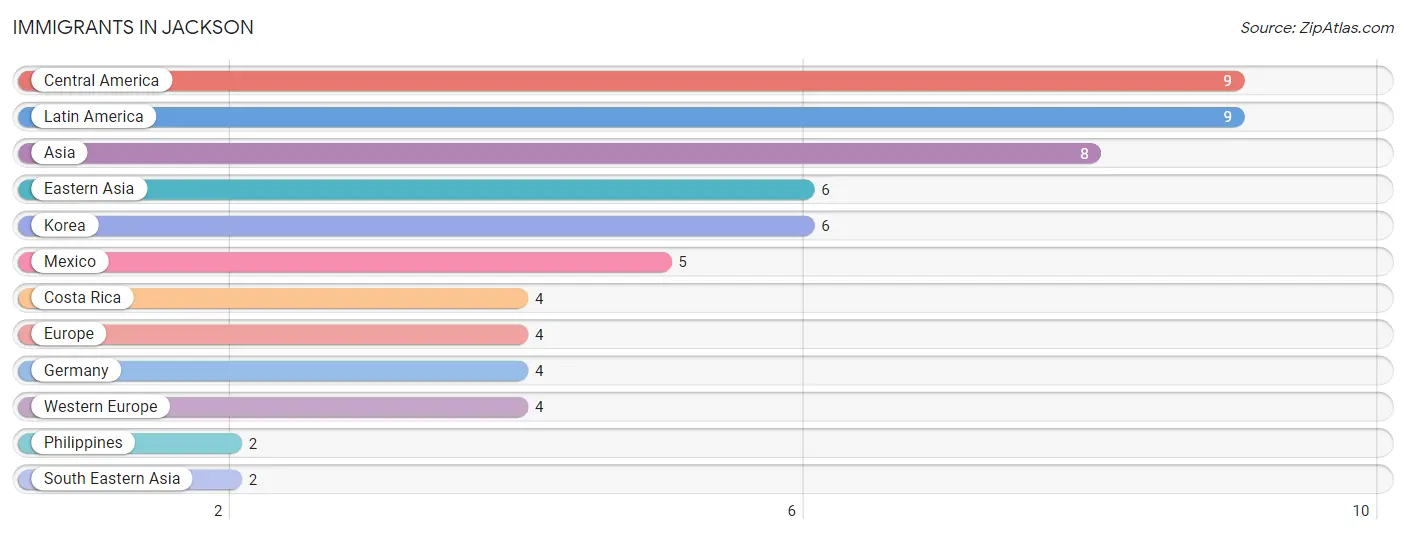
| Immigration Origin | # Population | % Population |
| Asia | 8 | 0.4% |
| Central America | 9 | 0.5% |
| Costa Rica | 4 | 0.2% |
| Eastern Asia | 6 | 0.3% |
| Europe | 4 | 0.2% |
| Germany | 4 | 0.2% |
| Korea | 6 | 0.3% |
| Latin America | 9 | 0.5% |
| Mexico | 5 | 0.3% |
| Philippines | 2 | 0.1% |
| South Eastern Asia | 2 | 0.1% |
| Western Europe | 4 | 0.2% | View All 12 Rows |
Sex and Age in Jackson
Sex and Age in Jackson
The most populous age groups in Jackson are 60 to 64 Years (199 | 23.7%) for men and 75 to 79 Years (212 | 20.3%) for women.
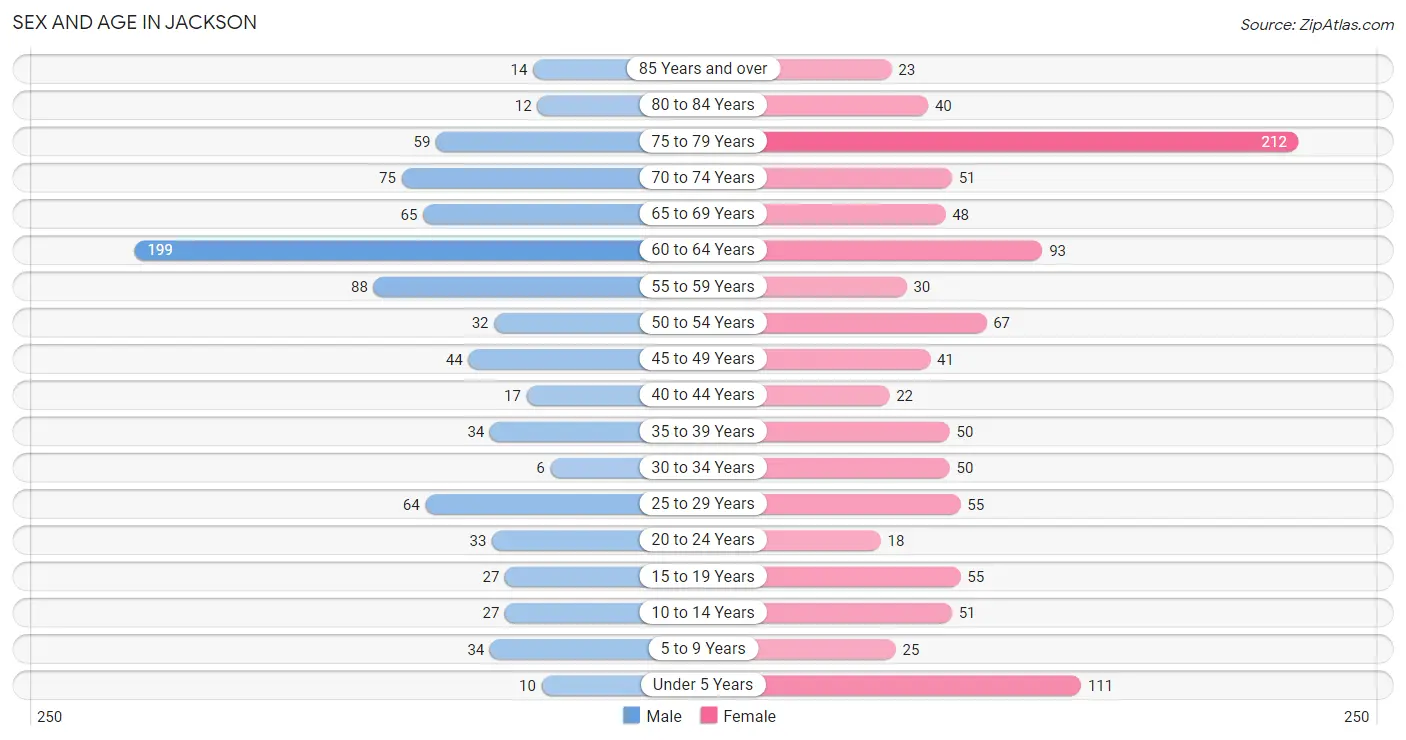
| Age Bracket | Male | Female |
| Under 5 Years | 10 (1.2%) | 111 (10.6%) |
| 5 to 9 Years | 34 (4.1%) | 25 (2.4%) |
| 10 to 14 Years | 27 (3.2%) | 51 (4.9%) |
| 15 to 19 Years | 27 (3.2%) | 55 (5.3%) |
| 20 to 24 Years | 33 (3.9%) | 18 (1.7%) |
| 25 to 29 Years | 64 (7.6%) | 55 (5.3%) |
| 30 to 34 Years | 6 (0.7%) | 50 (4.8%) |
| 35 to 39 Years | 34 (4.1%) | 50 (4.8%) |
| 40 to 44 Years | 17 (2.0%) | 22 (2.1%) |
| 45 to 49 Years | 44 (5.2%) | 41 (3.9%) |
| 50 to 54 Years | 32 (3.8%) | 67 (6.4%) |
| 55 to 59 Years | 88 (10.5%) | 30 (2.9%) |
| 60 to 64 Years | 199 (23.7%) | 93 (8.9%) |
| 65 to 69 Years | 65 (7.7%) | 48 (4.6%) |
| 70 to 74 Years | 75 (8.9%) | 51 (4.9%) |
| 75 to 79 Years | 59 (7.0%) | 212 (20.3%) |
| 80 to 84 Years | 12 (1.4%) | 40 (3.8%) |
| 85 Years and over | 14 (1.7%) | 23 (2.2%) |
| Total | 840 (100.0%) | 1,042 (100.0%) |
Families and Households in Jackson
Median Family Size in Jackson
The median family size in Jackson is 2.42 persons per family, with single female/mother families (60 | 10.1%) accounting for the largest median family size of 3.1 persons per family. On the other hand, single male/father families (53 | 8.9%) represent the smallest median family size with 2.19 persons per family.
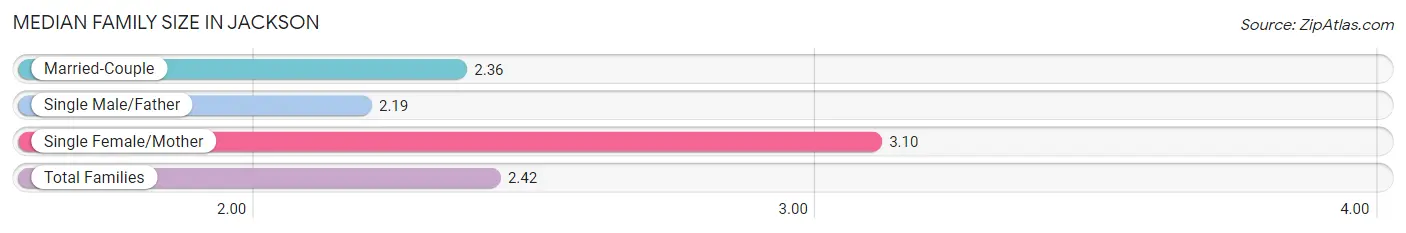
| Family Type | # Families | Family Size |
| Married-Couple | 482 (81.0%) | 2.36 |
| Single Male/Father | 53 (8.9%) | 2.19 |
| Single Female/Mother | 60 (10.1%) | 3.10 |
| Total Families | 595 (100.0%) | 2.42 |
Median Household Size in Jackson
The median household size in Jackson is 1.94 persons per household, with single female/mother households (60 | 6.2%) accounting for the largest median household size of 3.12 persons per household. non-family households (372 | 38.5%) represent the smallest median household size with 1.12 persons per household.
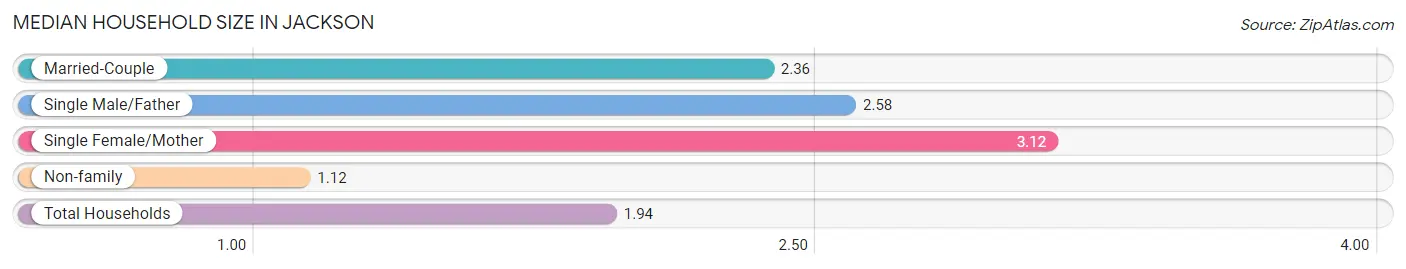
| Household Type | # Households | Household Size |
| Married-Couple | 482 (49.8%) | 2.36 |
| Single Male/Father | 53 (5.5%) | 2.58 |
| Single Female/Mother | 60 (6.2%) | 3.12 |
| Non-family | 372 (38.5%) | 1.12 |
| Total Households | 967 (100.0%) | 1.94 |
Household Size by Marriage Status in Jackson
Out of a total of 967 households in Jackson, 595 (61.5%) are family households, while 372 (38.5%) are nonfamily households. The most numerous type of family households are 2-person households, comprising 418, and the most common type of nonfamily households are 1-person households, comprising 327.
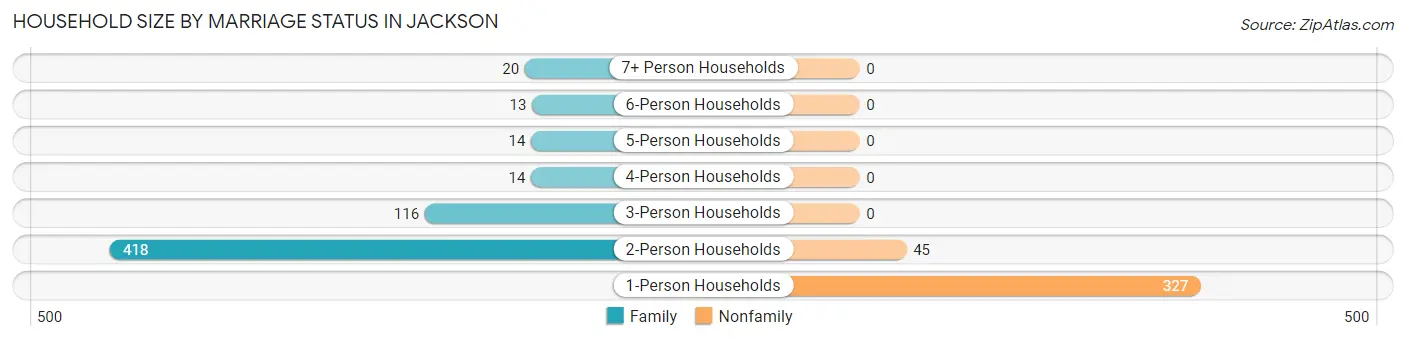
| Household Size | Family Households | Nonfamily Households |
| 1-Person Households | - | 327 (33.8%) |
| 2-Person Households | 418 (43.2%) | 45 (4.6%) |
| 3-Person Households | 116 (12.0%) | 0 (0.0%) |
| 4-Person Households | 14 (1.5%) | 0 (0.0%) |
| 5-Person Households | 14 (1.5%) | 0 (0.0%) |
| 6-Person Households | 13 (1.3%) | 0 (0.0%) |
| 7+ Person Households | 20 (2.1%) | 0 (0.0%) |
| Total | 595 (61.5%) | 372 (38.5%) |
Female Fertility in Jackson
Fertility by Age in Jackson
Average fertility rate in Jackson is 12.0 births per 1,000 women. Women in the age bracket of 20 to 34 years have the highest fertility rate with 33.0 births per 1,000 women. Women in the age bracket of 20 to 34 years acount for 100.0% of all women with births.
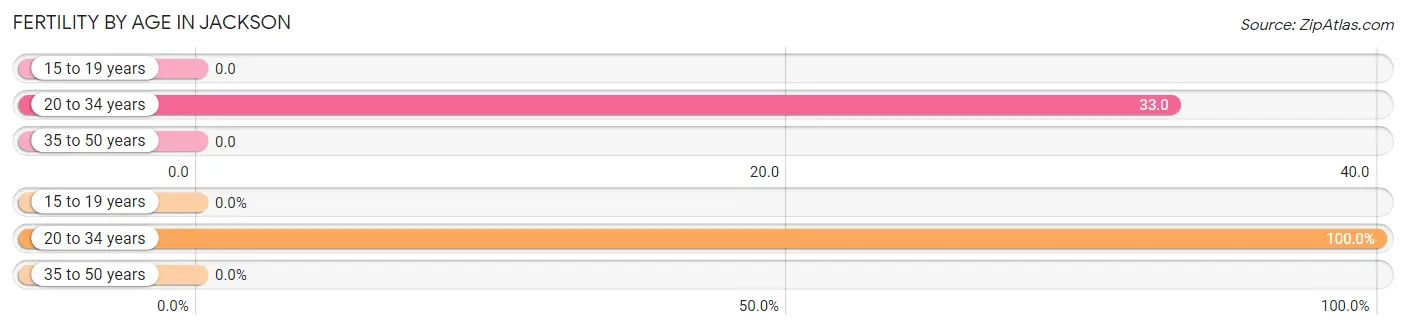
| Age Bracket | Women with Births | Births / 1,000 Women |
| 15 to 19 years | 0 (0.0%) | 0.0 |
| 20 to 34 years | 4 (100.0%) | 33.0 |
| 35 to 50 years | 0 (0.0%) | 0.0 |
| Total | 4 (100.0%) | 12.0 |
Fertility by Age by Marriage Status in Jackson
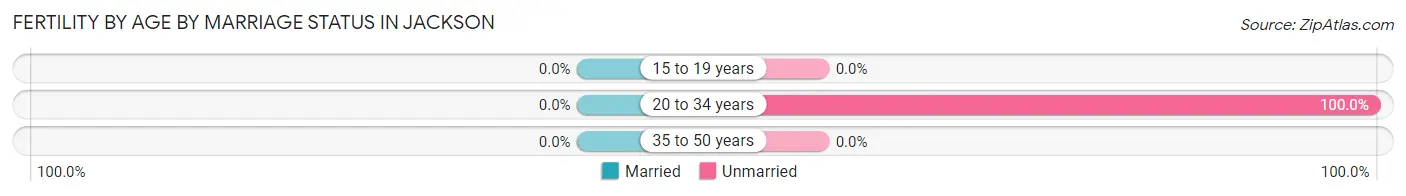
| Age Bracket | Married | Unmarried |
| 15 to 19 years | 0 (0.0%) | 0 (0.0%) |
| 20 to 34 years | 0 (0.0%) | 4 (100.0%) |
| 35 to 50 years | 0 (0.0%) | 0 (0.0%) |
| Total | 0 (0.0%) | 4 (100.0%) |
Fertility by Education in Jackson
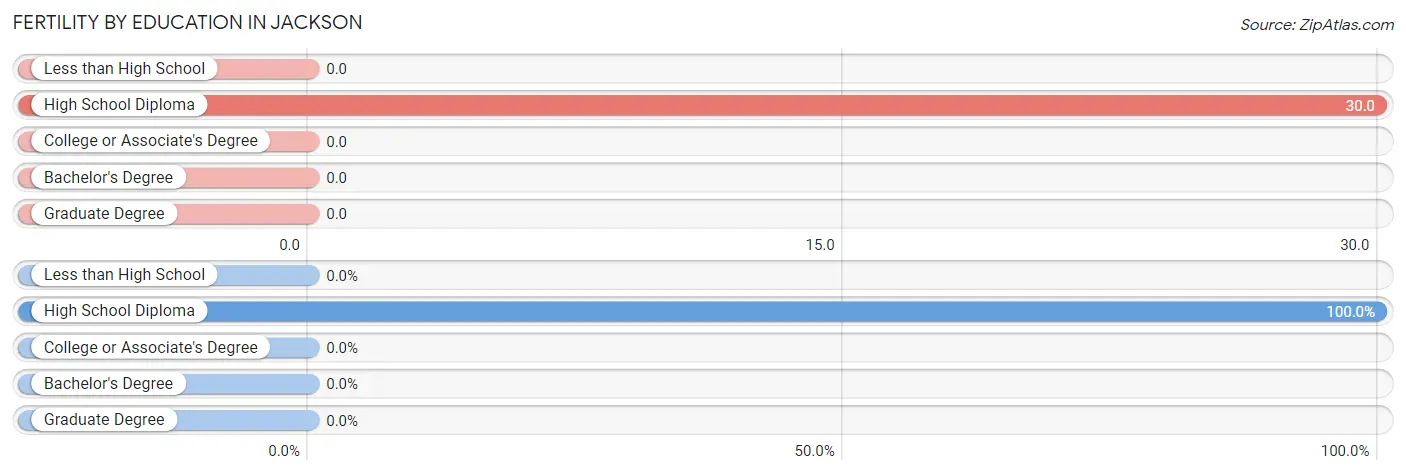
| Educational Attainment | Women with Births | Births / 1,000 Women |
| Less than High School | 0 (0.0%) | 0.0 |
| High School Diploma | 4 (100.0%) | 30.0 |
| College or Associate's Degree | 0 (0.0%) | 0.0 |
| Bachelor's Degree | 0 (0.0%) | 0.0 |
| Graduate Degree | 0 (0.0%) | 0.0 |
| Total | 4 (100.0%) | 12.0 |
Fertility by Education by Marriage Status in Jackson
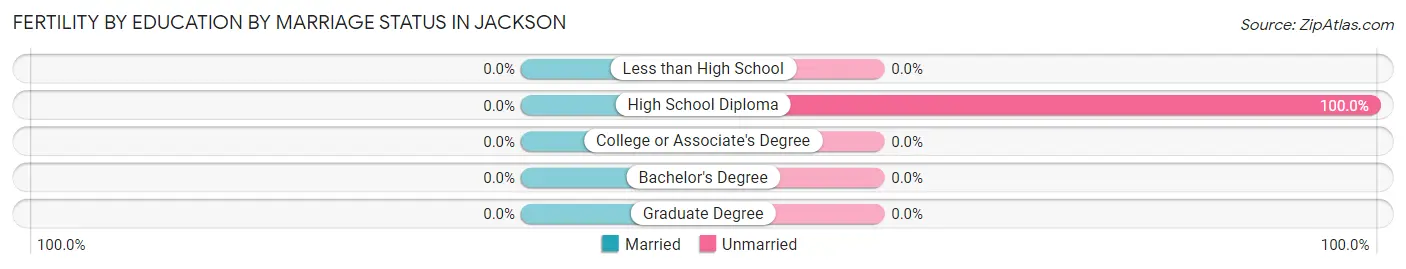
| Educational Attainment | Married | Unmarried |
| Less than High School | 0 (0.0%) | 0 (0.0%) |
| High School Diploma | 0 (0.0%) | 4 (100.0%) |
| College or Associate's Degree | 0 (0.0%) | 0 (0.0%) |
| Bachelor's Degree | 0 (0.0%) | 0 (0.0%) |
| Graduate Degree | 0 (0.0%) | 0 (0.0%) |
| Total | 0 (0.0%) | 4 (100.0%) |
Employment Characteristics in Jackson
Employment by Class of Employer in Jackson
Among the 748 employed individuals in Jackson, private company employees (573 | 76.6%), local government employees (65 | 8.7%), and federal government employees (36 | 4.8%) make up the most common classes of employment.
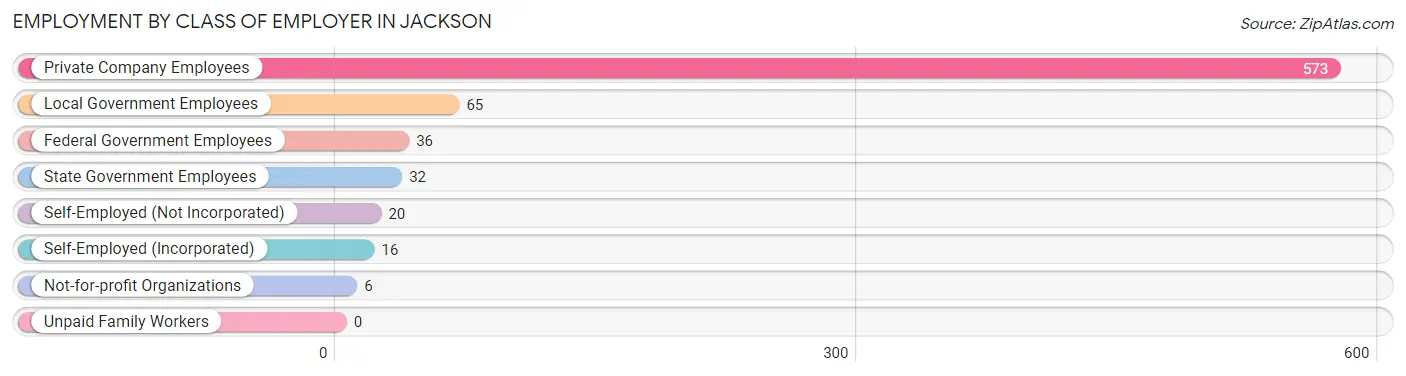
| Employer Class | # Employees | % Employees |
| Private Company Employees | 573 | 76.6% |
| Self-Employed (Incorporated) | 16 | 2.1% |
| Self-Employed (Not Incorporated) | 20 | 2.7% |
| Not-for-profit Organizations | 6 | 0.8% |
| Local Government Employees | 65 | 8.7% |
| State Government Employees | 32 | 4.3% |
| Federal Government Employees | 36 | 4.8% |
| Unpaid Family Workers | 0 | 0.0% |
| Total | 748 | 100.0% |
Employment Status by Age in Jackson
According to the labor force statistics for Jackson, out of the total population over 16 years of age (1,609), 48.6% or 782 individuals are in the labor force, with 3.6% or 28 of them unemployed. The age group with the highest labor force participation rate is 30 to 34 years, with 94.6% or 53 individuals in the labor force. Within the labor force, the 35 to 44 years age range has the highest percentage of unemployed individuals, with 8.2% or 8 of them being unemployed.
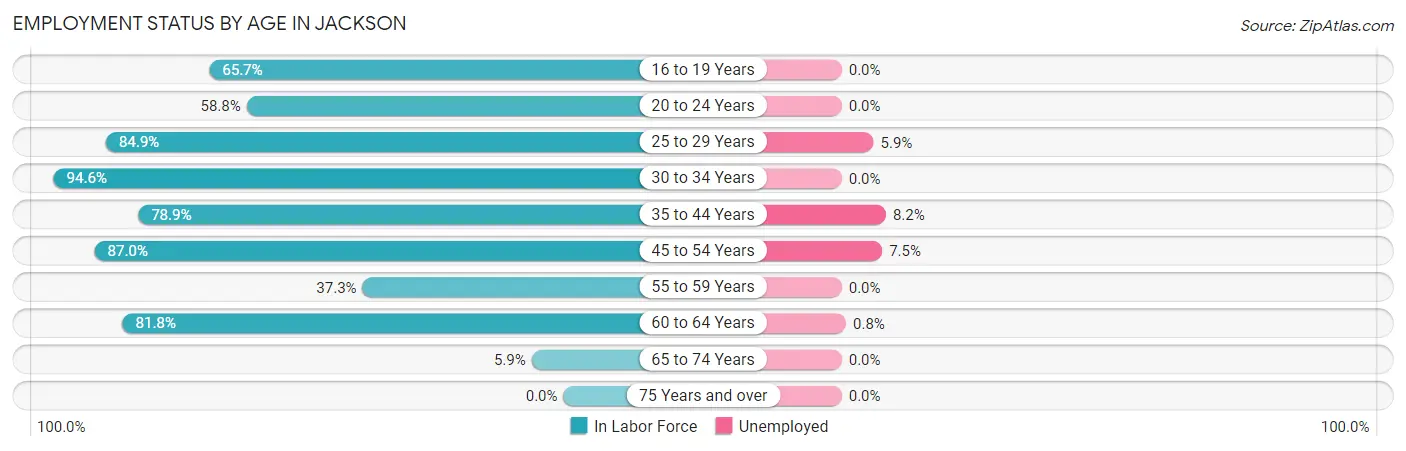
| Age Bracket | In Labor Force | Unemployed |
| 16 to 19 Years | 44 (65.7%) | 0 (0.0%) |
| 20 to 24 Years | 30 (58.8%) | 0 (0.0%) |
| 25 to 29 Years | 101 (84.9%) | 6 (5.9%) |
| 30 to 34 Years | 53 (94.6%) | 0 (0.0%) |
| 35 to 44 Years | 97 (78.9%) | 8 (8.2%) |
| 45 to 54 Years | 160 (87.0%) | 12 (7.5%) |
| 55 to 59 Years | 44 (37.3%) | 0 (0.0%) |
| 60 to 64 Years | 239 (81.8%) | 2 (0.8%) |
| 65 to 74 Years | 14 (5.9%) | 0 (0.0%) |
| 75 Years and over | 0 (0.0%) | 0 (0.0%) |
| Total | 782 (48.6%) | 28 (3.6%) |
Employment Status by Educational Attainment in Jackson
According to labor force statistics for Jackson, 77.8% of individuals (694) out of the total population between 25 and 64 years of age (892) are in the labor force, with 4.0% or 28 of them being unemployed. The group with the highest labor force participation rate are those with the educational attainment of less than high school, with 84.1% or 174 individuals in the labor force. Within the labor force, individuals with high school diploma education have the highest percentage of unemployment, with 7.1% or 19 of them being unemployed.
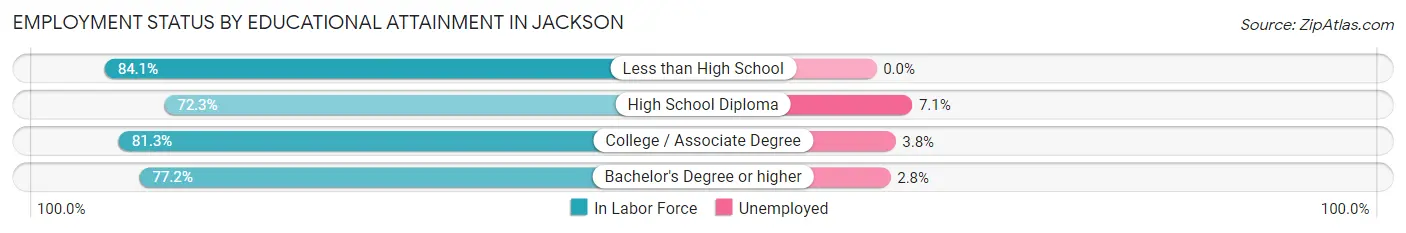
| Educational Attainment | In Labor Force | Unemployed |
| Less than High School | 174 (84.1%) | 0 (0.0%) |
| High School Diploma | 266 (72.3%) | 26 (7.1%) |
| College / Associate Degree | 183 (81.3%) | 9 (3.8%) |
| Bachelor's Degree or higher | 71 (77.2%) | 3 (2.8%) |
| Total | 694 (77.8%) | 36 (4.0%) |
Employment Occupations by Sex in Jackson
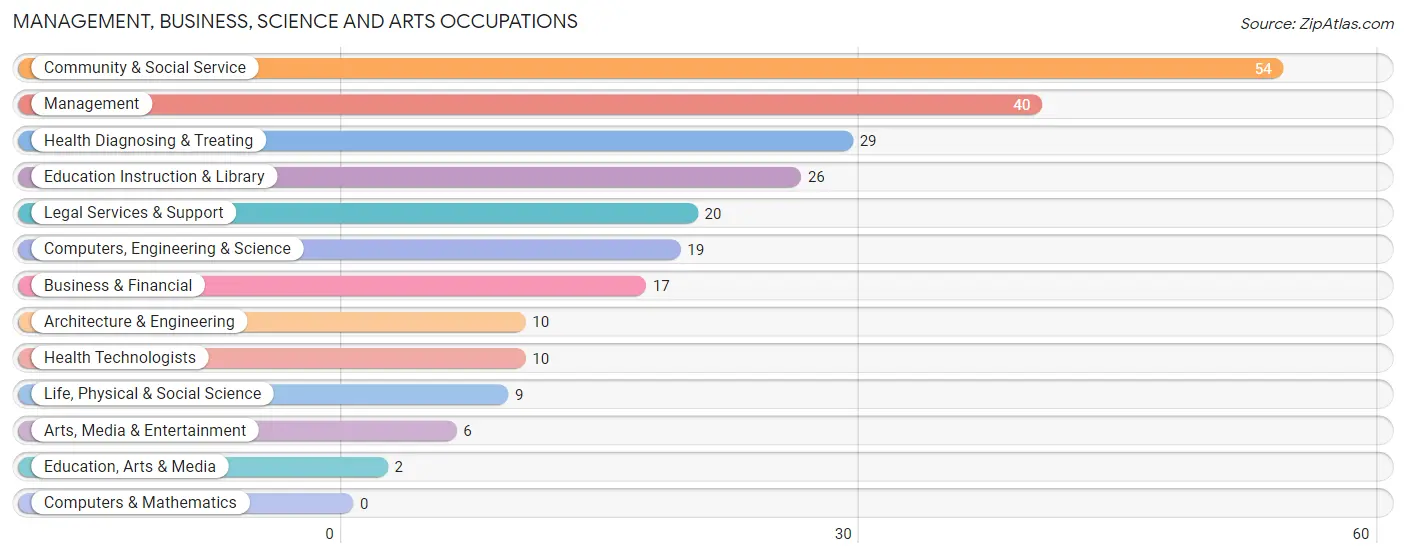
Management, Business, Science and Arts Occupations
The most common Management, Business, Science and Arts occupations in Jackson are Community & Social Service (54 | 7.2%), Management (40 | 5.3%), Health Diagnosing & Treating (29 | 3.8%), Education Instruction & Library (26 | 3.5%), and Legal Services & Support (20 | 2.6%).
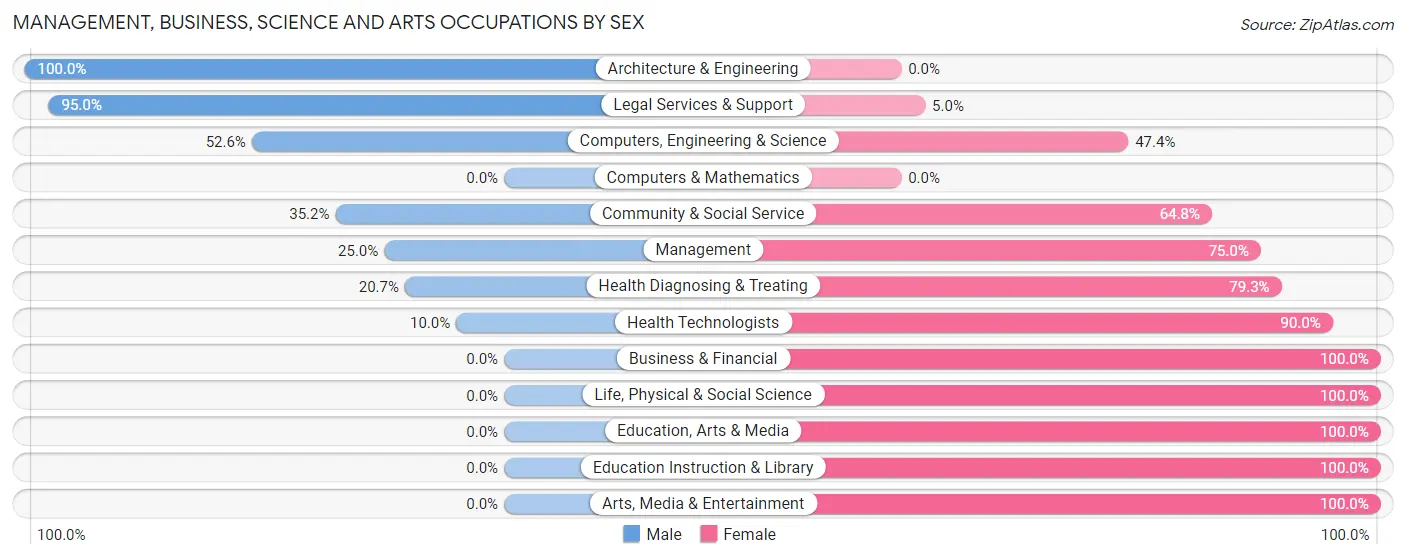
Management, Business, Science and Arts Occupations by Sex
Within the Management, Business, Science and Arts occupations in Jackson, the most male-oriented occupations are Architecture & Engineering (100.0%), Legal Services & Support (95.0%), and Computers, Engineering & Science (52.6%), while the most female-oriented occupations are Business & Financial (100.0%), Life, Physical & Social Science (100.0%), and Education, Arts & Media (100.0%).
| Occupation | Male | Female |
| Management | 10 (25.0%) | 30 (75.0%) |
| Business & Financial | 0 (0.0%) | 17 (100.0%) |
| Computers, Engineering & Science | 10 (52.6%) | 9 (47.4%) |
| Computers & Mathematics | 0 (0.0%) | 0 (0.0%) |
| Architecture & Engineering | 10 (100.0%) | 0 (0.0%) |
| Life, Physical & Social Science | 0 (0.0%) | 9 (100.0%) |
| Community & Social Service | 19 (35.2%) | 35 (64.8%) |
| Education, Arts & Media | 0 (0.0%) | 2 (100.0%) |
| Legal Services & Support | 19 (95.0%) | 1 (5.0%) |
| Education Instruction & Library | 0 (0.0%) | 26 (100.0%) |
| Arts, Media & Entertainment | 0 (0.0%) | 6 (100.0%) |
| Health Diagnosing & Treating | 6 (20.7%) | 23 (79.3%) |
| Health Technologists | 1 (10.0%) | 9 (90.0%) |
| Total (Category) | 45 (28.3%) | 114 (71.7%) |
| Total (Overall) | 419 (55.6%) | 335 (44.4%) |
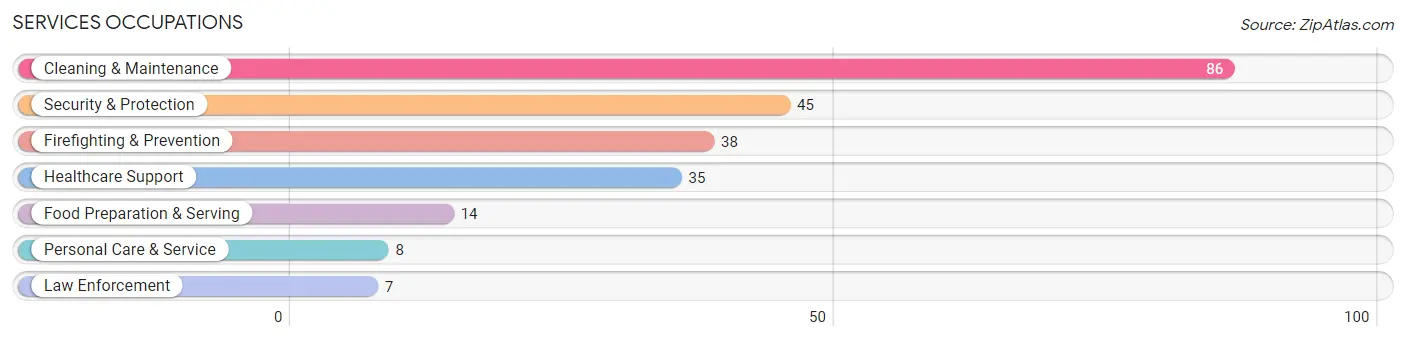
Services Occupations
The most common Services occupations in Jackson are Cleaning & Maintenance (86 | 11.4%), Security & Protection (45 | 6.0%), Firefighting & Prevention (38 | 5.0%), Healthcare Support (35 | 4.6%), and Food Preparation & Serving (14 | 1.9%).
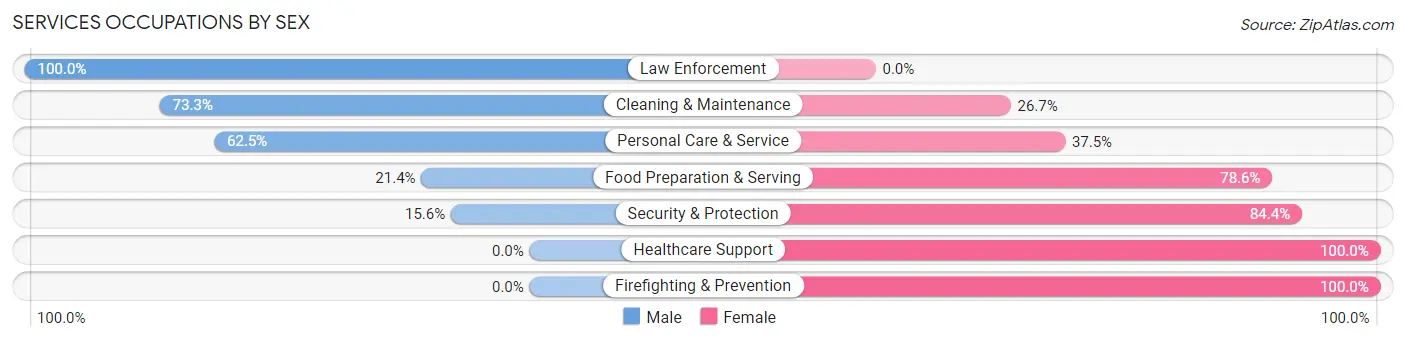
Services Occupations by Sex
Within the Services occupations in Jackson, the most male-oriented occupations are Law Enforcement (100.0%), Cleaning & Maintenance (73.3%), and Personal Care & Service (62.5%), while the most female-oriented occupations are Healthcare Support (100.0%), Firefighting & Prevention (100.0%), and Security & Protection (84.4%).
| Occupation | Male | Female |
| Healthcare Support | 0 (0.0%) | 35 (100.0%) |
| Security & Protection | 7 (15.6%) | 38 (84.4%) |
| Firefighting & Prevention | 0 (0.0%) | 38 (100.0%) |
| Law Enforcement | 7 (100.0%) | 0 (0.0%) |
| Food Preparation & Serving | 3 (21.4%) | 11 (78.6%) |
| Cleaning & Maintenance | 63 (73.3%) | 23 (26.7%) |
| Personal Care & Service | 5 (62.5%) | 3 (37.5%) |
| Total (Category) | 78 (41.5%) | 110 (58.5%) |
| Total (Overall) | 419 (55.6%) | 335 (44.4%) |
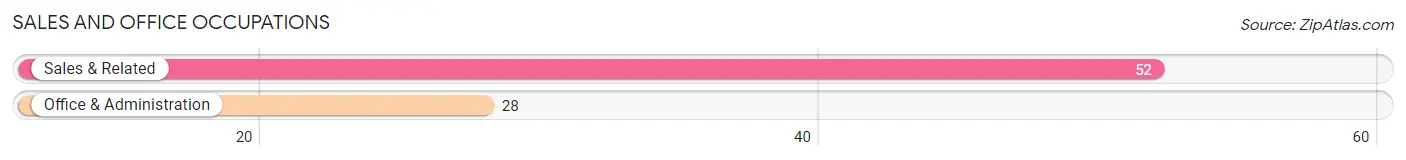
Sales and Office Occupations
The most common Sales and Office occupations in Jackson are Sales & Related (52 | 6.9%), and Office & Administration (28 | 3.7%).
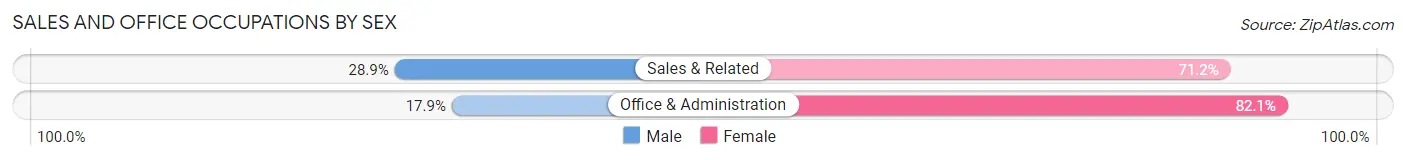
Sales and Office Occupations by Sex
| Occupation | Male | Female |
| Sales & Related | 15 (28.8%) | 37 (71.2%) |
| Office & Administration | 5 (17.9%) | 23 (82.1%) |
| Total (Category) | 20 (25.0%) | 60 (75.0%) |
| Total (Overall) | 419 (55.6%) | 335 (44.4%) |
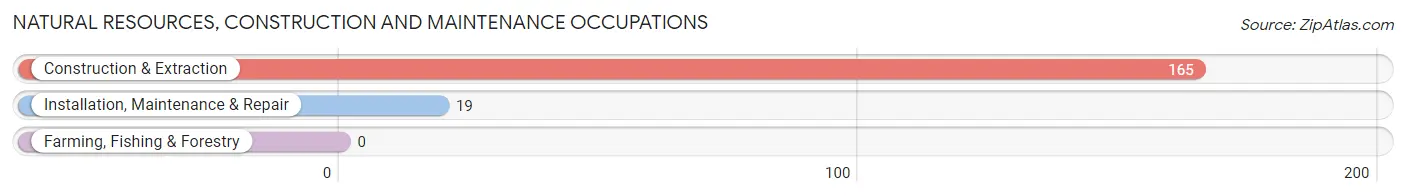
Natural Resources, Construction and Maintenance Occupations
The most common Natural Resources, Construction and Maintenance occupations in Jackson are Construction & Extraction (165 | 21.9%), and Installation, Maintenance & Repair (19 | 2.5%).
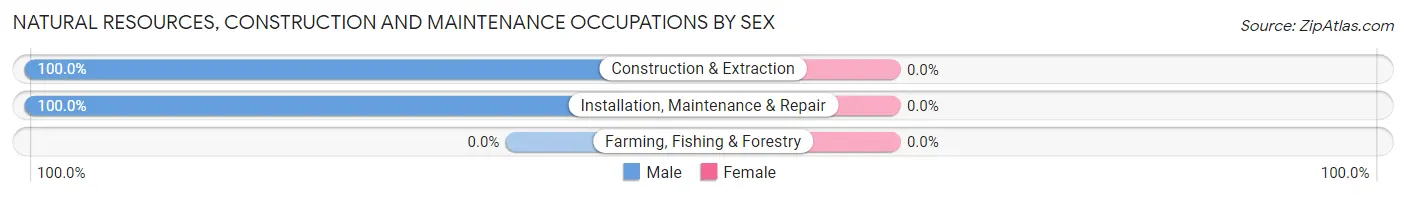
Natural Resources, Construction and Maintenance Occupations by Sex
| Occupation | Male | Female |
| Farming, Fishing & Forestry | 0 (0.0%) | 0 (0.0%) |
| Construction & Extraction | 165 (100.0%) | 0 (0.0%) |
| Installation, Maintenance & Repair | 19 (100.0%) | 0 (0.0%) |
| Total (Category) | 184 (100.0%) | 0 (0.0%) |
| Total (Overall) | 419 (55.6%) | 335 (44.4%) |
Production, Transportation and Moving Occupations
The most common Production, Transportation and Moving occupations in Jackson are Production (83 | 11.0%), Material Moving (52 | 6.9%), and Transportation (8 | 1.1%).
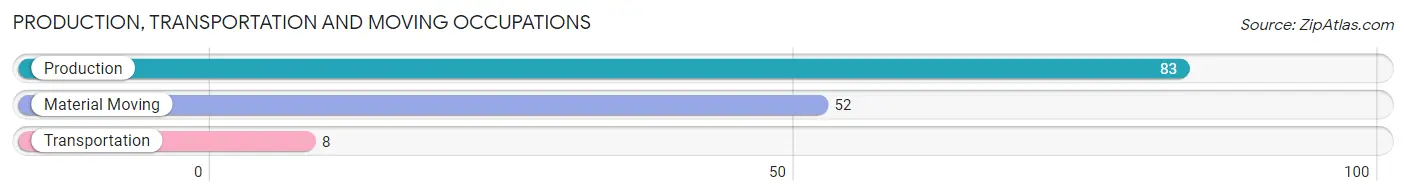
Production, Transportation and Moving Occupations by Sex
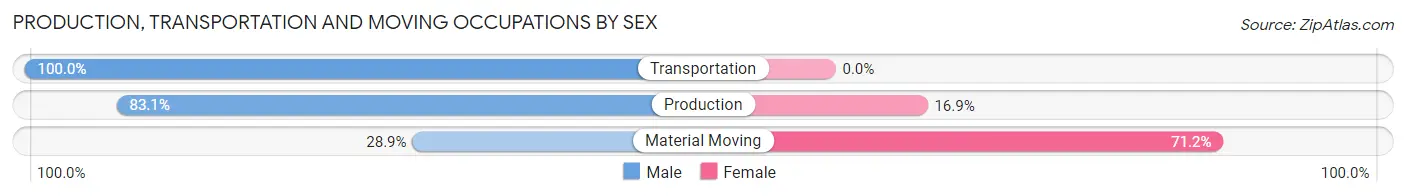
| Occupation | Male | Female |
| Production | 69 (83.1%) | 14 (16.9%) |
| Transportation | 8 (100.0%) | 0 (0.0%) |
| Material Moving | 15 (28.8%) | 37 (71.2%) |
| Total (Category) | 92 (64.3%) | 51 (35.7%) |
| Total (Overall) | 419 (55.6%) | 335 (44.4%) |
Employment Industries by Sex in Jackson
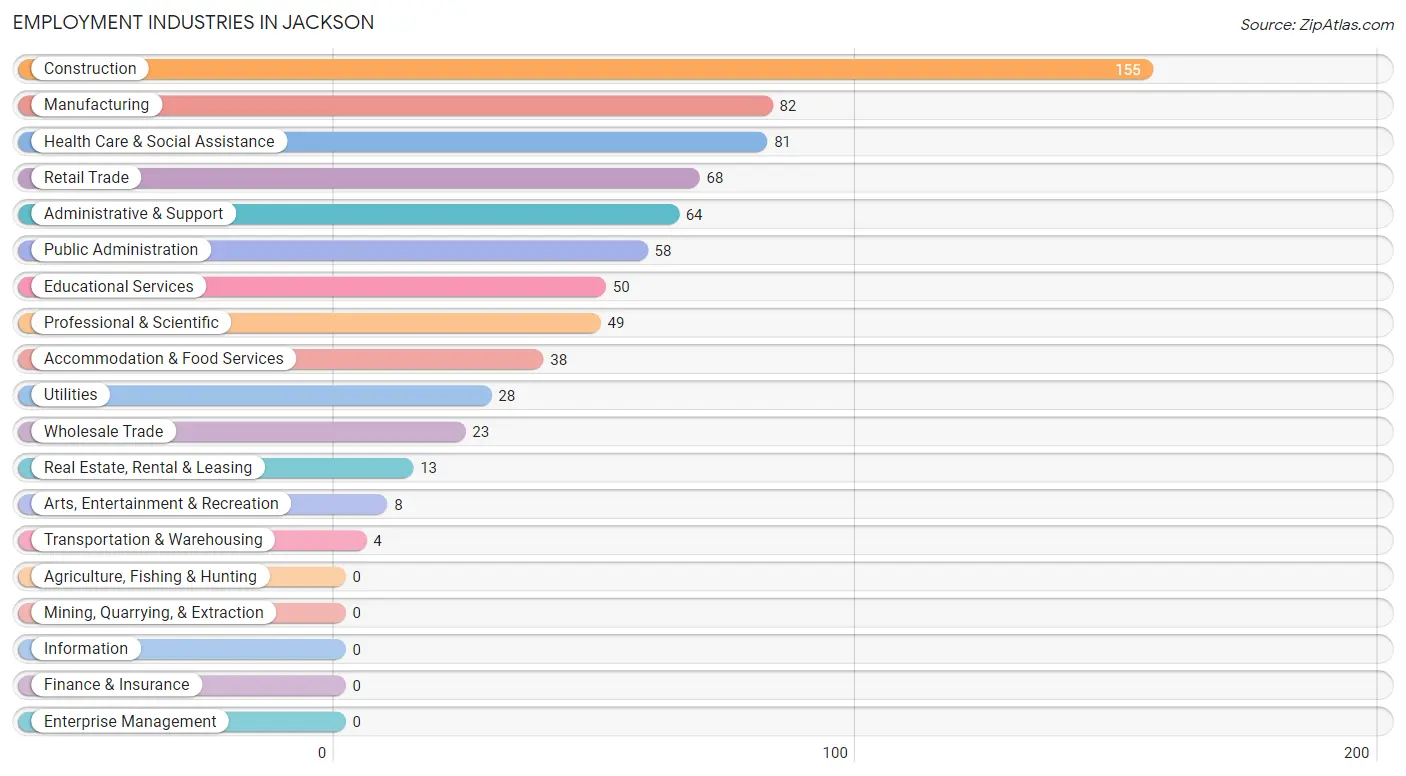
Employment Industries in Jackson
The major employment industries in Jackson include Construction (155 | 20.6%), Manufacturing (82 | 10.9%), Health Care & Social Assistance (81 | 10.7%), Retail Trade (68 | 9.0%), and Administrative & Support (64 | 8.5%).
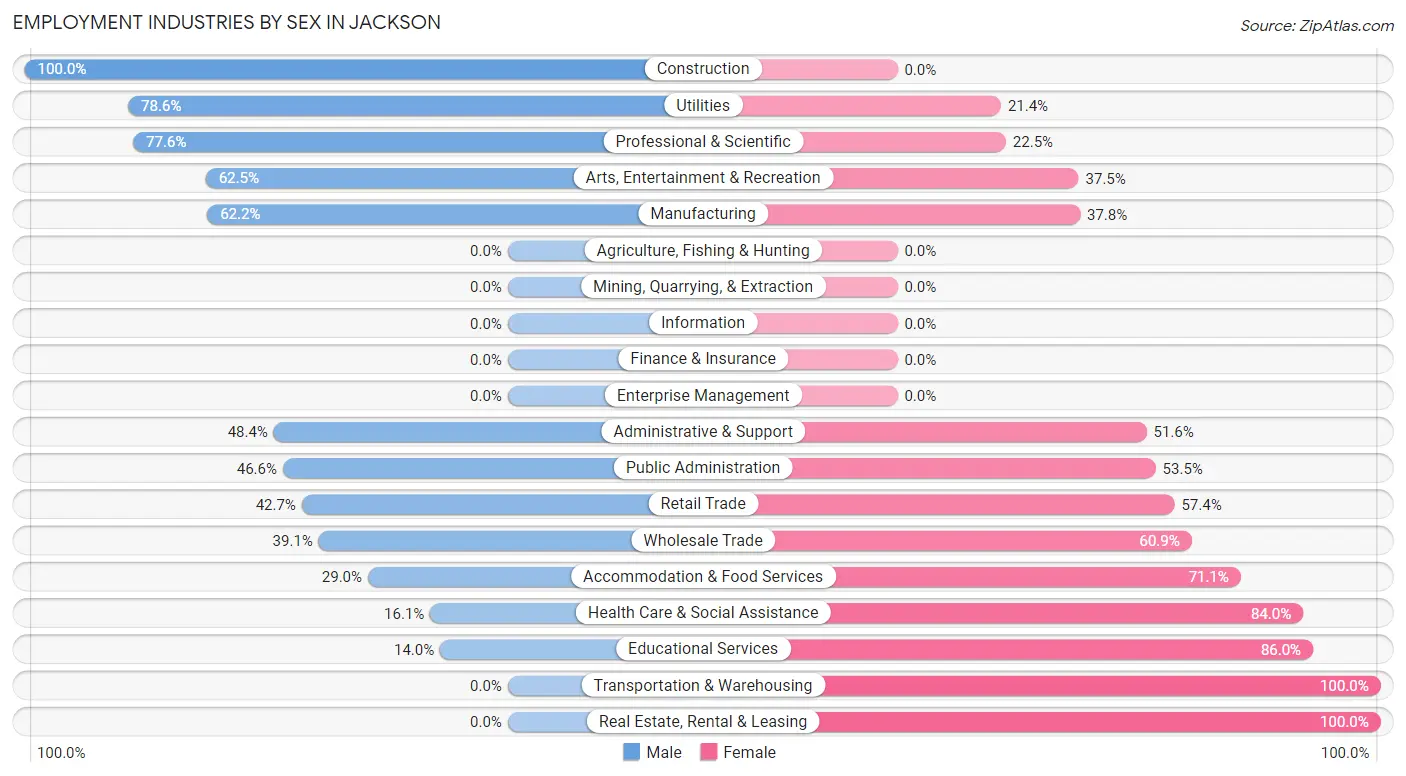
Employment Industries by Sex in Jackson
The Jackson industries that see more men than women are Construction (100.0%), Utilities (78.6%), and Professional & Scientific (77.5%), whereas the industries that tend to have a higher number of women are Transportation & Warehousing (100.0%), Real Estate, Rental & Leasing (100.0%), and Educational Services (86.0%).
| Industry | Male | Female |
| Agriculture, Fishing & Hunting | 0 (0.0%) | 0 (0.0%) |
| Mining, Quarrying, & Extraction | 0 (0.0%) | 0 (0.0%) |
| Construction | 155 (100.0%) | 0 (0.0%) |
| Manufacturing | 51 (62.2%) | 31 (37.8%) |
| Wholesale Trade | 9 (39.1%) | 14 (60.9%) |
| Retail Trade | 29 (42.6%) | 39 (57.4%) |
| Transportation & Warehousing | 0 (0.0%) | 4 (100.0%) |
| Utilities | 22 (78.6%) | 6 (21.4%) |
| Information | 0 (0.0%) | 0 (0.0%) |
| Finance & Insurance | 0 (0.0%) | 0 (0.0%) |
| Real Estate, Rental & Leasing | 0 (0.0%) | 13 (100.0%) |
| Professional & Scientific | 38 (77.5%) | 11 (22.5%) |
| Enterprise Management | 0 (0.0%) | 0 (0.0%) |
| Administrative & Support | 31 (48.4%) | 33 (51.6%) |
| Educational Services | 7 (14.0%) | 43 (86.0%) |
| Health Care & Social Assistance | 13 (16.1%) | 68 (84.0%) |
| Arts, Entertainment & Recreation | 5 (62.5%) | 3 (37.5%) |
| Accommodation & Food Services | 11 (28.9%) | 27 (71.1%) |
| Public Administration | 27 (46.6%) | 31 (53.4%) |
| Total | 419 (55.6%) | 335 (44.4%) |
Education in Jackson
School Enrollment in Jackson
The most common levels of schooling among the 257 students in Jackson are high school (64 | 24.9%), elementary school (62 | 24.1%), and middle school (60 | 23.4%).
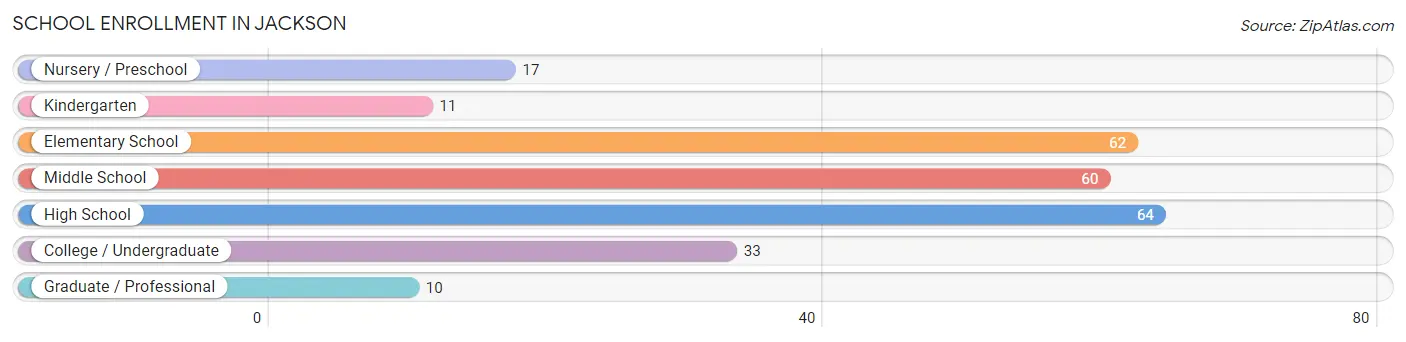
| School Level | # Students | % Students |
| Nursery / Preschool | 17 | 6.6% |
| Kindergarten | 11 | 4.3% |
| Elementary School | 62 | 24.1% |
| Middle School | 60 | 23.4% |
| High School | 64 | 24.9% |
| College / Undergraduate | 33 | 12.8% |
| Graduate / Professional | 10 | 3.9% |
| Total | 257 | 100.0% |
School Enrollment by Age by Funding Source in Jackson
Out of a total of 257 students who are enrolled in schools in Jackson, 28 (10.9%) attend a private institution, while the remaining 229 (89.1%) are enrolled in public schools. The age group of 3 to 4 year olds has the highest likelihood of being enrolled in private schools, with 15 (88.2% in the age bracket) enrolled. Conversely, the age group of 5 to 9 year old has the lowest likelihood of being enrolled in a private school, with 59 (100.0% in the age bracket) attending a public institution.
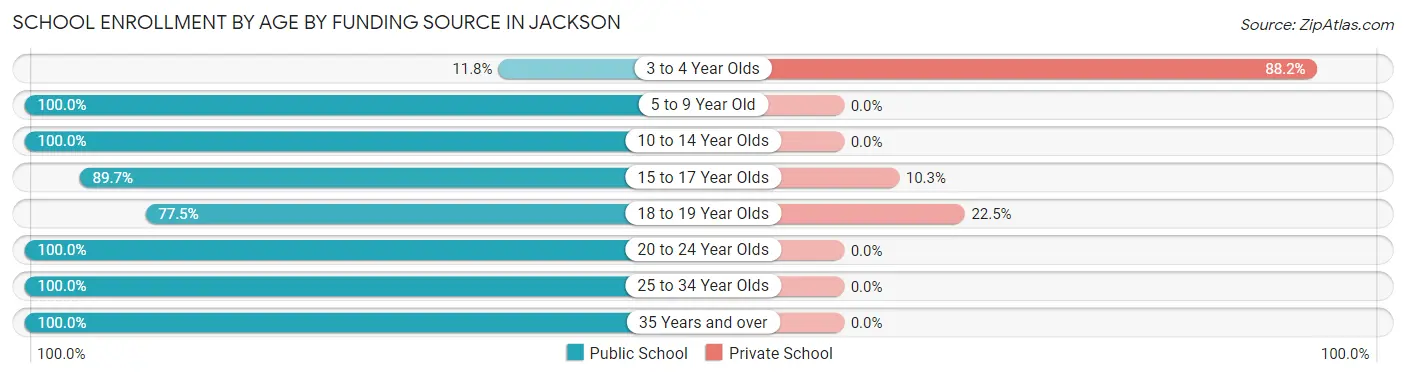
| Age Bracket | Public School | Private School |
| 3 to 4 Year Olds | 2 (11.8%) | 15 (88.2%) |
| 5 to 9 Year Old | 59 (100.0%) | 0 (0.0%) |
| 10 to 14 Year Olds | 78 (100.0%) | 0 (0.0%) |
| 15 to 17 Year Olds | 35 (89.7%) | 4 (10.3%) |
| 18 to 19 Year Olds | 31 (77.5%) | 9 (22.5%) |
| 20 to 24 Year Olds | 16 (100.0%) | 0 (0.0%) |
| 25 to 34 Year Olds | 1 (100.0%) | 0 (0.0%) |
| 35 Years and over | 7 (100.0%) | 0 (0.0%) |
| Total | 229 (89.1%) | 28 (10.9%) |
Educational Attainment by Field of Study in Jackson
Business (37 | 21.9%), arts & humanities (35 | 20.7%), education (34 | 20.1%), science & technology (17 | 10.1%), and engineering (11 | 6.5%) are the most common fields of study among 169 individuals in Jackson who have obtained a bachelor's degree or higher.
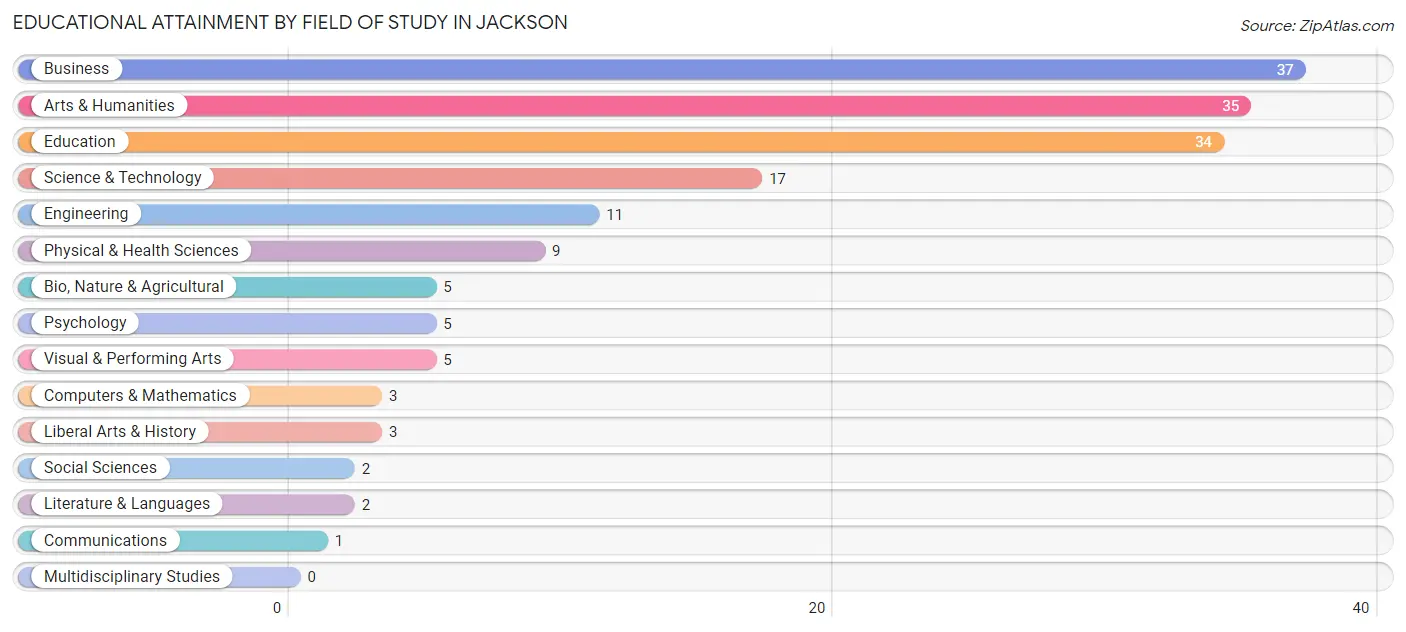
| Field of Study | # Graduates | % Graduates |
| Computers & Mathematics | 3 | 1.8% |
| Bio, Nature & Agricultural | 5 | 3.0% |
| Physical & Health Sciences | 9 | 5.3% |
| Psychology | 5 | 3.0% |
| Social Sciences | 2 | 1.2% |
| Engineering | 11 | 6.5% |
| Multidisciplinary Studies | 0 | 0.0% |
| Science & Technology | 17 | 10.1% |
| Business | 37 | 21.9% |
| Education | 34 | 20.1% |
| Literature & Languages | 2 | 1.2% |
| Liberal Arts & History | 3 | 1.8% |
| Visual & Performing Arts | 5 | 3.0% |
| Communications | 1 | 0.6% |
| Arts & Humanities | 35 | 20.7% |
| Total | 169 | 100.0% |
Transportation & Commute in Jackson
Vehicle Availability by Sex in Jackson
The most prevalent vehicle ownership categories in Jackson are males with no vehicle (129, accounting for 31.2%) and females with no vehicle (0, making up 38.9%).
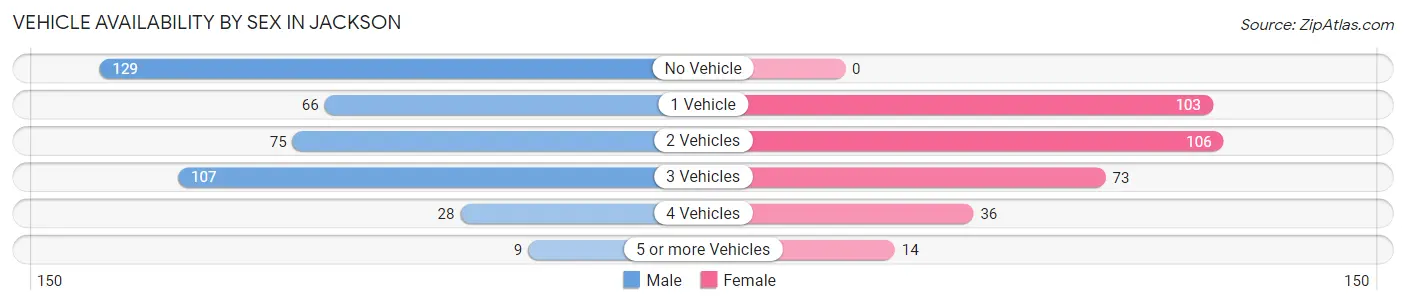
| Vehicles Available | Male | Female |
| No Vehicle | 129 (31.2%) | 0 (0.0%) |
| 1 Vehicle | 66 (15.9%) | 103 (31.0%) |
| 2 Vehicles | 75 (18.1%) | 106 (31.9%) |
| 3 Vehicles | 107 (25.9%) | 73 (22.0%) |
| 4 Vehicles | 28 (6.8%) | 36 (10.8%) |
| 5 or more Vehicles | 9 (2.2%) | 14 (4.2%) |
| Total | 414 (100.0%) | 332 (100.0%) |
Commute Time in Jackson
The most frequently occuring commute durations in Jackson are 10 to 14 minutes (181 commuters, 25.2%), 30 to 34 minutes (174 commuters, 24.2%), and 15 to 19 minutes (106 commuters, 14.7%).
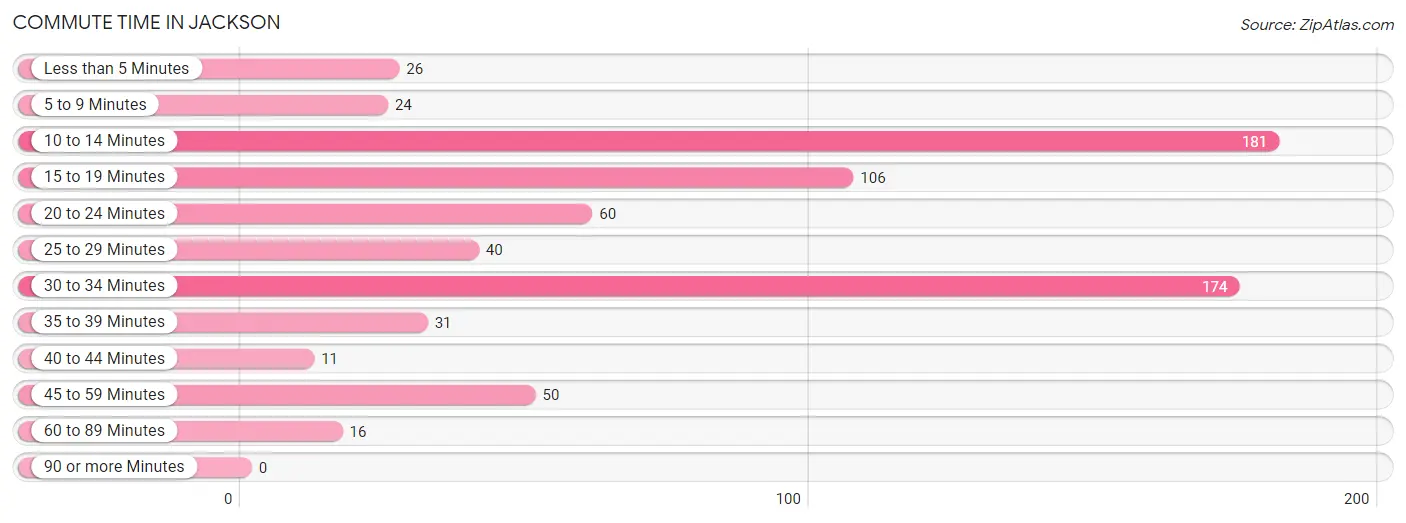
| Commute Time | # Commuters | % Commuters |
| Less than 5 Minutes | 26 | 3.6% |
| 5 to 9 Minutes | 24 | 3.3% |
| 10 to 14 Minutes | 181 | 25.2% |
| 15 to 19 Minutes | 106 | 14.7% |
| 20 to 24 Minutes | 60 | 8.3% |
| 25 to 29 Minutes | 40 | 5.6% |
| 30 to 34 Minutes | 174 | 24.2% |
| 35 to 39 Minutes | 31 | 4.3% |
| 40 to 44 Minutes | 11 | 1.5% |
| 45 to 59 Minutes | 50 | 7.0% |
| 60 to 89 Minutes | 16 | 2.2% |
| 90 or more Minutes | 0 | 0.0% |
Commute Time by Sex in Jackson
The most common commute times in Jackson are 10 to 14 minutes (156 commuters, 38.1%) for males and 30 to 34 minutes (114 commuters, 36.8%) for females.
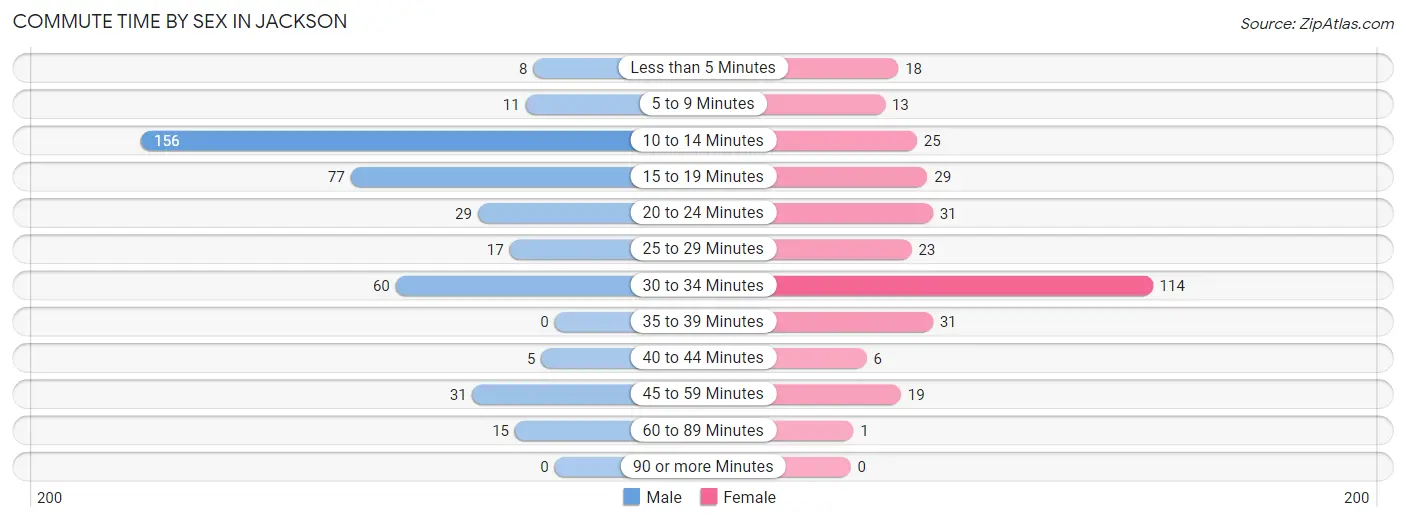
| Commute Time | Male | Female |
| Less than 5 Minutes | 8 (2.0%) | 18 (5.8%) |
| 5 to 9 Minutes | 11 (2.7%) | 13 (4.2%) |
| 10 to 14 Minutes | 156 (38.1%) | 25 (8.1%) |
| 15 to 19 Minutes | 77 (18.8%) | 29 (9.3%) |
| 20 to 24 Minutes | 29 (7.1%) | 31 (10.0%) |
| 25 to 29 Minutes | 17 (4.2%) | 23 (7.4%) |
| 30 to 34 Minutes | 60 (14.7%) | 114 (36.8%) |
| 35 to 39 Minutes | 0 (0.0%) | 31 (10.0%) |
| 40 to 44 Minutes | 5 (1.2%) | 6 (1.9%) |
| 45 to 59 Minutes | 31 (7.6%) | 19 (6.1%) |
| 60 to 89 Minutes | 15 (3.7%) | 1 (0.3%) |
| 90 or more Minutes | 0 (0.0%) | 0 (0.0%) |
Time of Departure to Work by Sex in Jackson
The most frequent times of departure to work in Jackson are 6:30 AM to 6:59 AM (160, 39.1%) for males and 12:00 AM to 4:59 AM (52, 16.8%) for females.
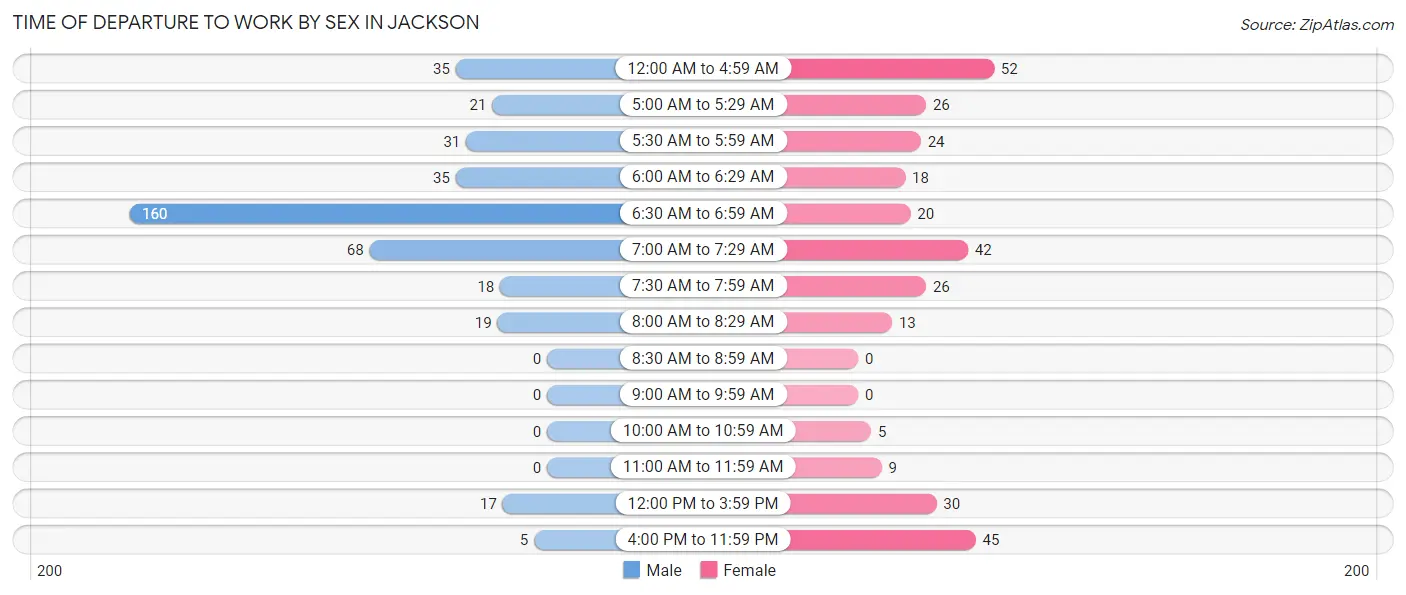
| Time of Departure | Male | Female |
| 12:00 AM to 4:59 AM | 35 (8.6%) | 52 (16.8%) |
| 5:00 AM to 5:29 AM | 21 (5.1%) | 26 (8.4%) |
| 5:30 AM to 5:59 AM | 31 (7.6%) | 24 (7.7%) |
| 6:00 AM to 6:29 AM | 35 (8.6%) | 18 (5.8%) |
| 6:30 AM to 6:59 AM | 160 (39.1%) | 20 (6.5%) |
| 7:00 AM to 7:29 AM | 68 (16.6%) | 42 (13.6%) |
| 7:30 AM to 7:59 AM | 18 (4.4%) | 26 (8.4%) |
| 8:00 AM to 8:29 AM | 19 (4.6%) | 13 (4.2%) |
| 8:30 AM to 8:59 AM | 0 (0.0%) | 0 (0.0%) |
| 9:00 AM to 9:59 AM | 0 (0.0%) | 0 (0.0%) |
| 10:00 AM to 10:59 AM | 0 (0.0%) | 5 (1.6%) |
| 11:00 AM to 11:59 AM | 0 (0.0%) | 9 (2.9%) |
| 12:00 PM to 3:59 PM | 17 (4.2%) | 30 (9.7%) |
| 4:00 PM to 11:59 PM | 5 (1.2%) | 45 (14.5%) |
| Total | 409 (100.0%) | 310 (100.0%) |
Housing Occupancy in Jackson
Occupancy by Ownership in Jackson
Of the total 967 dwellings in Jackson, owner-occupied units account for 736 (76.1%), while renter-occupied units make up 231 (23.9%).
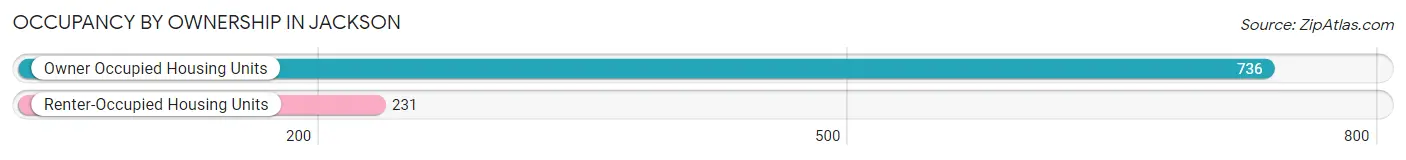
| Occupancy | # Housing Units | % Housing Units |
| Owner Occupied Housing Units | 736 | 76.1% |
| Renter-Occupied Housing Units | 231 | 23.9% |
| Total Occupied Housing Units | 967 | 100.0% |
Occupancy by Household Size in Jackson
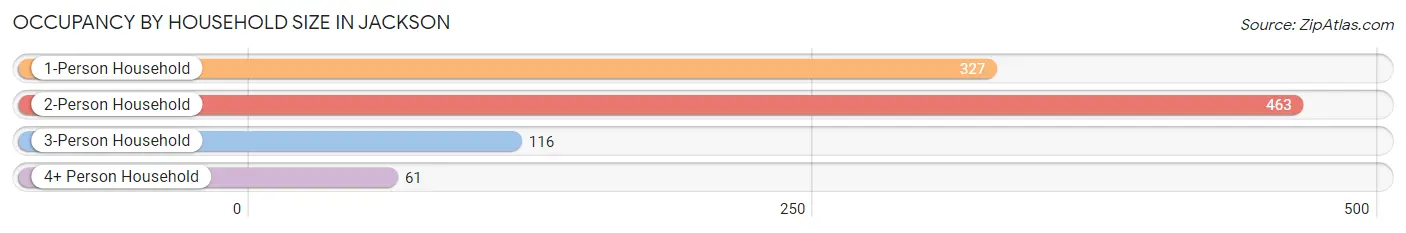
| Household Size | # Housing Units | % Housing Units |
| 1-Person Household | 327 | 33.8% |
| 2-Person Household | 463 | 47.9% |
| 3-Person Household | 116 | 12.0% |
| 4+ Person Household | 61 | 6.3% |
| Total Housing Units | 967 | 100.0% |
Occupancy by Ownership by Household Size in Jackson
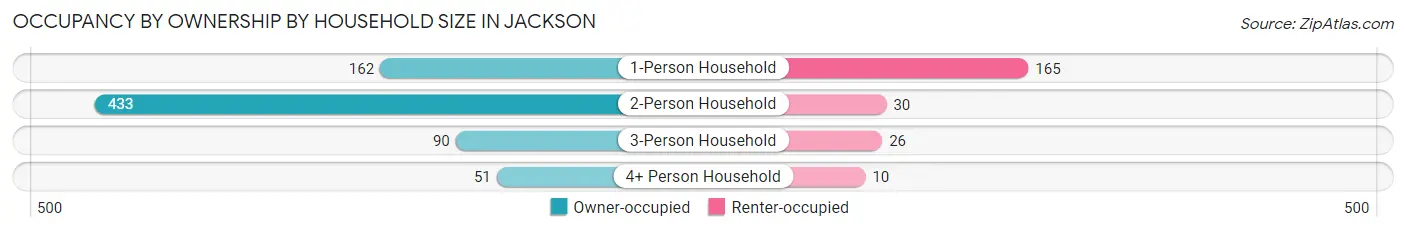
| Household Size | Owner-occupied | Renter-occupied |
| 1-Person Household | 162 (49.5%) | 165 (50.5%) |
| 2-Person Household | 433 (93.5%) | 30 (6.5%) |
| 3-Person Household | 90 (77.6%) | 26 (22.4%) |
| 4+ Person Household | 51 (83.6%) | 10 (16.4%) |
| Total Housing Units | 736 (76.1%) | 231 (23.9%) |
Occupancy by Educational Attainment in Jackson
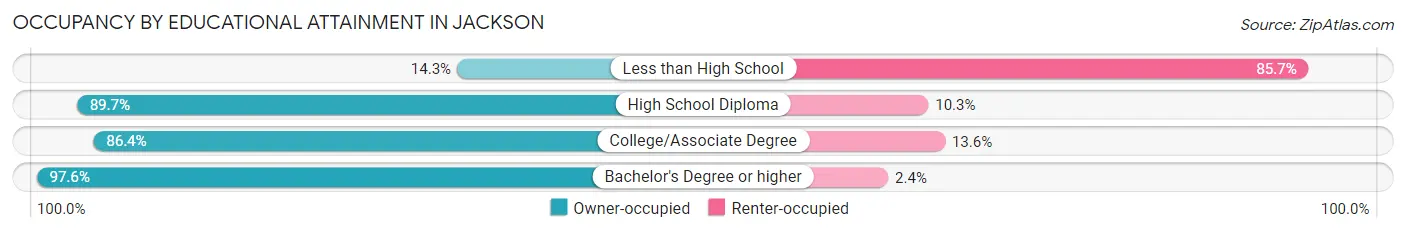
| Household Size | Owner-occupied | Renter-occupied |
| Less than High School | 25 (14.3%) | 150 (85.7%) |
| High School Diploma | 477 (89.7%) | 55 (10.3%) |
| College/Associate Degree | 152 (86.4%) | 24 (13.6%) |
| Bachelor's Degree or higher | 82 (97.6%) | 2 (2.4%) |
Occupancy by Age of Householder in Jackson
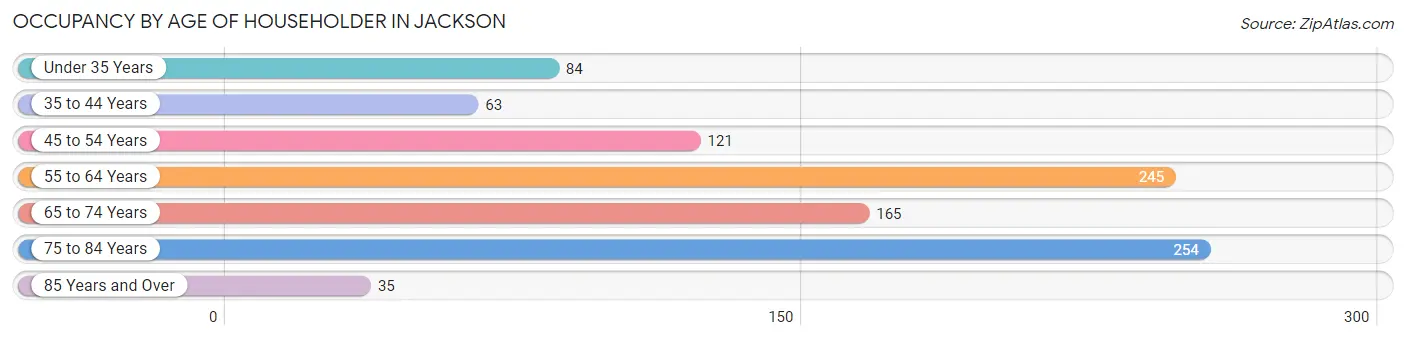
| Age Bracket | # Households | % Households |
| Under 35 Years | 84 | 8.7% |
| 35 to 44 Years | 63 | 6.5% |
| 45 to 54 Years | 121 | 12.5% |
| 55 to 64 Years | 245 | 25.3% |
| 65 to 74 Years | 165 | 17.1% |
| 75 to 84 Years | 254 | 26.3% |
| 85 Years and Over | 35 | 3.6% |
| Total | 967 | 100.0% |
Housing Finances in Jackson
Median Income by Occupancy in Jackson
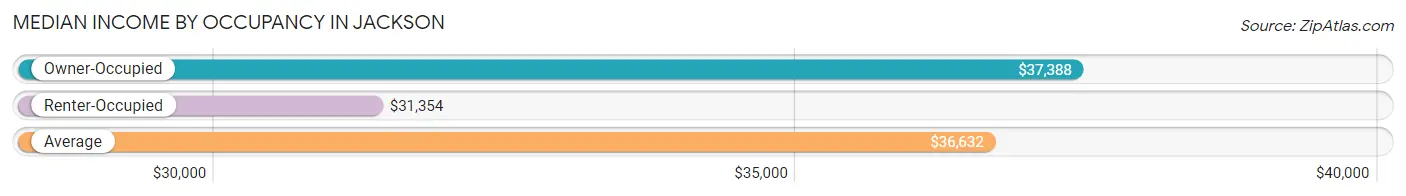
| Occupancy Type | # Households | Median Income |
| Owner-Occupied | 736 (76.1%) | $37,388 |
| Renter-Occupied | 231 (23.9%) | $31,354 |
| Average | 967 (100.0%) | $36,632 |
Occupancy by Householder Income Bracket in Jackson
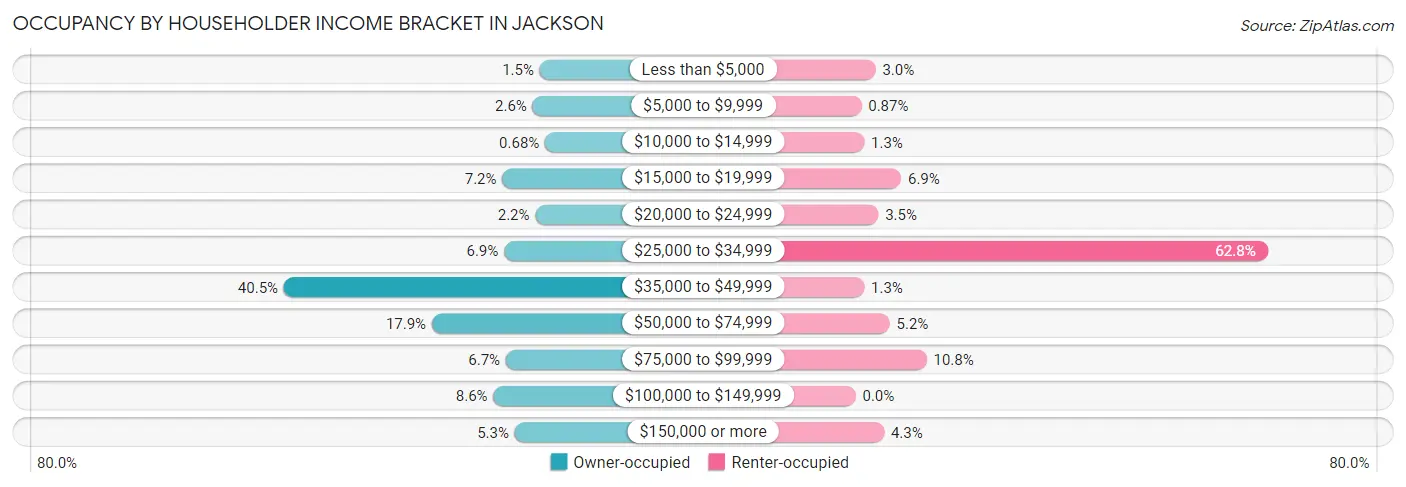
| Income Bracket | Owner-occupied | Renter-occupied |
| Less than $5,000 | 11 (1.5%) | 7 (3.0%) |
| $5,000 to $9,999 | 19 (2.6%) | 2 (0.9%) |
| $10,000 to $14,999 | 5 (0.7%) | 3 (1.3%) |
| $15,000 to $19,999 | 53 (7.2%) | 16 (6.9%) |
| $20,000 to $24,999 | 16 (2.2%) | 8 (3.5%) |
| $25,000 to $34,999 | 51 (6.9%) | 145 (62.8%) |
| $35,000 to $49,999 | 298 (40.5%) | 3 (1.3%) |
| $50,000 to $74,999 | 132 (17.9%) | 12 (5.2%) |
| $75,000 to $99,999 | 49 (6.7%) | 25 (10.8%) |
| $100,000 to $149,999 | 63 (8.6%) | 0 (0.0%) |
| $150,000 or more | 39 (5.3%) | 10 (4.3%) |
| Total | 736 (100.0%) | 231 (100.0%) |
Monthly Housing Cost Tiers in Jackson
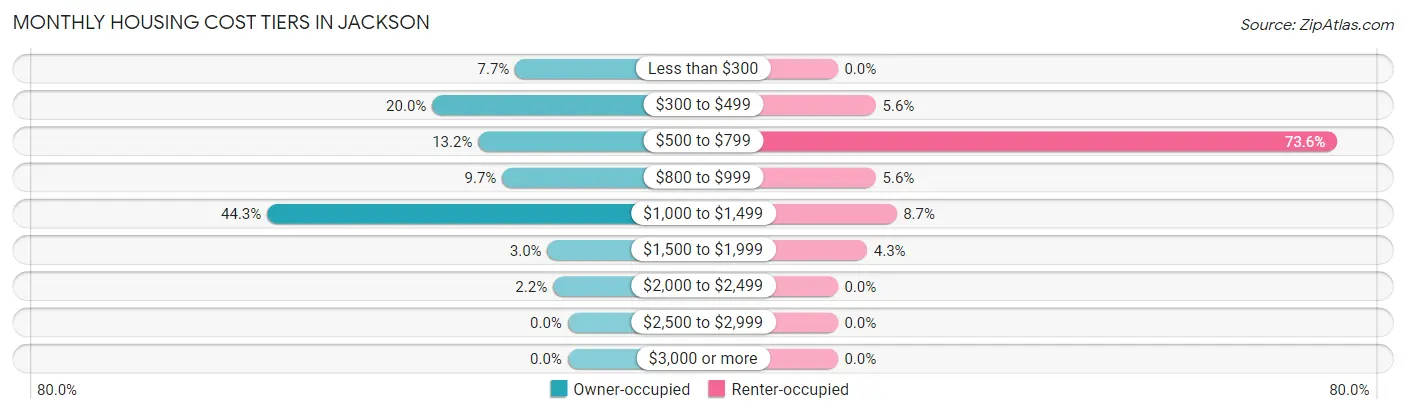
| Monthly Cost | Owner-occupied | Renter-occupied |
| Less than $300 | 57 (7.7%) | 0 (0.0%) |
| $300 to $499 | 147 (20.0%) | 13 (5.6%) |
| $500 to $799 | 97 (13.2%) | 170 (73.6%) |
| $800 to $999 | 71 (9.7%) | 13 (5.6%) |
| $1,000 to $1,499 | 326 (44.3%) | 20 (8.7%) |
| $1,500 to $1,999 | 22 (3.0%) | 10 (4.3%) |
| $2,000 to $2,499 | 16 (2.2%) | 0 (0.0%) |
| $2,500 to $2,999 | 0 (0.0%) | 0 (0.0%) |
| $3,000 or more | 0 (0.0%) | 0 (0.0%) |
| Total | 736 (100.0%) | 231 (100.0%) |
Physical Housing Characteristics in Jackson
Housing Structures in Jackson
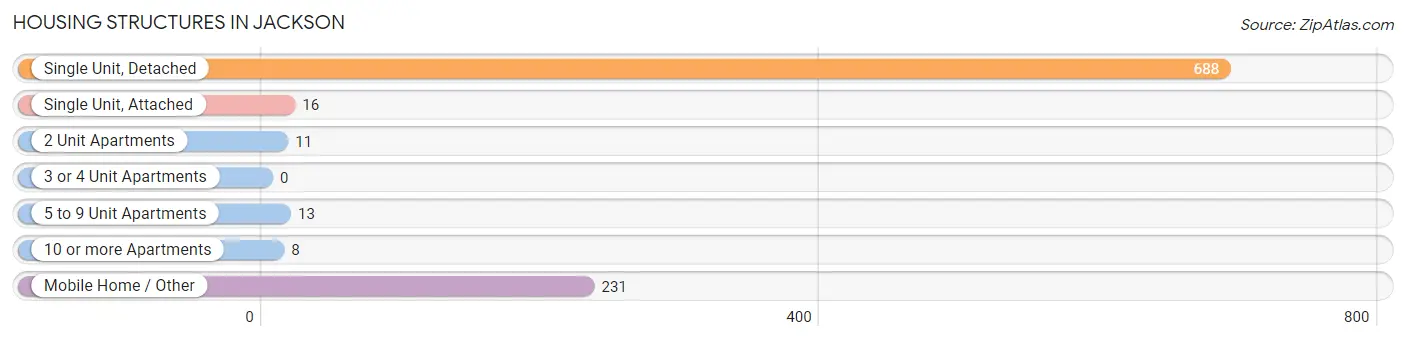
| Structure Type | # Housing Units | % Housing Units |
| Single Unit, Detached | 688 | 71.2% |
| Single Unit, Attached | 16 | 1.7% |
| 2 Unit Apartments | 11 | 1.1% |
| 3 or 4 Unit Apartments | 0 | 0.0% |
| 5 to 9 Unit Apartments | 13 | 1.3% |
| 10 or more Apartments | 8 | 0.8% |
| Mobile Home / Other | 231 | 23.9% |
| Total | 967 | 100.0% |
Housing Structures by Occupancy in Jackson
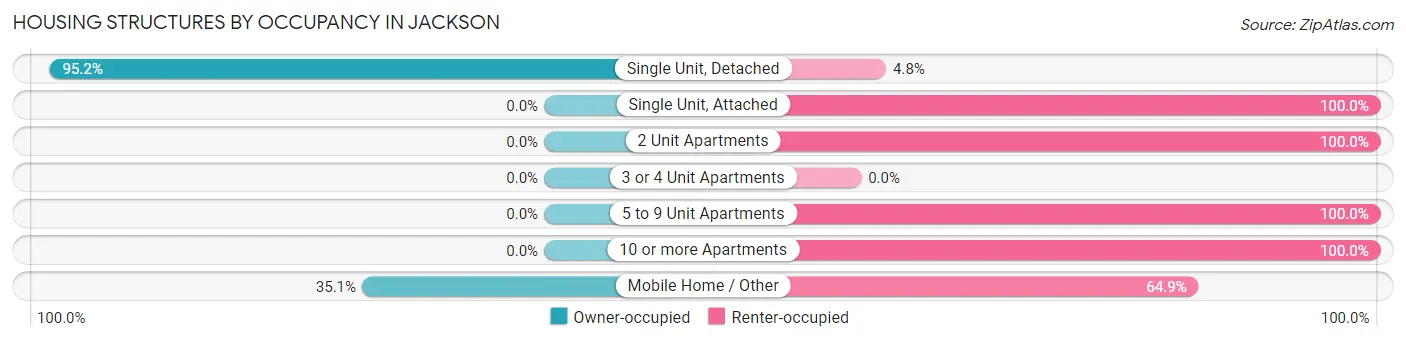
| Structure Type | Owner-occupied | Renter-occupied |
| Single Unit, Detached | 655 (95.2%) | 33 (4.8%) |
| Single Unit, Attached | 0 (0.0%) | 16 (100.0%) |
| 2 Unit Apartments | 0 (0.0%) | 11 (100.0%) |
| 3 or 4 Unit Apartments | 0 (0.0%) | 0 (0.0%) |
| 5 to 9 Unit Apartments | 0 (0.0%) | 13 (100.0%) |
| 10 or more Apartments | 0 (0.0%) | 8 (100.0%) |
| Mobile Home / Other | 81 (35.1%) | 150 (64.9%) |
| Total | 736 (76.1%) | 231 (23.9%) |
Housing Structures by Number of Rooms in Jackson
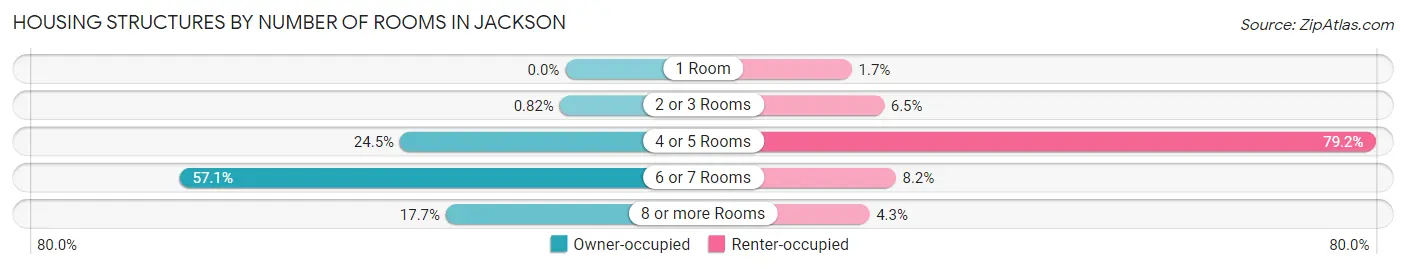
| Number of Rooms | Owner-occupied | Renter-occupied |
| 1 Room | 0 (0.0%) | 4 (1.7%) |
| 2 or 3 Rooms | 6 (0.8%) | 15 (6.5%) |
| 4 or 5 Rooms | 180 (24.5%) | 183 (79.2%) |
| 6 or 7 Rooms | 420 (57.1%) | 19 (8.2%) |
| 8 or more Rooms | 130 (17.7%) | 10 (4.3%) |
| Total | 736 (100.0%) | 231 (100.0%) |
Housing Structure by Heating Type in Jackson
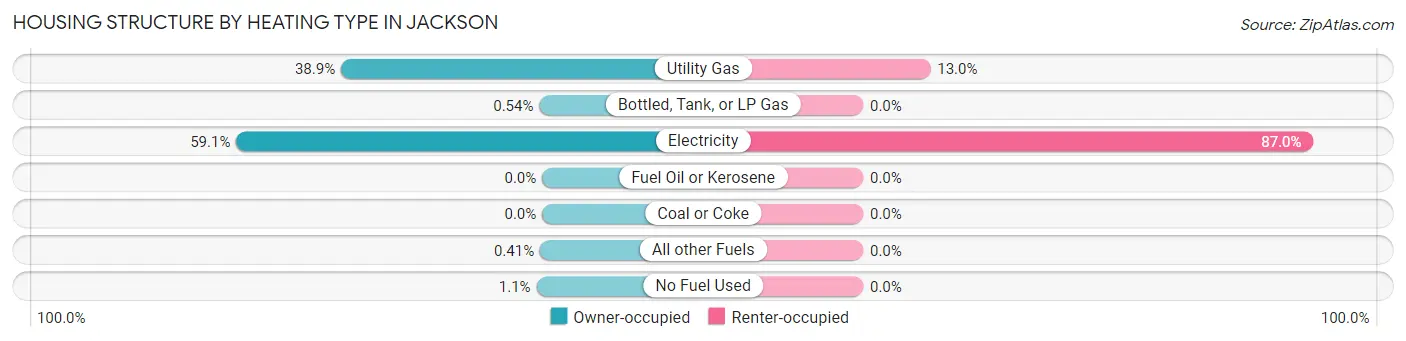
| Heating Type | Owner-occupied | Renter-occupied |
| Utility Gas | 286 (38.9%) | 30 (13.0%) |
| Bottled, Tank, or LP Gas | 4 (0.5%) | 0 (0.0%) |
| Electricity | 435 (59.1%) | 201 (87.0%) |
| Fuel Oil or Kerosene | 0 (0.0%) | 0 (0.0%) |
| Coal or Coke | 0 (0.0%) | 0 (0.0%) |
| All other Fuels | 3 (0.4%) | 0 (0.0%) |
| No Fuel Used | 8 (1.1%) | 0 (0.0%) |
| Total | 736 (100.0%) | 231 (100.0%) |
Household Vehicle Usage in Jackson
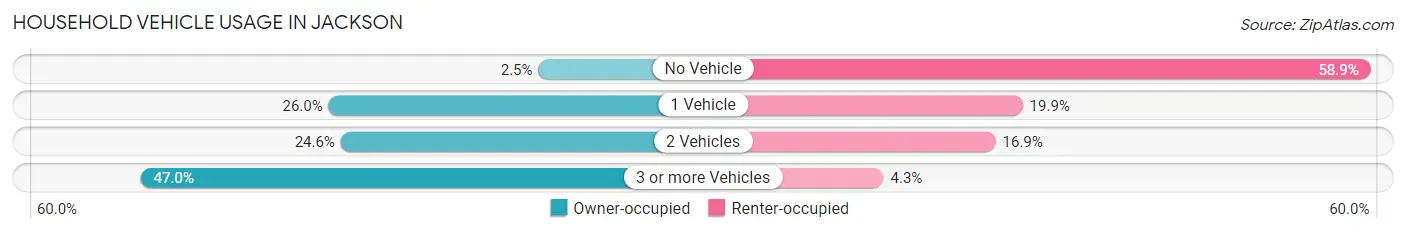
| Vehicles per Household | Owner-occupied | Renter-occupied |
| No Vehicle | 18 (2.5%) | 136 (58.9%) |
| 1 Vehicle | 191 (26.0%) | 46 (19.9%) |
| 2 Vehicles | 181 (24.6%) | 39 (16.9%) |
| 3 or more Vehicles | 346 (47.0%) | 10 (4.3%) |
| Total | 736 (100.0%) | 231 (100.0%) |
Real Estate & Mortgages in Jackson
Real Estate and Mortgage Overview in Jackson
| Characteristic | Without Mortgage | With Mortgage |
| Housing Units | 283 | 453 |
| Median Property Value | $112,500 | $200,400 |
| Median Household Income | $43,281 | $25 |
| Monthly Housing Costs | $377 | $0 |
| Real Estate Taxes | $608 | $11 |
Property Value by Mortgage Status in Jackson
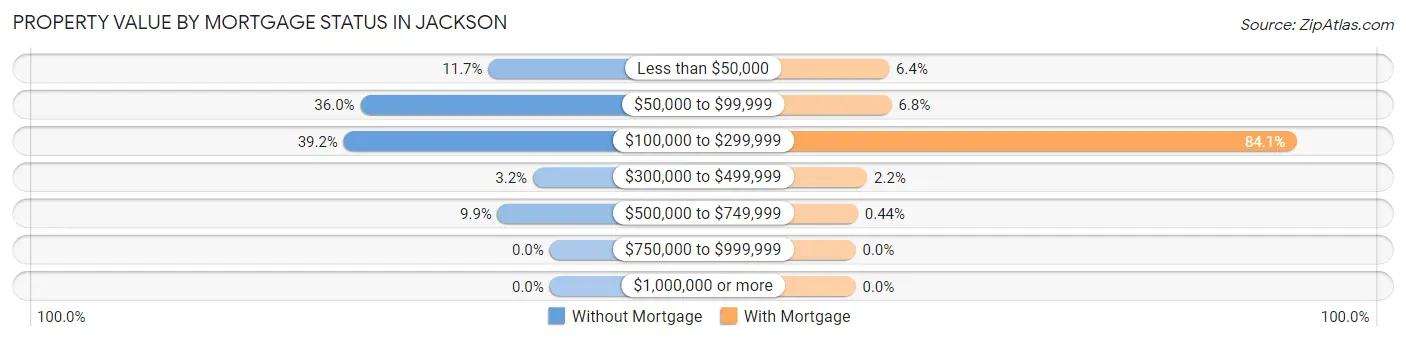
| Property Value | Without Mortgage | With Mortgage |
| Less than $50,000 | 33 (11.7%) | 29 (6.4%) |
| $50,000 to $99,999 | 102 (36.0%) | 31 (6.8%) |
| $100,000 to $299,999 | 111 (39.2%) | 381 (84.1%) |
| $300,000 to $499,999 | 9 (3.2%) | 10 (2.2%) |
| $500,000 to $749,999 | 28 (9.9%) | 2 (0.4%) |
| $750,000 to $999,999 | 0 (0.0%) | 0 (0.0%) |
| $1,000,000 or more | 0 (0.0%) | 0 (0.0%) |
| Total | 283 (100.0%) | 453 (100.0%) |
Household Income by Mortgage Status in Jackson
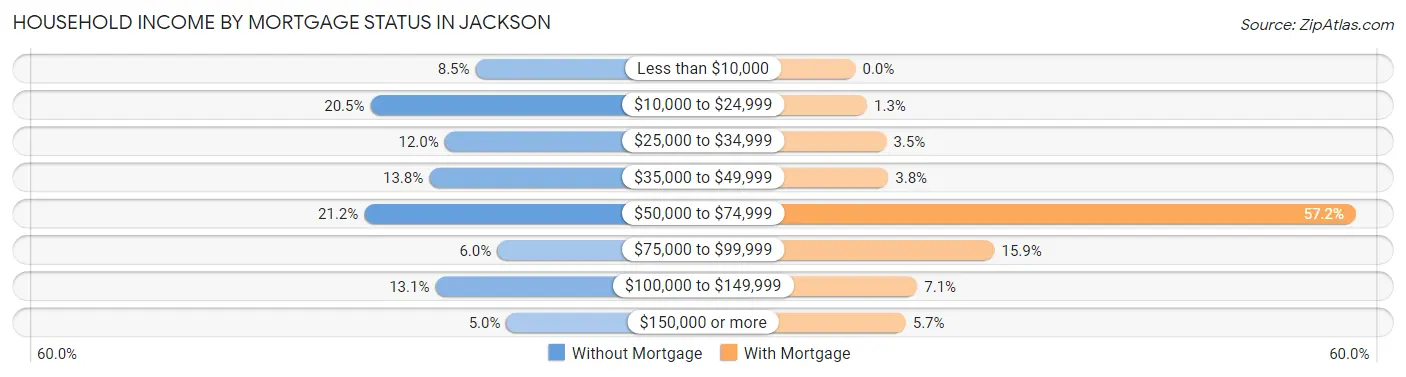
| Household Income | Without Mortgage | With Mortgage |
| Less than $10,000 | 24 (8.5%) | 0 (0.0%) |
| $10,000 to $24,999 | 58 (20.5%) | 6 (1.3%) |
| $25,000 to $34,999 | 34 (12.0%) | 16 (3.5%) |
| $35,000 to $49,999 | 39 (13.8%) | 17 (3.7%) |
| $50,000 to $74,999 | 60 (21.2%) | 259 (57.2%) |
| $75,000 to $99,999 | 17 (6.0%) | 72 (15.9%) |
| $100,000 to $149,999 | 37 (13.1%) | 32 (7.1%) |
| $150,000 or more | 14 (5.0%) | 26 (5.7%) |
| Total | 283 (100.0%) | 453 (100.0%) |
Property Value to Household Income Ratio in Jackson
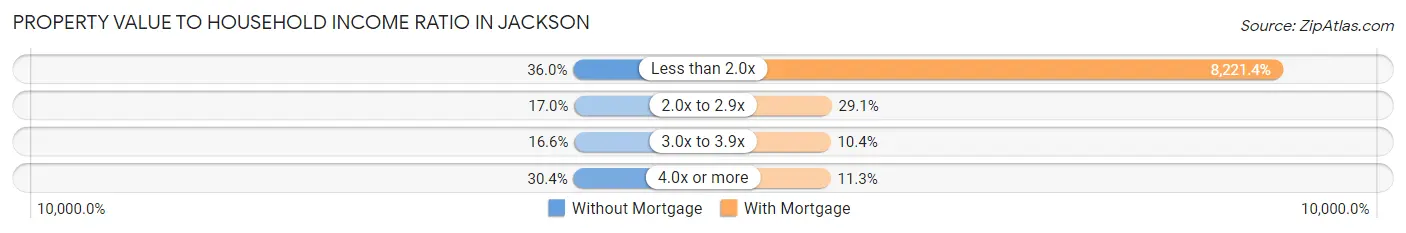
| Value-to-Income Ratio | Without Mortgage | With Mortgage |
| Less than 2.0x | 102 (36.0%) | 37,243 (8,221.4%) |
| 2.0x to 2.9x | 48 (17.0%) | 132 (29.1%) |
| 3.0x to 3.9x | 47 (16.6%) | 47 (10.4%) |
| 4.0x or more | 86 (30.4%) | 51 (11.3%) |
| Total | 283 (100.0%) | 453 (100.0%) |
Real Estate Taxes by Mortgage Status in Jackson
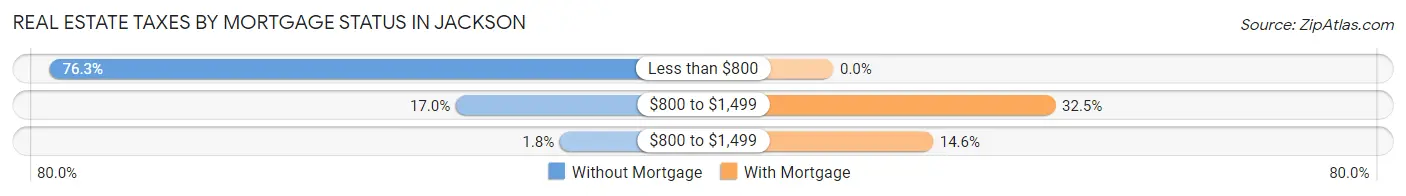
| Property Taxes | Without Mortgage | With Mortgage |
| Less than $800 | 216 (76.3%) | 0 (0.0%) |
| $800 to $1,499 | 48 (17.0%) | 147 (32.5%) |
| $800 to $1,499 | 5 (1.8%) | 66 (14.6%) |
| Total | 283 (100.0%) | 453 (100.0%) |
Health & Disability in Jackson
Health Insurance Coverage by Age in Jackson
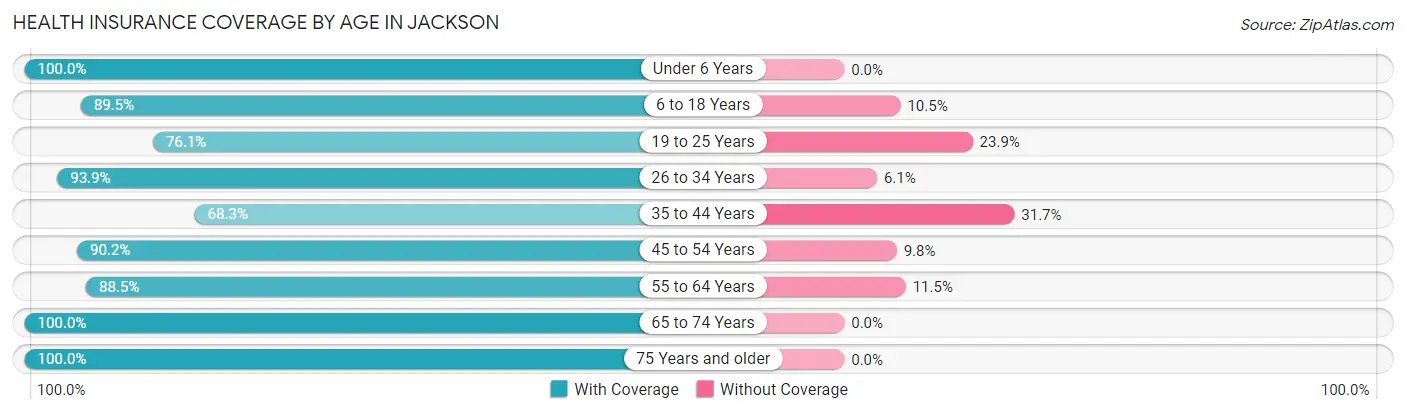
| Age Bracket | With Coverage | Without Coverage |
| Under 6 Years | 121 (100.0%) | 0 (0.0%) |
| 6 to 18 Years | 188 (89.5%) | 22 (10.5%) |
| 19 to 25 Years | 54 (76.1%) | 17 (23.9%) |
| 26 to 34 Years | 154 (93.9%) | 10 (6.1%) |
| 35 to 44 Years | 84 (68.3%) | 39 (31.7%) |
| 45 to 54 Years | 166 (90.2%) | 18 (9.8%) |
| 55 to 64 Years | 363 (88.5%) | 47 (11.5%) |
| 65 to 74 Years | 239 (100.0%) | 0 (0.0%) |
| 75 Years and older | 360 (100.0%) | 0 (0.0%) |
| Total | 1,729 (91.9%) | 153 (8.1%) |
Health Insurance Coverage by Citizenship Status in Jackson
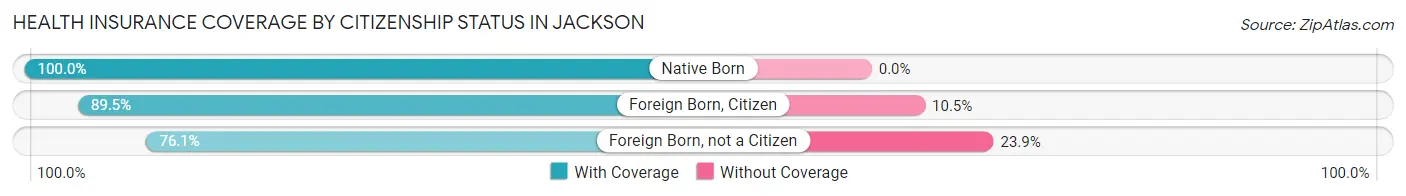
| Citizenship Status | With Coverage | Without Coverage |
| Native Born | 121 (100.0%) | 0 (0.0%) |
| Foreign Born, Citizen | 188 (89.5%) | 22 (10.5%) |
| Foreign Born, not a Citizen | 54 (76.1%) | 17 (23.9%) |
Health Insurance Coverage by Household Income in Jackson
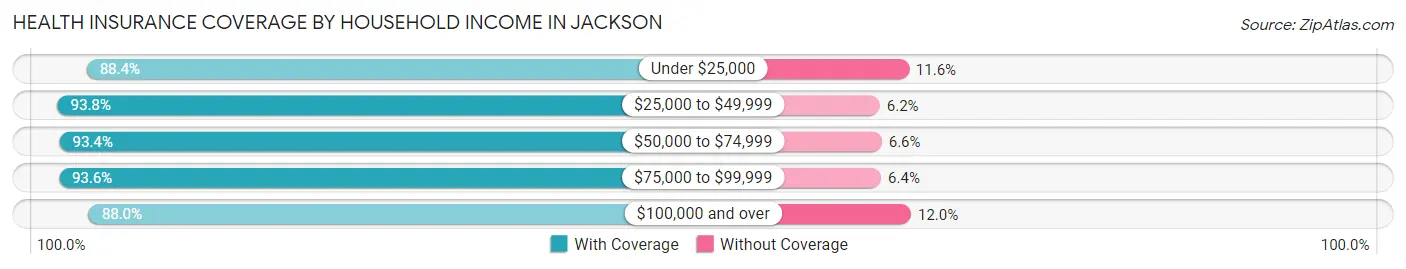
| Household Income | With Coverage | Without Coverage |
| Under $25,000 | 205 (88.4%) | 27 (11.6%) |
| $25,000 to $49,999 | 712 (93.8%) | 47 (6.2%) |
| $50,000 to $74,999 | 285 (93.4%) | 20 (6.6%) |
| $75,000 to $99,999 | 189 (93.6%) | 13 (6.4%) |
| $100,000 and over | 336 (88.0%) | 46 (12.0%) |
Public vs Private Health Insurance Coverage by Age in Jackson
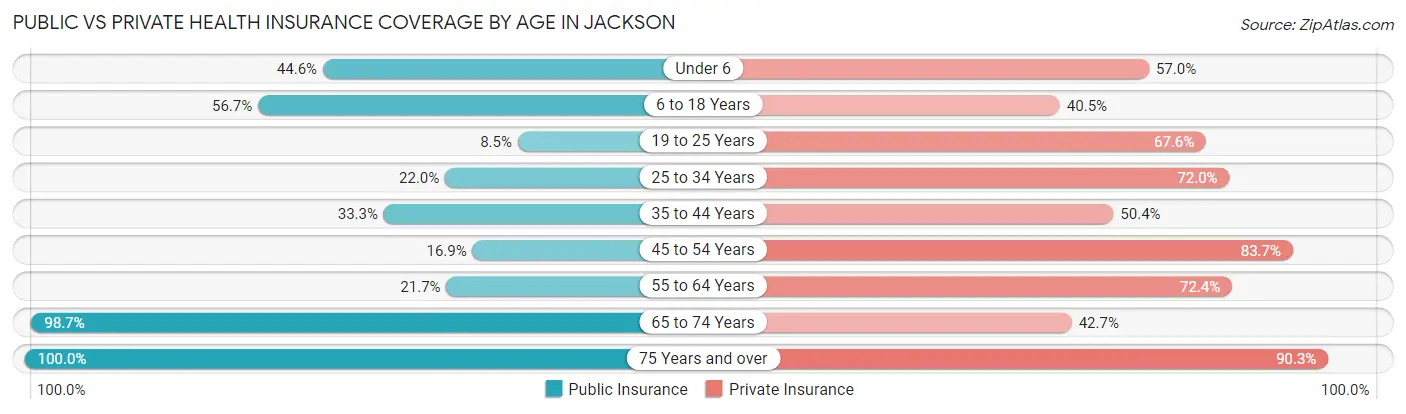
| Age Bracket | Public Insurance | Private Insurance |
| Under 6 | 54 (44.6%) | 69 (57.0%) |
| 6 to 18 Years | 119 (56.7%) | 85 (40.5%) |
| 19 to 25 Years | 6 (8.5%) | 48 (67.6%) |
| 25 to 34 Years | 36 (22.0%) | 118 (72.0%) |
| 35 to 44 Years | 41 (33.3%) | 62 (50.4%) |
| 45 to 54 Years | 31 (16.9%) | 154 (83.7%) |
| 55 to 64 Years | 89 (21.7%) | 297 (72.4%) |
| 65 to 74 Years | 236 (98.7%) | 102 (42.7%) |
| 75 Years and over | 360 (100.0%) | 325 (90.3%) |
| Total | 972 (51.6%) | 1,260 (66.9%) |
Disability Status by Sex by Age in Jackson
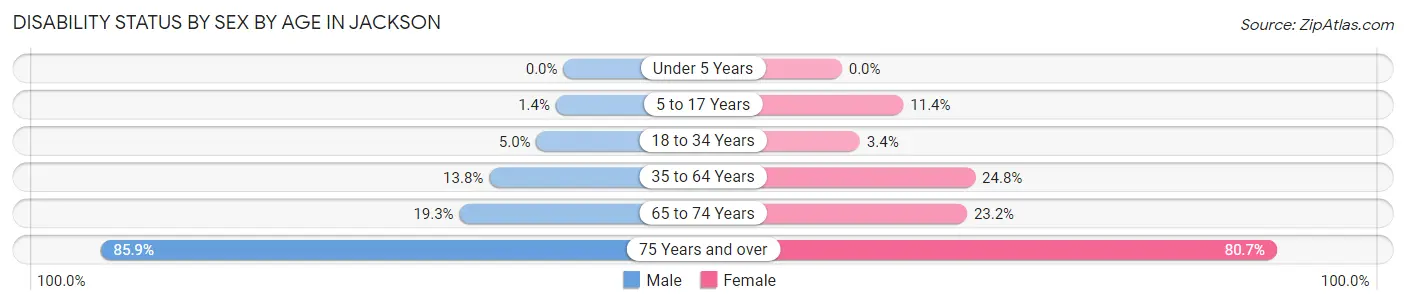
| Age Bracket | Male | Female |
| Under 5 Years | 0 (0.0%) | 0 (0.0%) |
| 5 to 17 Years | 1 (1.4%) | 12 (11.4%) |
| 18 to 34 Years | 6 (5.0%) | 5 (3.4%) |
| 35 to 64 Years | 57 (13.8%) | 75 (24.7%) |
| 65 to 74 Years | 27 (19.3%) | 23 (23.2%) |
| 75 Years and over | 73 (85.9%) | 222 (80.7%) |
Disability Class by Sex by Age in Jackson
Disability Class: Hearing Difficulty
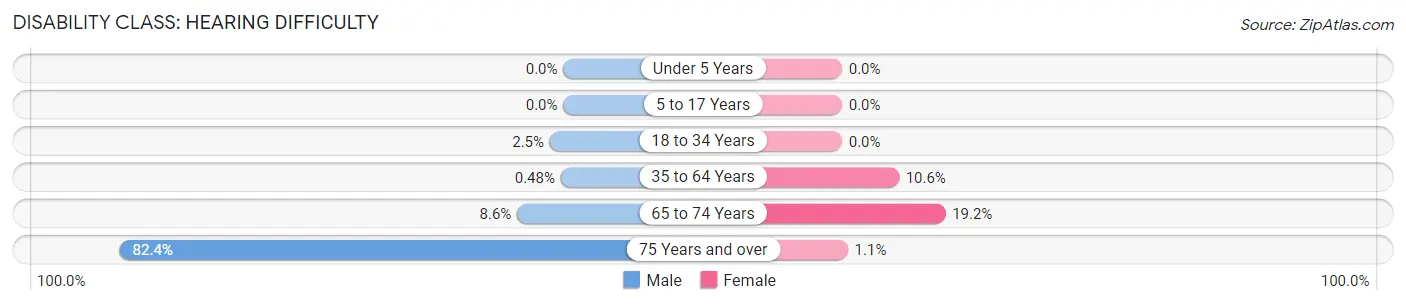
| Age Bracket | Male | Female |
| Under 5 Years | 0 (0.0%) | 0 (0.0%) |
| 5 to 17 Years | 0 (0.0%) | 0 (0.0%) |
| 18 to 34 Years | 3 (2.5%) | 0 (0.0%) |
| 35 to 64 Years | 2 (0.5%) | 32 (10.6%) |
| 65 to 74 Years | 12 (8.6%) | 19 (19.2%) |
| 75 Years and over | 70 (82.4%) | 3 (1.1%) |
Disability Class: Vision Difficulty
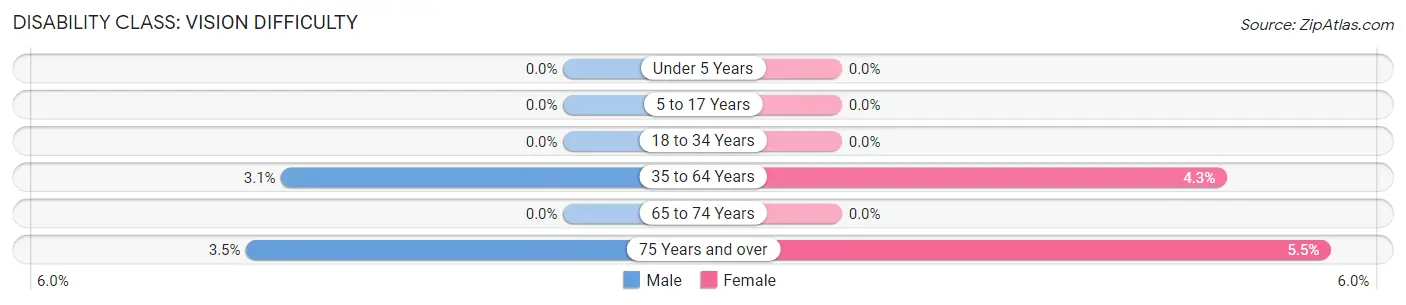
| Age Bracket | Male | Female |
| Under 5 Years | 0 (0.0%) | 0 (0.0%) |
| 5 to 17 Years | 0 (0.0%) | 0 (0.0%) |
| 18 to 34 Years | 0 (0.0%) | 0 (0.0%) |
| 35 to 64 Years | 13 (3.1%) | 13 (4.3%) |
| 65 to 74 Years | 0 (0.0%) | 0 (0.0%) |
| 75 Years and over | 3 (3.5%) | 15 (5.4%) |
Disability Class: Cognitive Difficulty
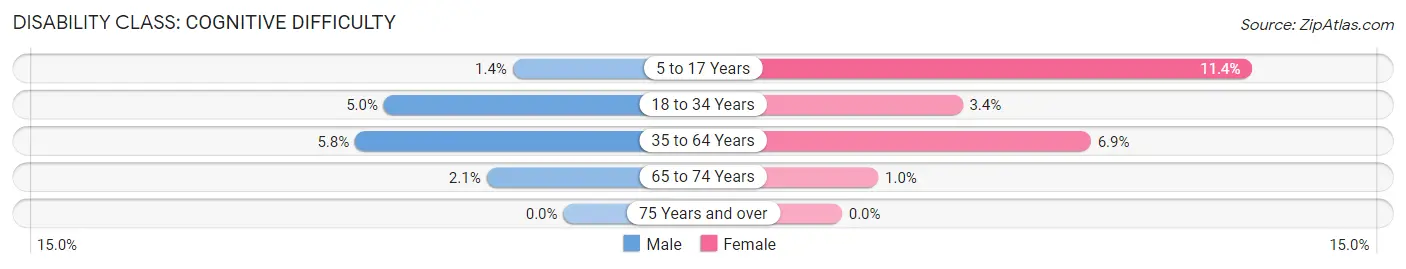
| Age Bracket | Male | Female |
| 5 to 17 Years | 1 (1.4%) | 12 (11.4%) |
| 18 to 34 Years | 6 (5.0%) | 5 (3.4%) |
| 35 to 64 Years | 24 (5.8%) | 21 (6.9%) |
| 65 to 74 Years | 3 (2.1%) | 1 (1.0%) |
| 75 Years and over | 0 (0.0%) | 0 (0.0%) |
Disability Class: Ambulatory Difficulty
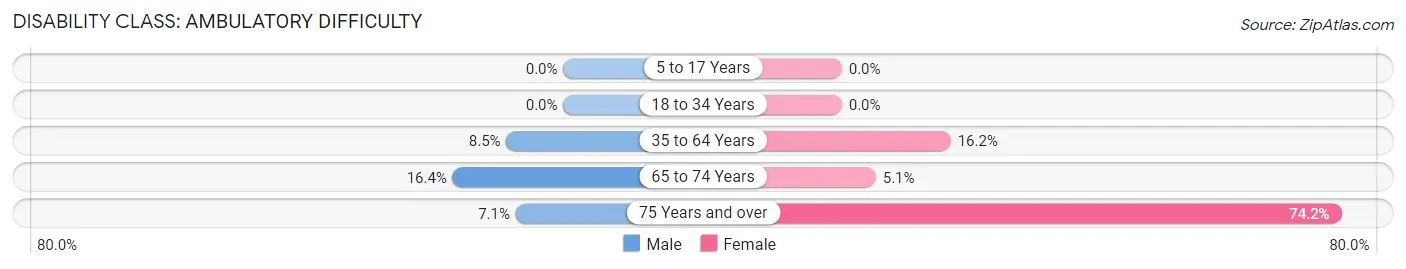
| Age Bracket | Male | Female |
| 5 to 17 Years | 0 (0.0%) | 0 (0.0%) |
| 18 to 34 Years | 0 (0.0%) | 0 (0.0%) |
| 35 to 64 Years | 35 (8.5%) | 49 (16.2%) |
| 65 to 74 Years | 23 (16.4%) | 5 (5.1%) |
| 75 Years and over | 6 (7.1%) | 204 (74.2%) |
Disability Class: Self-Care Difficulty
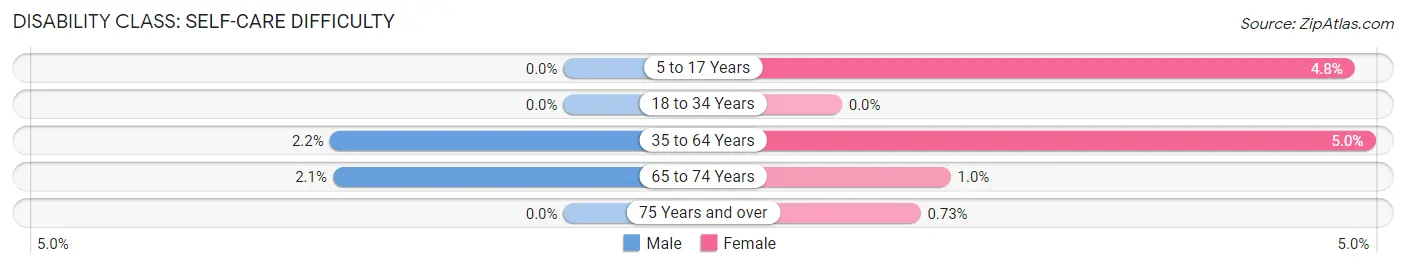
| Age Bracket | Male | Female |
| 5 to 17 Years | 0 (0.0%) | 5 (4.8%) |
| 18 to 34 Years | 0 (0.0%) | 0 (0.0%) |
| 35 to 64 Years | 9 (2.2%) | 15 (5.0%) |
| 65 to 74 Years | 3 (2.1%) | 1 (1.0%) |
| 75 Years and over | 0 (0.0%) | 2 (0.7%) |
Technology Access in Jackson
Computing Device Access in Jackson
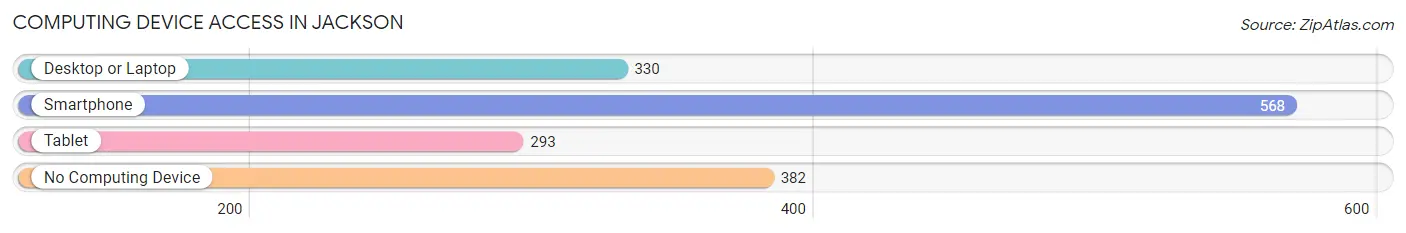
| Device Type | # Households | % Households |
| Desktop or Laptop | 330 | 34.1% |
| Smartphone | 568 | 58.7% |
| Tablet | 293 | 30.3% |
| No Computing Device | 382 | 39.5% |
| Total | 967 | 100.0% |
Internet Access in Jackson
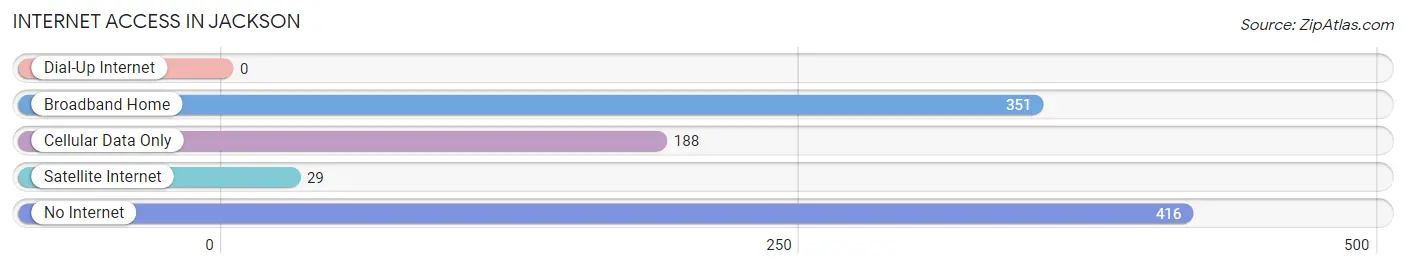
| Internet Type | # Households | % Households |
| Dial-Up Internet | 0 | 0.0% |
| Broadband Home | 351 | 36.3% |
| Cellular Data Only | 188 | 19.4% |
| Satellite Internet | 29 | 3.0% |
| No Internet | 416 | 43.0% |
| Total | 967 | 100.0% |
Jackson Summary
Jackson, South Carolina is a small town located in the heart of the state, just south of the capital city of Columbia. It is a rural community with a population of just over 1,000 people. The town is located in Aiken County, which is part of the larger Augusta-Aiken metropolitan area.
History
Jackson was founded in 1820 by a group of settlers from North Carolina. The town was named after Andrew Jackson, the seventh president of the United States. The town was originally a farming community, and the main crops were cotton and tobacco. In the late 19th century, the town began to grow and develop as a commercial center. The railroad arrived in 1887, and the town was incorporated in 1890.
In the early 20th century, Jackson was a thriving community with a variety of businesses, including a cotton mill, a sawmill, a gristmill, and a brickyard. The town also had a number of churches, schools, and other civic organizations.
Geography
Jackson is located in the Piedmont region of South Carolina, about 25 miles south of Columbia. The town is situated on the banks of the Saluda River, which flows through the town and provides a scenic backdrop. The town is surrounded by rolling hills and forests, and is located in a rural area.
Economy
The economy of Jackson is largely based on agriculture. The town is home to several farms, which produce a variety of crops, including cotton, tobacco, corn, soybeans, and wheat. The town also has a number of small businesses, including restaurants, retail stores, and service providers.
Demographics
As of the 2010 census, the population of Jackson was 1,072. The racial makeup of the town was 79.3% White, 17.2% African American, 0.3% Native American, 0.2% Asian, 0.1% Pacific Islander, and 2.9% from other races. The median household income was $30,938, and the median family income was $37,813.
Jackson is a small, rural town with a rich history and a strong sense of community. The town is home to a variety of businesses and organizations, and is a great place to live and work.
Common Questions
What is Per Capita Income in Jackson?
Per Capita income in Jackson is $26,439.
What is the Median Family Income in Jackson?
Median Family Income in Jackson is $37,166.
What is the Median Household income in Jackson?
Median Household Income in Jackson is $36,632.
What is Income or Wage Gap in Jackson?
Income or Wage Gap in Jackson is 7.2%.
Women in Jackson earn 92.8 cents for every dollar earned by a man.
What is Inequality or Gini Index in Jackson?
Inequality or Gini Index in Jackson is 0.38.
What is the Total Population of Jackson?
Total Population of Jackson is 1,882.
What is the Total Male Population of Jackson?
Total Male Population of Jackson is 840.
What is the Total Female Population of Jackson?
Total Female Population of Jackson is 1,042.
What is the Ratio of Males per 100 Females in Jackson?
There are 80.61 Males per 100 Females in Jackson.
What is the Ratio of Females per 100 Males in Jackson?
There are 124.05 Females per 100 Males in Jackson.
What is the Median Population Age in Jackson?
Median Population Age in Jackson is 58.3 Years.
What is the Average Family Size in Jackson
Average Family Size in Jackson is 2.4 People.
What is the Average Household Size in Jackson
Average Household Size in Jackson is 1.9 People.
How Large is the Labor Force in Jackson?
There are 782 People in the Labor Forcein in Jackson.
What is the Percentage of People in the Labor Force in Jackson?
48.6% of People are in the Labor Force in Jackson.
What is the Unemployment Rate in Jackson?
Unemployment Rate in Jackson is 3.6%.