Parksville, SC Map & Demographics
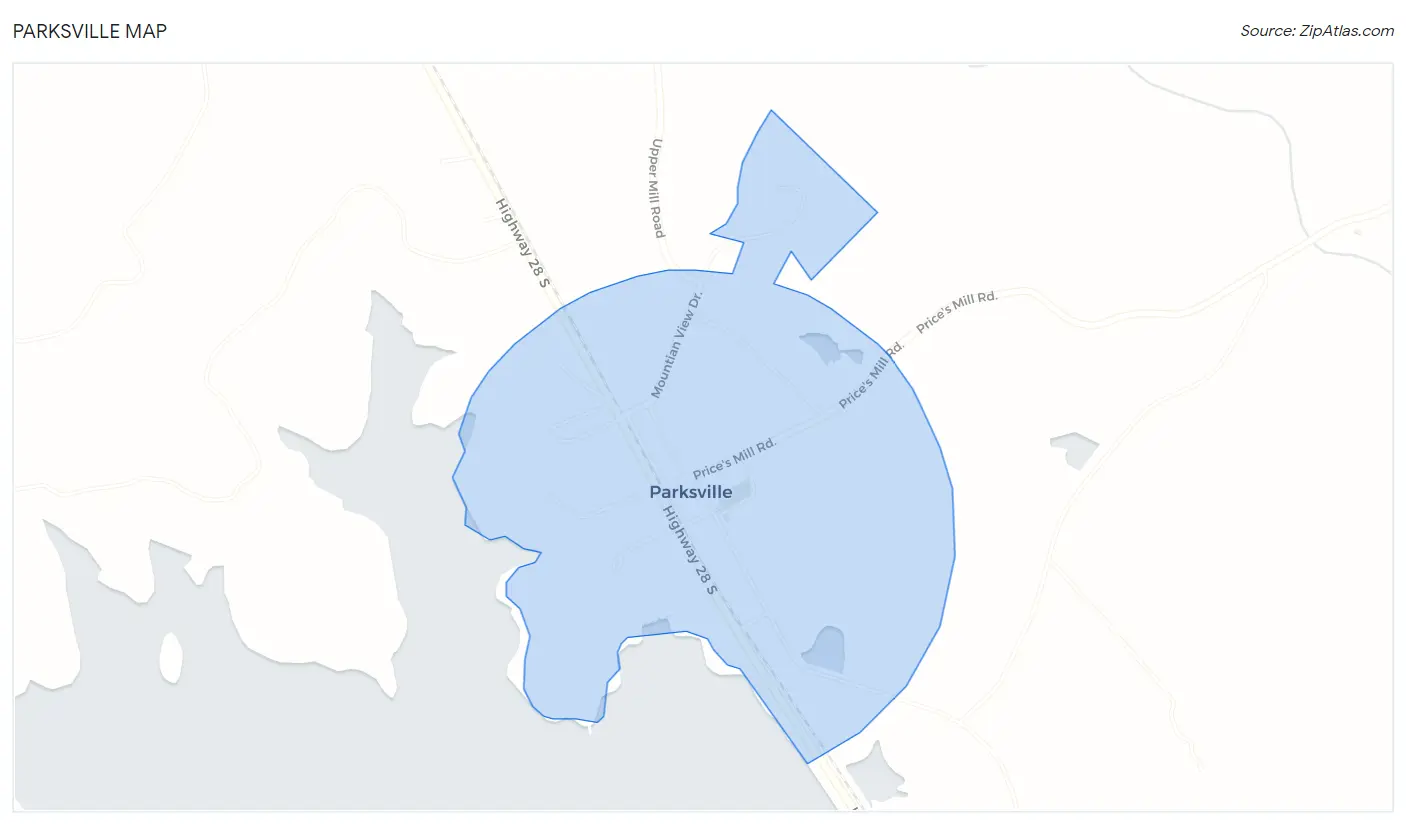
Parksville Map
Parksville Overview
$29,981
PER CAPITA INCOME
$51,250
AVG FAMILY INCOME
$38,281
AVG HOUSEHOLD INCOME
0.42
INEQUALITY / GINI INDEX
104
TOTAL POPULATION
53
MALE POPULATION
51
FEMALE POPULATION
103.92
MALES / 100 FEMALES
96.23
FEMALES / 100 MALES
60.3
MEDIAN AGE
2.3
AVG FAMILY SIZE
1.8
AVG HOUSEHOLD SIZE
41
LABOR FORCE [ PEOPLE ]
41.4%
PERCENT IN LABOR FORCE
4.9%
UNEMPLOYMENT RATE
Parksville Zip Codes
Parksville Area Codes
Income in Parksville
Income Overview in Parksville
Per Capita Income in Parksville is $29,981, while median incomes of families and households are $51,250 and $38,281 respectively.
| Characteristic | Number | Measure |
| Per Capita Income | 104 | $29,981 |
| Median Family Income | 34 | $51,250 |
| Mean Family Income | 34 | $68,535 |
| Median Household Income | 57 | $38,281 |
| Mean Household Income | 57 | $51,033 |
| Income Deficit | 34 | $0 |
| Wage / Income Gap (%) | 104 | 0.00% |
| Wage / Income Gap ($) | 104 | 100.00¢ per $1 |
| Gini / Inequality Index | 104 | 0.42 |
Earnings by Sex in Parksville
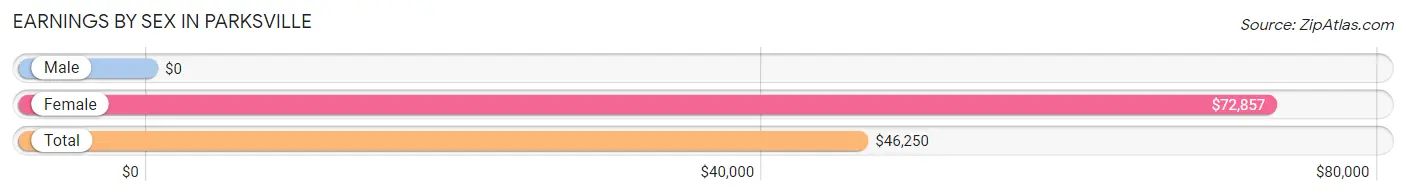
| Sex | Number | Average Earnings |
| Male | 27 (69.2%) | $0 |
| Female | 12 (30.8%) | $72,857 |
| Total | 39 (100.0%) | $46,250 |
Earnings by Sex by Income Bracket in Parksville
The most common earnings brackets in Parksville are $55,000 to $64,999 for men (8 | 29.6%) and $65,000 to $74,999 for women (8 | 66.7%).
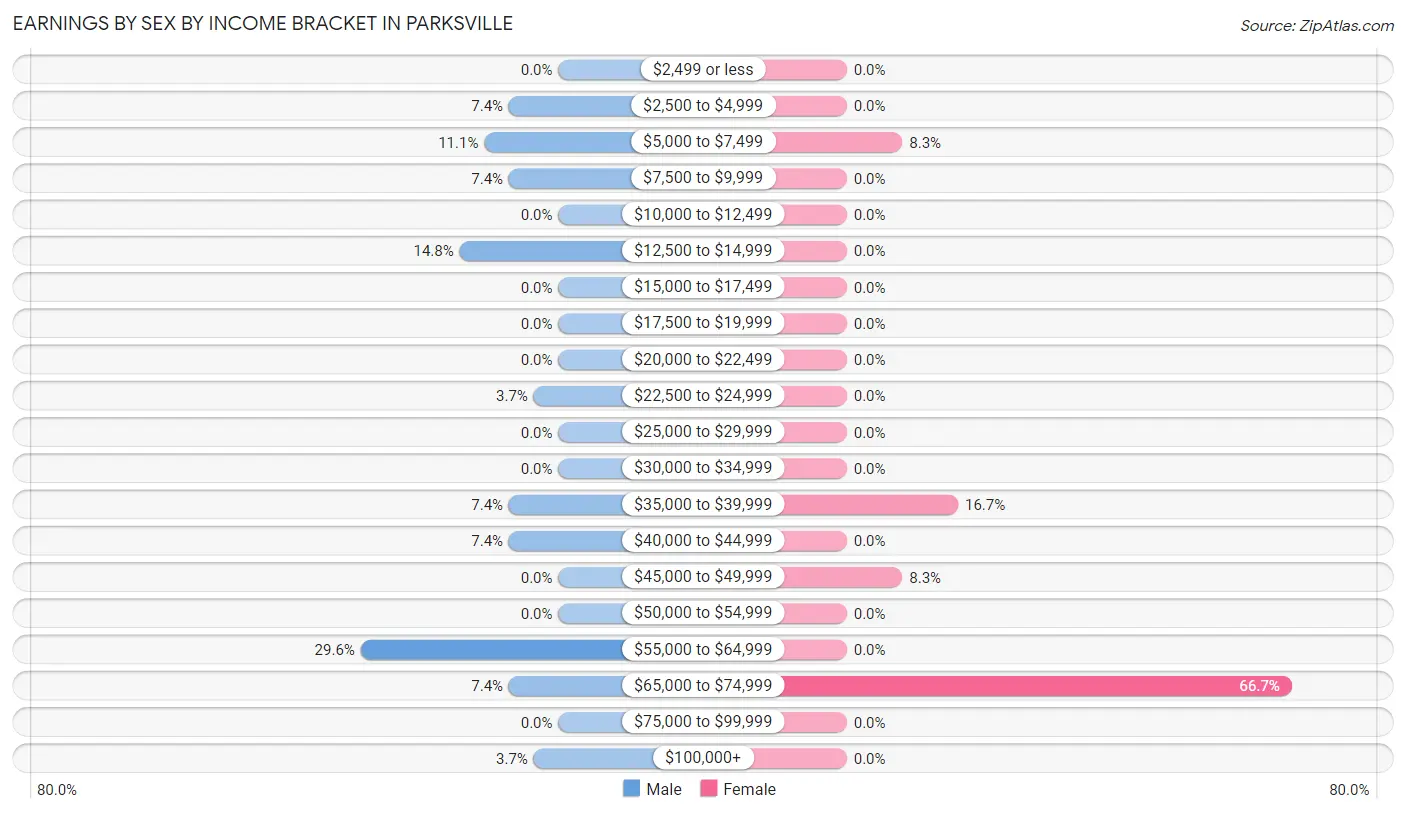
| Income | Male | Female |
| $2,499 or less | 0 (0.0%) | 0 (0.0%) |
| $2,500 to $4,999 | 2 (7.4%) | 0 (0.0%) |
| $5,000 to $7,499 | 3 (11.1%) | 1 (8.3%) |
| $7,500 to $9,999 | 2 (7.4%) | 0 (0.0%) |
| $10,000 to $12,499 | 0 (0.0%) | 0 (0.0%) |
| $12,500 to $14,999 | 4 (14.8%) | 0 (0.0%) |
| $15,000 to $17,499 | 0 (0.0%) | 0 (0.0%) |
| $17,500 to $19,999 | 0 (0.0%) | 0 (0.0%) |
| $20,000 to $22,499 | 0 (0.0%) | 0 (0.0%) |
| $22,500 to $24,999 | 1 (3.7%) | 0 (0.0%) |
| $25,000 to $29,999 | 0 (0.0%) | 0 (0.0%) |
| $30,000 to $34,999 | 0 (0.0%) | 0 (0.0%) |
| $35,000 to $39,999 | 2 (7.4%) | 2 (16.7%) |
| $40,000 to $44,999 | 2 (7.4%) | 0 (0.0%) |
| $45,000 to $49,999 | 0 (0.0%) | 1 (8.3%) |
| $50,000 to $54,999 | 0 (0.0%) | 0 (0.0%) |
| $55,000 to $64,999 | 8 (29.6%) | 0 (0.0%) |
| $65,000 to $74,999 | 2 (7.4%) | 8 (66.7%) |
| $75,000 to $99,999 | 0 (0.0%) | 0 (0.0%) |
| $100,000+ | 1 (3.7%) | 0 (0.0%) |
| Total | 27 (100.0%) | 12 (100.0%) |
Earnings by Sex by Educational Attainment in Parksville
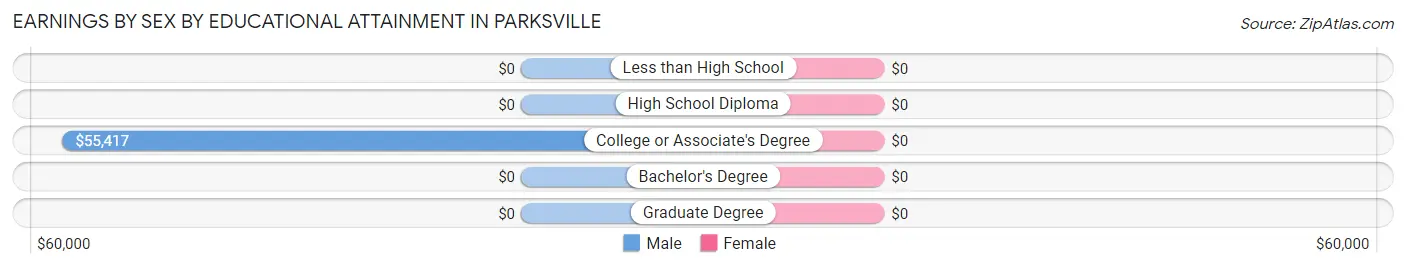
| Educational Attainment | Male Income | Female Income |
| Less than High School | - | - |
| High School Diploma | - | - |
| College or Associate's Degree | $55,417 | $0 |
| Bachelor's Degree | - | - |
| Graduate Degree | - | - |
| Total | $44,375 | $72,857 |
Family Income in Parksville
Family Income Brackets in Parksville
According to the Parksville family income data, there are 9 families falling into the $35,000 to $49,999 income range, which is the most common income bracket and makes up 26.5% of all families.
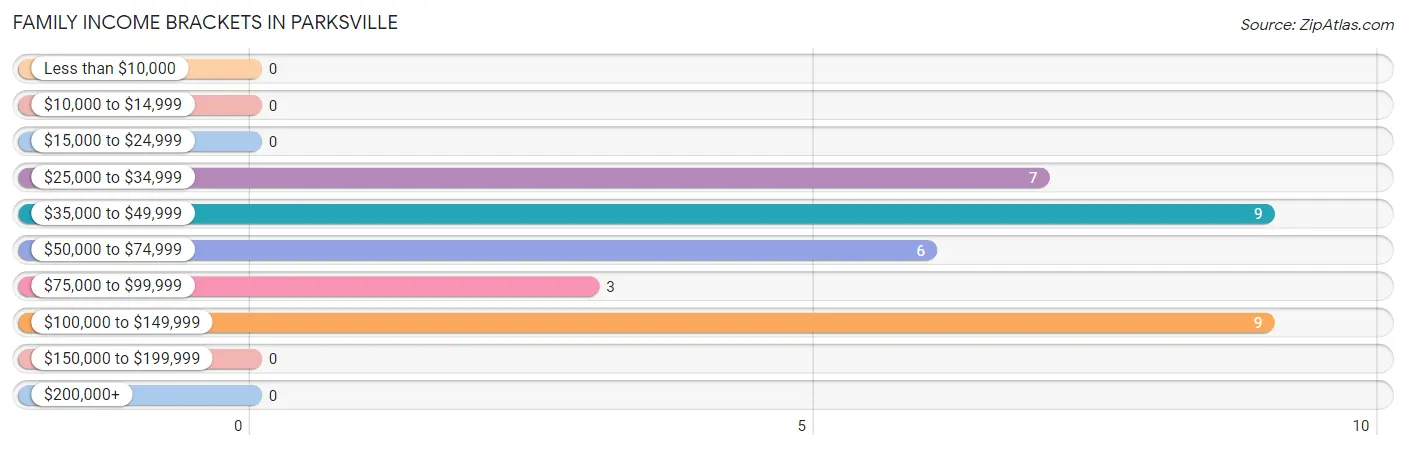
| Income Bracket | # Families | % Families |
| Less than $10,000 | 0 | 0.0% |
| $10,000 to $14,999 | 0 | 0.0% |
| $15,000 to $24,999 | 0 | 0.0% |
| $25,000 to $34,999 | 7 | 20.6% |
| $35,000 to $49,999 | 9 | 26.5% |
| $50,000 to $74,999 | 6 | 17.6% |
| $75,000 to $99,999 | 3 | 8.8% |
| $100,000 to $149,999 | 9 | 26.5% |
| $150,000 to $199,999 | 0 | 0.0% |
| $200,000+ | 0 | 0.0% |
Family Income by Famaliy Size in Parksville
2-person families (33 | 97.1%) account for the highest median family income in Parksville with $50,625 per family, while 2-person families (33 | 97.1%) have the highest median income of $25,312 per family member.
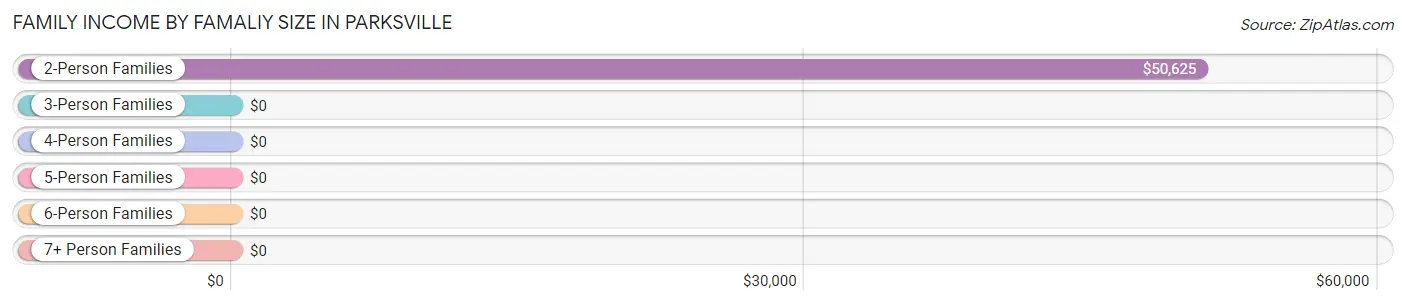
| Income Bracket | # Families | Median Income |
| 2-Person Families | 33 (97.1%) | $50,625 |
| 3-Person Families | 1 (2.9%) | $0 |
| 4-Person Families | 0 (0.0%) | $0 |
| 5-Person Families | 0 (0.0%) | $0 |
| 6-Person Families | 0 (0.0%) | $0 |
| 7+ Person Families | 0 (0.0%) | $0 |
| Total | 34 (100.0%) | $51,250 |
Family Income by Number of Earners in Parksville
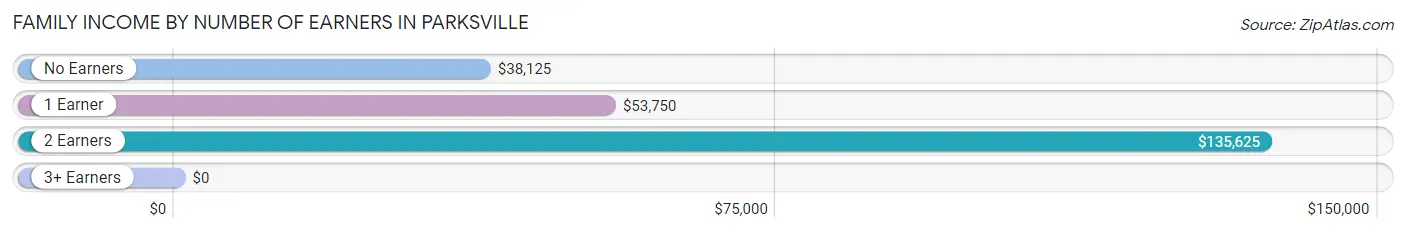
| Number of Earners | # Families | Median Income |
| No Earners | 15 (44.1%) | $38,125 |
| 1 Earner | 10 (29.4%) | $53,750 |
| 2 Earners | 9 (26.5%) | $135,625 |
| 3+ Earners | 0 (0.0%) | $0 |
| Total | 34 (100.0%) | $51,250 |
Household Income in Parksville
Household Income Brackets in Parksville
With 14 households falling in the category, the $35,000 to $49,999 income range is the most frequent in Parksville, accounting for 24.6% of all households.
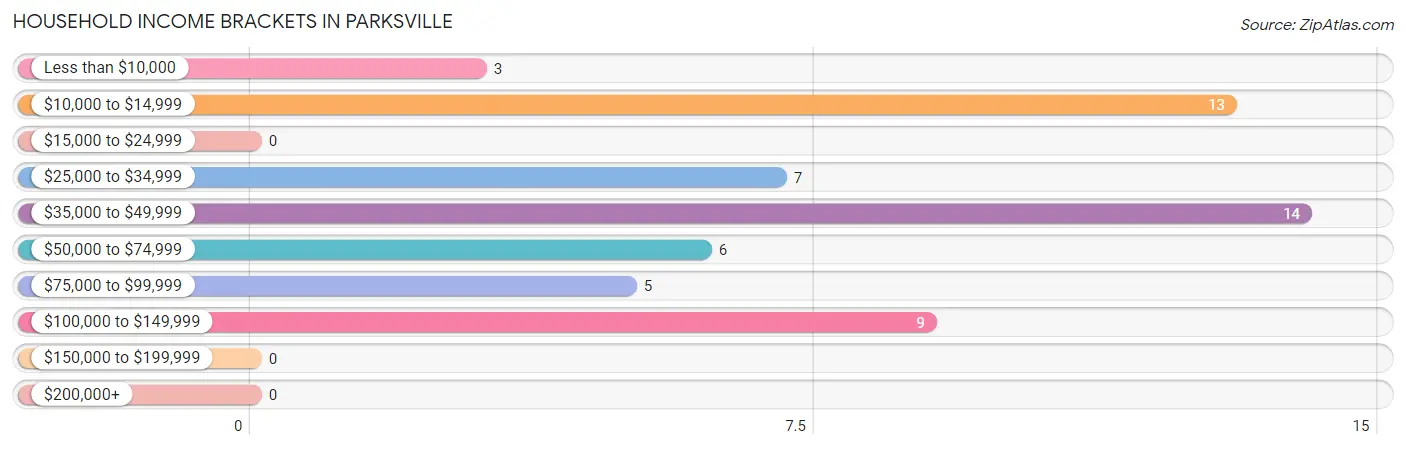
| Income Bracket | # Households | % Households |
| Less than $10,000 | 3 | 5.3% |
| $10,000 to $14,999 | 13 | 22.8% |
| $15,000 to $24,999 | 0 | 0.0% |
| $25,000 to $34,999 | 7 | 12.3% |
| $35,000 to $49,999 | 14 | 24.6% |
| $50,000 to $74,999 | 6 | 10.5% |
| $75,000 to $99,999 | 5 | 8.8% |
| $100,000 to $149,999 | 9 | 15.8% |
| $150,000 to $199,999 | 0 | 0.0% |
| $200,000+ | 0 | 0.0% |
Household Income by Householder Age in Parksville
The median household income in Parksville is $38,281, with the highest median household income of $27,000 found in the 65+ years age bracket for the primary householder. A total of 32 households (56.1%) fall into this category. Meanwhile, the 15 to 24 years age bracket for the primary householder has the lowest median household income of $0, with 4 households (7.0%) in this group.
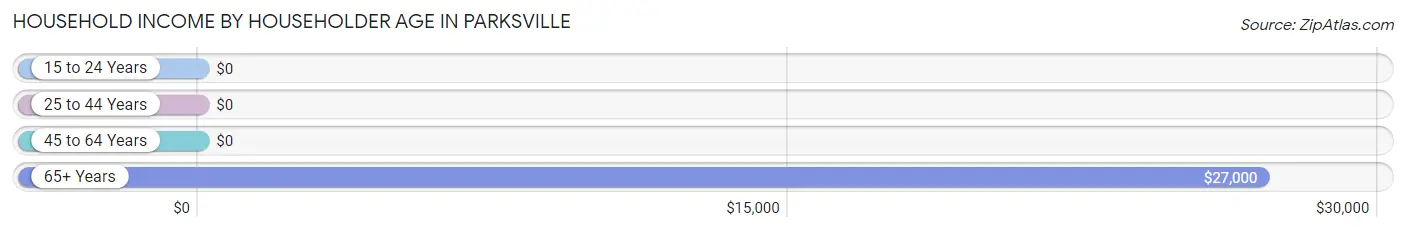
| Income Bracket | # Households | Median Income |
| 15 to 24 Years | 4 (7.0%) | $0 |
| 25 to 44 Years | 2 (3.5%) | $0 |
| 45 to 64 Years | 19 (33.3%) | $0 |
| 65+ Years | 32 (56.1%) | $27,000 |
| Total | 57 (100.0%) | $38,281 |
Poverty in Parksville
Income Below Poverty by Sex and Age in Parksville
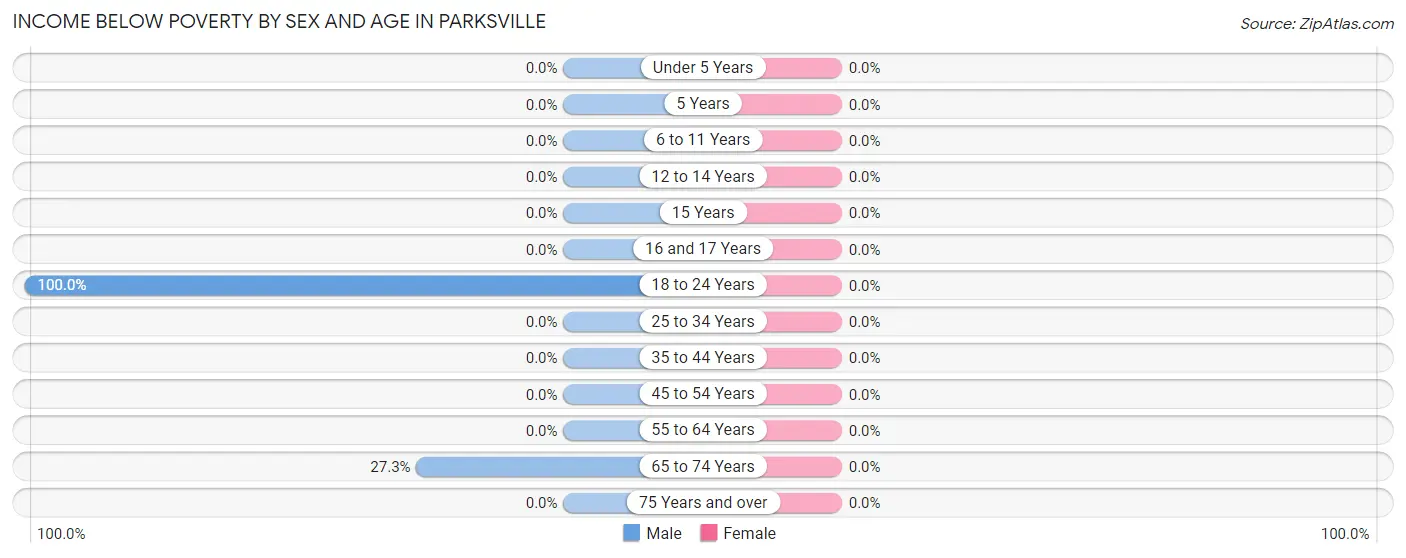
| Age Bracket | Male | Female |
| Under 5 Years | 0 (0.0%) | 0 (0.0%) |
| 5 Years | 0 (0.0%) | 0 (0.0%) |
| 6 to 11 Years | 0 (0.0%) | 0 (0.0%) |
| 12 to 14 Years | 0 (0.0%) | 0 (0.0%) |
| 15 Years | 0 (0.0%) | 0 (0.0%) |
| 16 and 17 Years | 0 (0.0%) | 0 (0.0%) |
| 18 to 24 Years | 4 (100.0%) | 0 (0.0%) |
| 25 to 34 Years | 0 (0.0%) | 0 (0.0%) |
| 35 to 44 Years | 0 (0.0%) | 0 (0.0%) |
| 45 to 54 Years | 0 (0.0%) | 0 (0.0%) |
| 55 to 64 Years | 0 (0.0%) | 0 (0.0%) |
| 65 to 74 Years | 3 (27.3%) | 0 (0.0%) |
| 75 Years and over | 0 (0.0%) | 0 (0.0%) |
| Total | 7 (13.2%) | 0 (0.0%) |
Income Above Poverty by Sex and Age in Parksville
According to the poverty statistics in Parksville, males aged 15 years and females aged 6 to 11 years are the age groups that are most secure financially, with 100.0% of males and 100.0% of females in these age groups living above the poverty line.
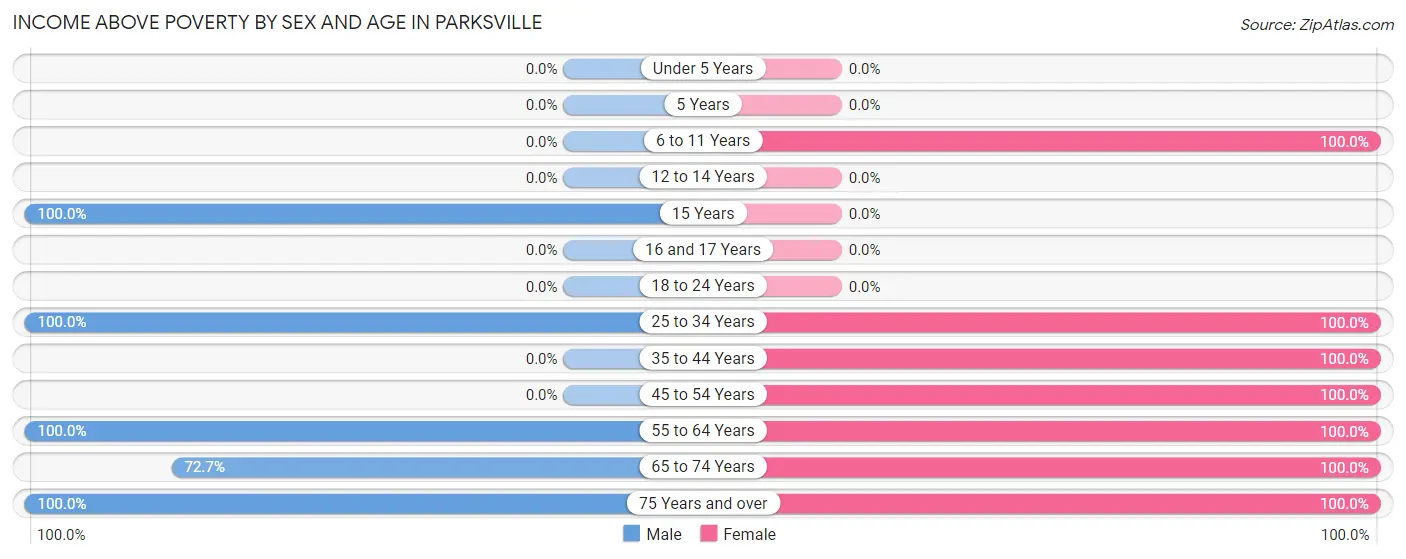
| Age Bracket | Male | Female |
| Under 5 Years | 0 (0.0%) | 0 (0.0%) |
| 5 Years | 0 (0.0%) | 0 (0.0%) |
| 6 to 11 Years | 0 (0.0%) | 2 (100.0%) |
| 12 to 14 Years | 0 (0.0%) | 0 (0.0%) |
| 15 Years | 1 (100.0%) | 0 (0.0%) |
| 16 and 17 Years | 0 (0.0%) | 0 (0.0%) |
| 18 to 24 Years | 0 (0.0%) | 0 (0.0%) |
| 25 to 34 Years | 5 (100.0%) | 1 (100.0%) |
| 35 to 44 Years | 0 (0.0%) | 1 (100.0%) |
| 45 to 54 Years | 0 (0.0%) | 7 (100.0%) |
| 55 to 64 Years | 27 (100.0%) | 14 (100.0%) |
| 65 to 74 Years | 8 (72.7%) | 5 (100.0%) |
| 75 Years and over | 5 (100.0%) | 19 (100.0%) |
| Total | 46 (86.8%) | 49 (100.0%) |
Income Below Poverty Among Married-Couple Families in Parksville
| Children | Above Poverty | Below Poverty |
| No Children | 24 (100.0%) | 0 (0.0%) |
| 1 or 2 Children | 0 (0.0%) | 0 (0.0%) |
| 3 or 4 Children | 0 (0.0%) | 0 (0.0%) |
| 5 or more Children | 0 (0.0%) | 0 (0.0%) |
| Total | 24 (100.0%) | 0 (0.0%) |
Income Below Poverty Among Single-Parent Households in Parksville
| Children | Single Father | Single Mother |
| No Children | 0 (0.0%) | 0 (0.0%) |
| 1 or 2 Children | 0 (0.0%) | 0 (0.0%) |
| 3 or 4 Children | 0 (0.0%) | 0 (0.0%) |
| 5 or more Children | 0 (0.0%) | 0 (0.0%) |
| Total | 0 (0.0%) | 0 (0.0%) |
Income Below Poverty Among Married-Couple vs Single-Parent Households in Parksville
| Children | Married-Couple Families | Single-Parent Households |
| No Children | 0 (0.0%) | 0 (0.0%) |
| 1 or 2 Children | 0 (0.0%) | 0 (0.0%) |
| 3 or 4 Children | 0 (0.0%) | 0 (0.0%) |
| 5 or more Children | 0 (0.0%) | 0 (0.0%) |
| Total | 0 (0.0%) | 0 (0.0%) |
Race in Parksville
The most populous races in Parksville are White / Caucasian (89 | 85.6%), Black / African American (13 | 12.5%), and Two or more Races (2 | 1.9%).
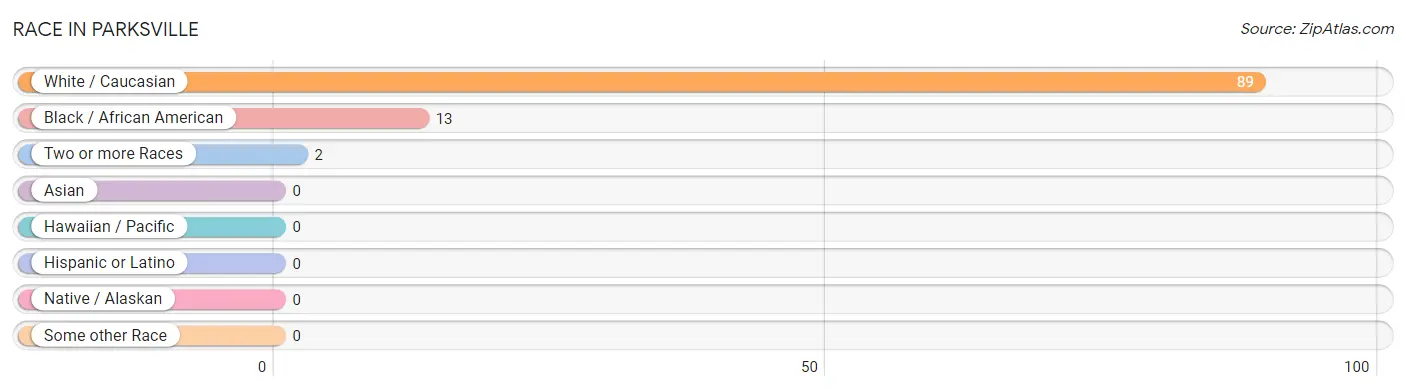
| Race | # Population | % Population |
| Asian | 0 | 0.0% |
| Black / African American | 13 | 12.5% |
| Hawaiian / Pacific | 0 | 0.0% |
| Hispanic or Latino | 0 | 0.0% |
| Native / Alaskan | 0 | 0.0% |
| White / Caucasian | 89 | 85.6% |
| Two or more Races | 2 | 1.9% |
| Some other Race | 0 | 0.0% |
| Total | 104 | 100.0% |
Ancestry in Parksville
The most populous ancestries reported in Parksville are American (17 | 16.4%), English (15 | 14.4%), Irish (12 | 11.5%), German (7 | 6.7%), and Polish (4 | 3.8%), together accounting for 52.9% of all Parksville residents.
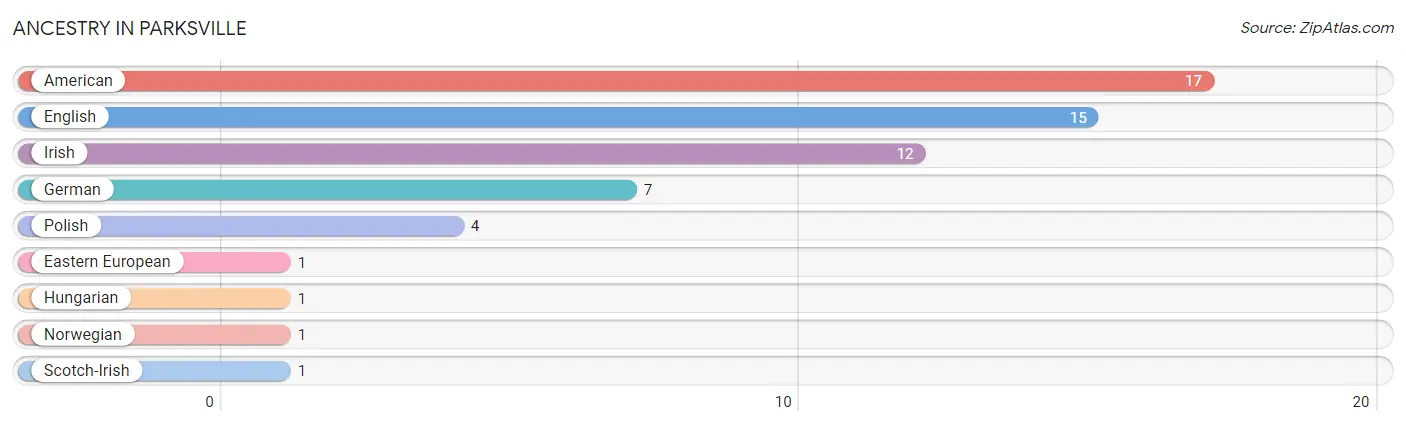
| Ancestry | # Population | % Population |
| American | 17 | 16.4% |
| Eastern European | 1 | 1.0% |
| English | 15 | 14.4% |
| German | 7 | 6.7% |
| Hungarian | 1 | 1.0% |
| Irish | 12 | 11.5% |
| Norwegian | 1 | 1.0% |
| Polish | 4 | 3.8% |
| Scotch-Irish | 1 | 1.0% | View All 9 Rows |
Immigrants in Parksville

| Immigration Origin | # Population | % Population | View All 0 Rows |
Sex and Age in Parksville
Sex and Age in Parksville
The most populous age groups in Parksville are 55 to 59 Years (21 | 39.6%) for men and 85 Years and over (14 | 27.5%) for women.
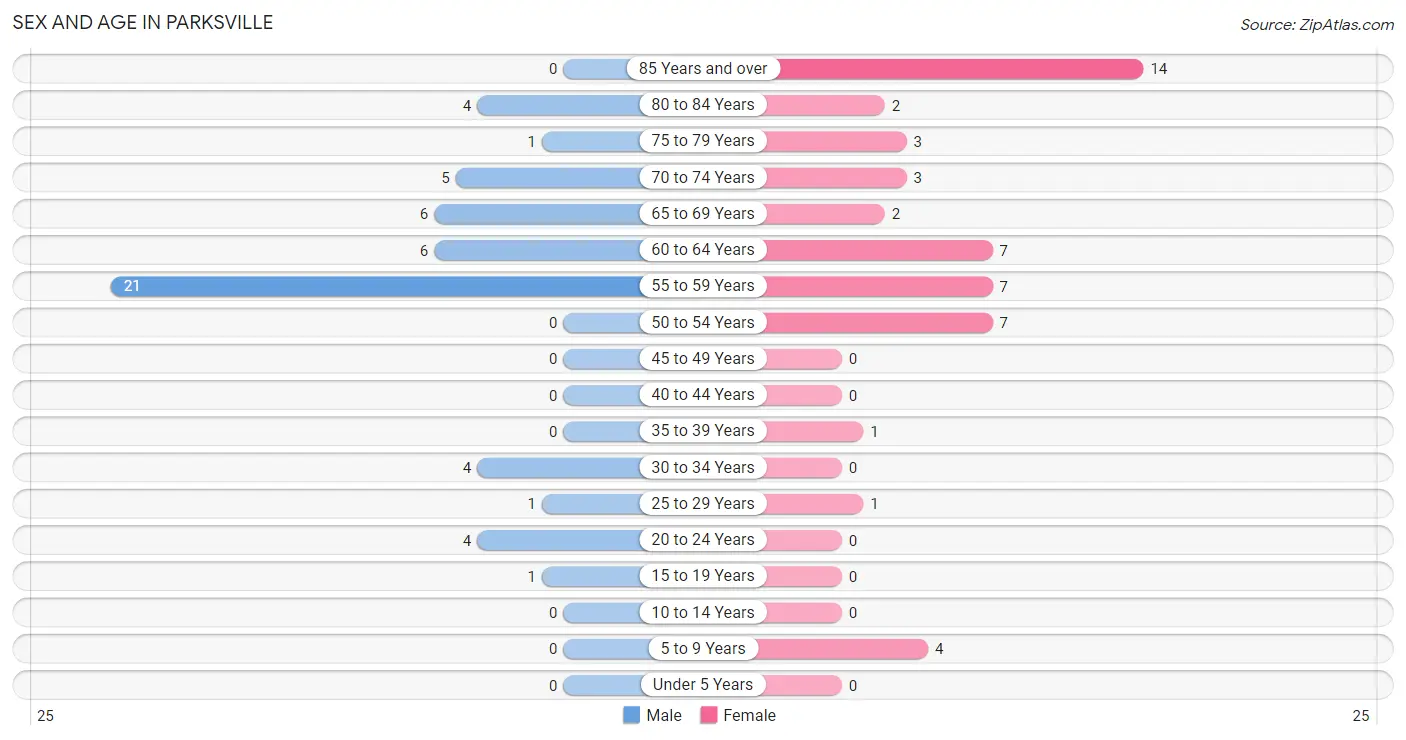
| Age Bracket | Male | Female |
| Under 5 Years | 0 (0.0%) | 0 (0.0%) |
| 5 to 9 Years | 0 (0.0%) | 4 (7.8%) |
| 10 to 14 Years | 0 (0.0%) | 0 (0.0%) |
| 15 to 19 Years | 1 (1.9%) | 0 (0.0%) |
| 20 to 24 Years | 4 (7.5%) | 0 (0.0%) |
| 25 to 29 Years | 1 (1.9%) | 1 (2.0%) |
| 30 to 34 Years | 4 (7.5%) | 0 (0.0%) |
| 35 to 39 Years | 0 (0.0%) | 1 (2.0%) |
| 40 to 44 Years | 0 (0.0%) | 0 (0.0%) |
| 45 to 49 Years | 0 (0.0%) | 0 (0.0%) |
| 50 to 54 Years | 0 (0.0%) | 7 (13.7%) |
| 55 to 59 Years | 21 (39.6%) | 7 (13.7%) |
| 60 to 64 Years | 6 (11.3%) | 7 (13.7%) |
| 65 to 69 Years | 6 (11.3%) | 2 (3.9%) |
| 70 to 74 Years | 5 (9.4%) | 3 (5.9%) |
| 75 to 79 Years | 1 (1.9%) | 3 (5.9%) |
| 80 to 84 Years | 4 (7.5%) | 2 (3.9%) |
| 85 Years and over | 0 (0.0%) | 14 (27.5%) |
| Total | 53 (100.0%) | 51 (100.0%) |
Families and Households in Parksville
Median Family Size in Parksville
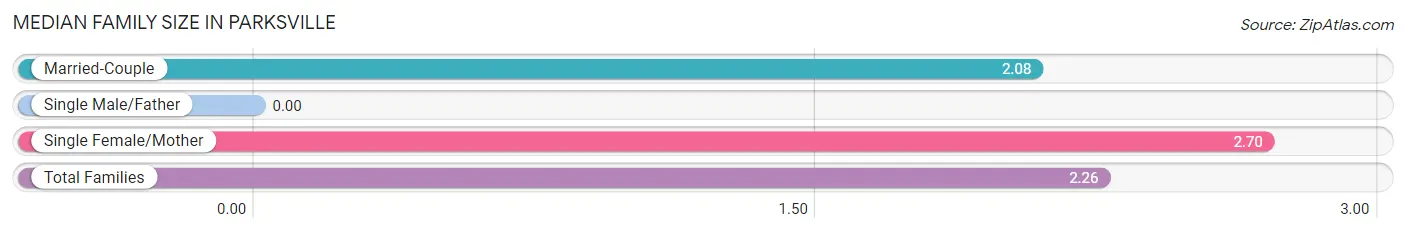
| Family Type | # Families | Family Size |
| Married-Couple | 24 (70.6%) | 2.08 |
| Single Male/Father | 0 (0.0%) | - |
| Single Female/Mother | 10 (29.4%) | 2.70 |
| Total Families | 34 (100.0%) | 2.26 |
Median Household Size in Parksville
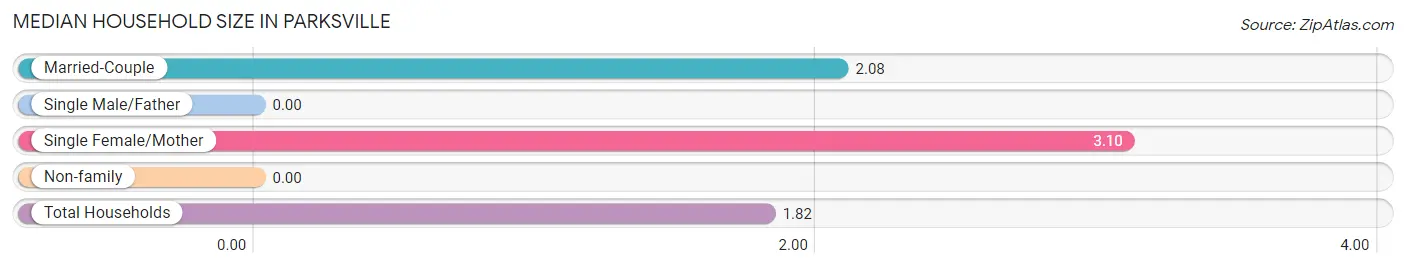
| Household Type | # Households | Household Size |
| Married-Couple | 24 (42.1%) | 2.08 |
| Single Male/Father | 0 (0.0%) | - |
| Single Female/Mother | 10 (17.5%) | 3.10 |
| Non-family | 23 (40.4%) | - |
| Total Households | 57 (100.0%) | 1.82 |
Household Size by Marriage Status in Parksville
Out of a total of 57 households in Parksville, 34 (59.7%) are family households, while 23 (40.4%) are nonfamily households. The most numerous type of family households are 2-person households, comprising 33, and the most common type of nonfamily households are 1-person households, comprising 23.
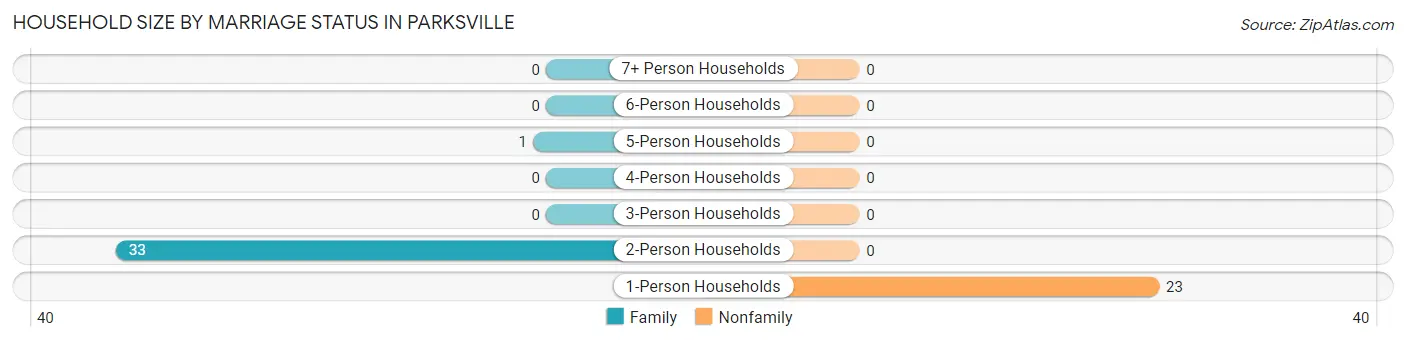
| Household Size | Family Households | Nonfamily Households |
| 1-Person Households | - | 23 (40.4%) |
| 2-Person Households | 33 (57.9%) | 0 (0.0%) |
| 3-Person Households | 0 (0.0%) | 0 (0.0%) |
| 4-Person Households | 0 (0.0%) | 0 (0.0%) |
| 5-Person Households | 1 (1.8%) | 0 (0.0%) |
| 6-Person Households | 0 (0.0%) | 0 (0.0%) |
| 7+ Person Households | 0 (0.0%) | 0 (0.0%) |
| Total | 34 (59.7%) | 23 (40.4%) |
Female Fertility in Parksville
Fertility by Age in Parksville
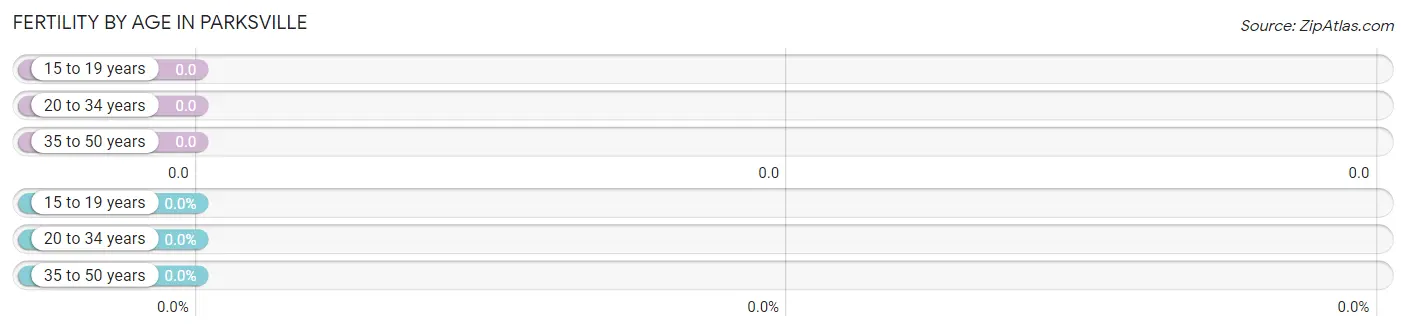
| Age Bracket | Women with Births | Births / 1,000 Women |
| 15 to 19 years | 0 (0.0%) | 0.0 |
| 20 to 34 years | 0 (0.0%) | 0.0 |
| 35 to 50 years | 0 (0.0%) | 0.0 |
| Total | 0 (0.0%) | 0.0 |
Fertility by Age by Marriage Status in Parksville
| Age Bracket | Married | Unmarried |
| 15 to 19 years | 0 (0.0%) | 0 (0.0%) |
| 20 to 34 years | 0 (0.0%) | 0 (0.0%) |
| 35 to 50 years | 0 (0.0%) | 0 (0.0%) |
| Total | 0 (0.0%) | 0 (0.0%) |
Fertility by Education in Parksville
| Educational Attainment | Women with Births | Births / 1,000 Women |
| Less than High School | 0 (0.0%) | 0.0 |
| High School Diploma | 0 (0.0%) | 0.0 |
| College or Associate's Degree | 0 (0.0%) | 0.0 |
| Bachelor's Degree | 0 (0.0%) | 0.0 |
| Graduate Degree | 0 (0.0%) | 0.0 |
| Total | 0 (0.0%) | 0.0 |
Fertility by Education by Marriage Status in Parksville
| Educational Attainment | Married | Unmarried |
| Less than High School | 0 (0.0%) | 0 (0.0%) |
| High School Diploma | 0 (0.0%) | 0 (0.0%) |
| College or Associate's Degree | 0 (0.0%) | 0 (0.0%) |
| Bachelor's Degree | 0 (0.0%) | 0 (0.0%) |
| Graduate Degree | 0 (0.0%) | 0 (0.0%) |
| Total | 0 (0.0%) | 0 (0.0%) |
Employment Characteristics in Parksville
Employment by Class of Employer in Parksville
Among the 39 employed individuals in Parksville, private company employees (23 | 59.0%), self-employed (not incorporated) (6 | 15.4%), and local government employees (5 | 12.8%) make up the most common classes of employment.
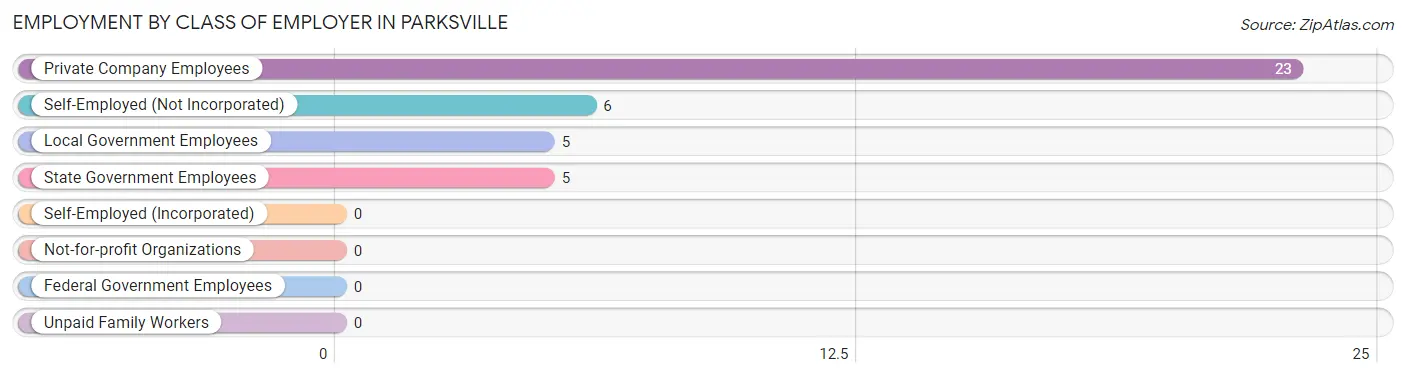
| Employer Class | # Employees | % Employees |
| Private Company Employees | 23 | 59.0% |
| Self-Employed (Incorporated) | 0 | 0.0% |
| Self-Employed (Not Incorporated) | 6 | 15.4% |
| Not-for-profit Organizations | 0 | 0.0% |
| Local Government Employees | 5 | 12.8% |
| State Government Employees | 5 | 12.8% |
| Federal Government Employees | 0 | 0.0% |
| Unpaid Family Workers | 0 | 0.0% |
| Total | 39 | 100.0% |
Employment Status by Age in Parksville
According to the labor force statistics for Parksville, out of the total population over 16 years of age (99), 41.4% or 41 individuals are in the labor force, with 4.9% or 2 of them unemployed. The age group with the highest labor force participation rate is 20 to 24 years, with 100.0% or 4 individuals in the labor force. Within the labor force, the 30 to 34 years age range has the highest percentage of unemployed individuals, with 50.0% or 2 of them being unemployed.
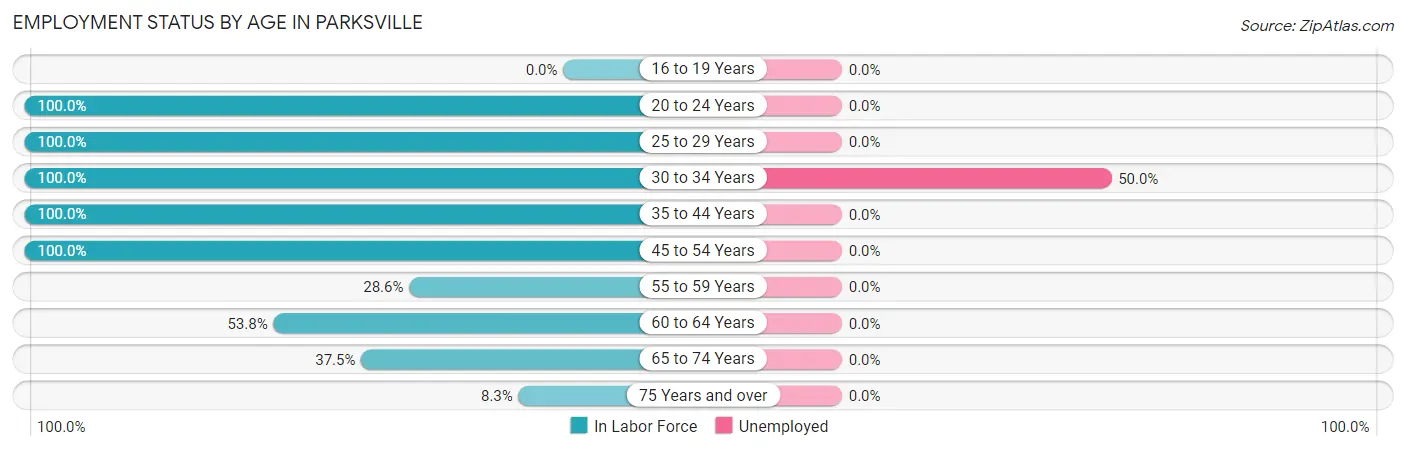
| Age Bracket | In Labor Force | Unemployed |
| 16 to 19 Years | 0 (0.0%) | 0 (0.0%) |
| 20 to 24 Years | 4 (100.0%) | 0 (0.0%) |
| 25 to 29 Years | 2 (100.0%) | 0 (0.0%) |
| 30 to 34 Years | 4 (100.0%) | 2 (50.0%) |
| 35 to 44 Years | 1 (100.0%) | 0 (0.0%) |
| 45 to 54 Years | 7 (100.0%) | 0 (0.0%) |
| 55 to 59 Years | 8 (28.6%) | 0 (0.0%) |
| 60 to 64 Years | 7 (53.8%) | 0 (0.0%) |
| 65 to 74 Years | 6 (37.5%) | 0 (0.0%) |
| 75 Years and over | 2 (8.3%) | 0 (0.0%) |
| Total | 41 (41.4%) | 2 (4.9%) |
Employment Status by Educational Attainment in Parksville
According to labor force statistics for Parksville, 52.7% of individuals (29) out of the total population between 25 and 64 years of age (55) are in the labor force, with 6.9% or 2 of them being unemployed. The group with the highest labor force participation rate are those with the educational attainment of bachelor's degree or higher, with 100.0% or 11 individuals in the labor force. Within the labor force, individuals with high school diploma education have the highest percentage of unemployment, with 28.6% or 2 of them being unemployed.
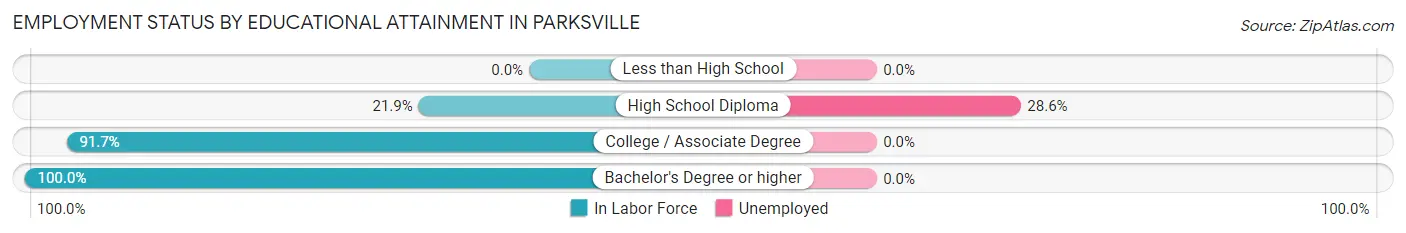
| Educational Attainment | In Labor Force | Unemployed |
| Less than High School | 0 (0.0%) | 0 (0.0%) |
| High School Diploma | 7 (21.9%) | 9 (28.6%) |
| College / Associate Degree | 11 (91.7%) | 0 (0.0%) |
| Bachelor's Degree or higher | 11 (100.0%) | 0 (0.0%) |
| Total | 29 (52.7%) | 4 (6.9%) |
Employment Occupations by Sex in Parksville
Management, Business, Science and Arts Occupations
The most common Management, Business, Science and Arts occupations in Parksville are Community & Social Service (9 | 23.1%), Education Instruction & Library (7 | 17.9%), Health Diagnosing & Treating (7 | 17.9%), Computers, Engineering & Science (2 | 5.1%), and Arts, Media & Entertainment (2 | 5.1%).
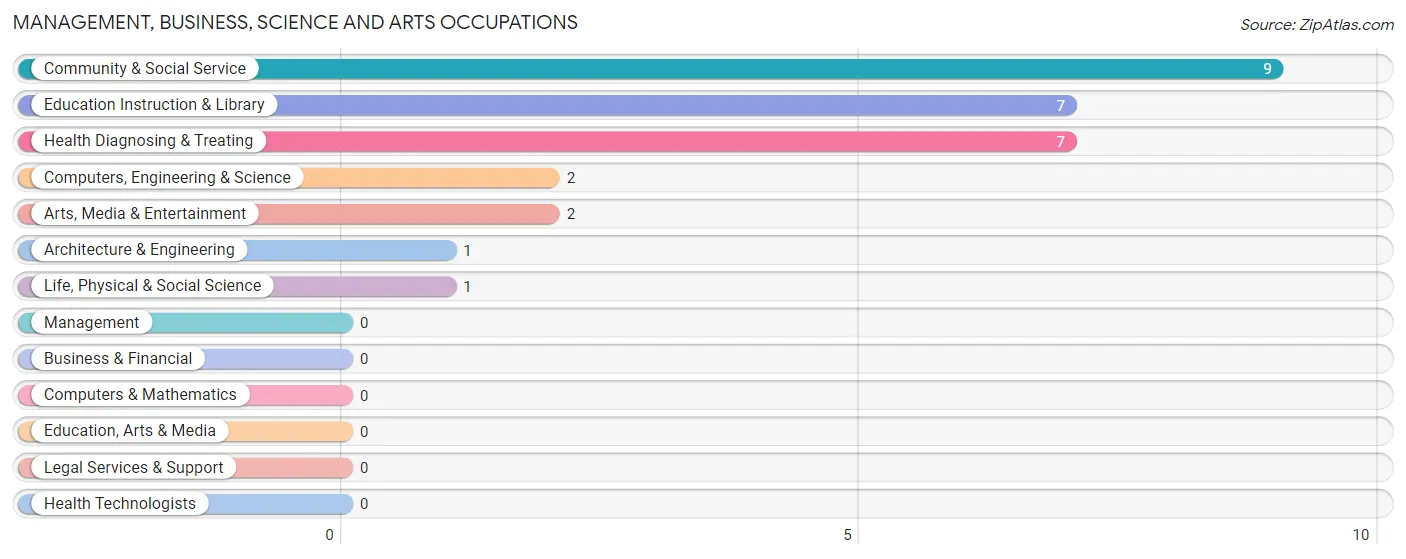
Management, Business, Science and Arts Occupations by Sex
Within the Management, Business, Science and Arts occupations in Parksville, the most male-oriented occupations are Computers, Engineering & Science (100.0%), Architecture & Engineering (100.0%), and Life, Physical & Social Science (100.0%), while the most female-oriented occupations are Education Instruction & Library (100.0%), Community & Social Service (77.8%), and Health Diagnosing & Treating (42.9%).
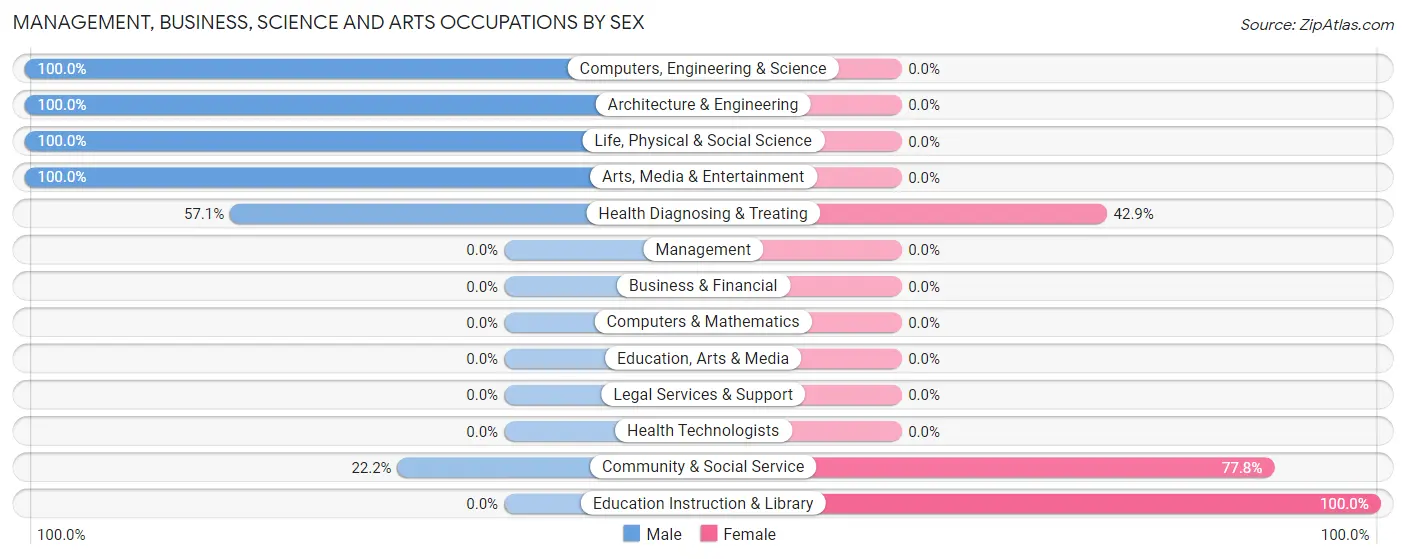
| Occupation | Male | Female |
| Management | 0 (0.0%) | 0 (0.0%) |
| Business & Financial | 0 (0.0%) | 0 (0.0%) |
| Computers, Engineering & Science | 2 (100.0%) | 0 (0.0%) |
| Computers & Mathematics | 0 (0.0%) | 0 (0.0%) |
| Architecture & Engineering | 1 (100.0%) | 0 (0.0%) |
| Life, Physical & Social Science | 1 (100.0%) | 0 (0.0%) |
| Community & Social Service | 2 (22.2%) | 7 (77.8%) |
| Education, Arts & Media | 0 (0.0%) | 0 (0.0%) |
| Legal Services & Support | 0 (0.0%) | 0 (0.0%) |
| Education Instruction & Library | 0 (0.0%) | 7 (100.0%) |
| Arts, Media & Entertainment | 2 (100.0%) | 0 (0.0%) |
| Health Diagnosing & Treating | 4 (57.1%) | 3 (42.9%) |
| Health Technologists | 0 (0.0%) | 0 (0.0%) |
| Total (Category) | 8 (44.4%) | 10 (55.6%) |
| Total (Overall) | 27 (69.2%) | 12 (30.8%) |
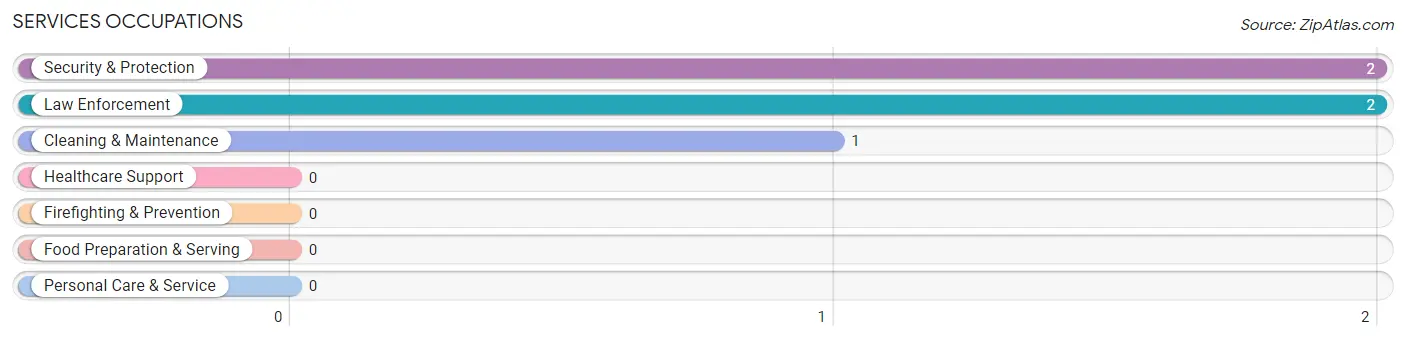
Services Occupations
The most common Services occupations in Parksville are Security & Protection (2 | 5.1%), Law Enforcement (2 | 5.1%), and Cleaning & Maintenance (1 | 2.6%).
Services Occupations by Sex
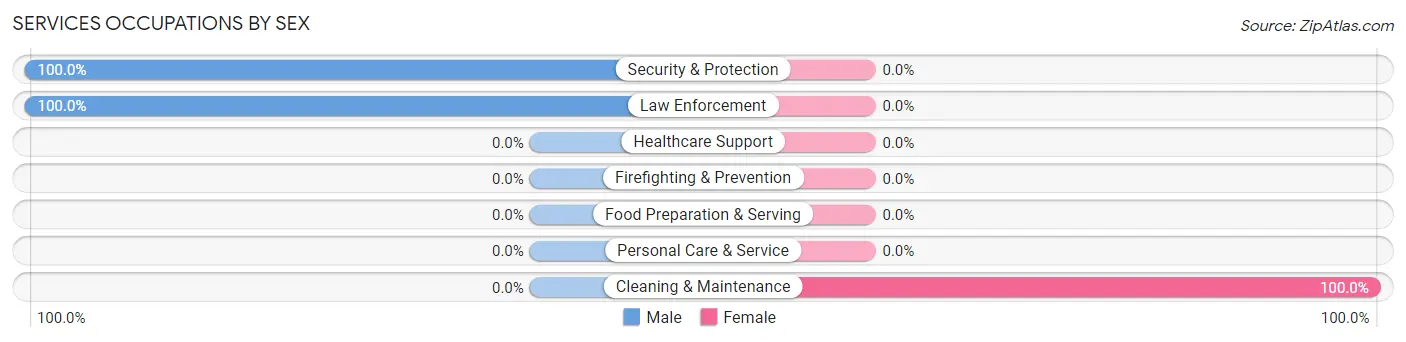
| Occupation | Male | Female |
| Healthcare Support | 0 (0.0%) | 0 (0.0%) |
| Security & Protection | 2 (100.0%) | 0 (0.0%) |
| Firefighting & Prevention | 0 (0.0%) | 0 (0.0%) |
| Law Enforcement | 2 (100.0%) | 0 (0.0%) |
| Food Preparation & Serving | 0 (0.0%) | 0 (0.0%) |
| Cleaning & Maintenance | 0 (0.0%) | 1 (100.0%) |
| Personal Care & Service | 0 (0.0%) | 0 (0.0%) |
| Total (Category) | 2 (66.7%) | 1 (33.3%) |
| Total (Overall) | 27 (69.2%) | 12 (30.8%) |
Sales and Office Occupations
The most common Sales and Office occupations in Parksville are , and Sales & Related (2 | 5.1%).
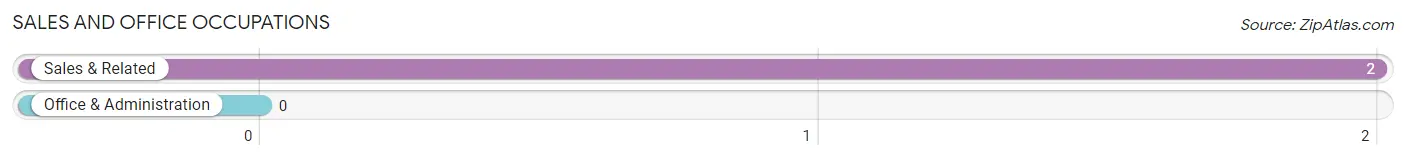
Sales and Office Occupations by Sex
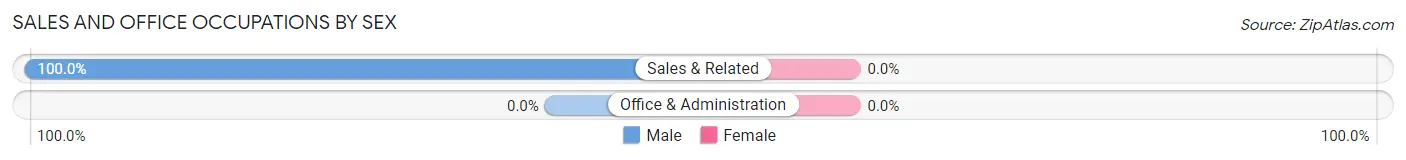
| Occupation | Male | Female |
| Sales & Related | 2 (100.0%) | 0 (0.0%) |
| Office & Administration | 0 (0.0%) | 0 (0.0%) |
| Total (Category) | 2 (100.0%) | 0 (0.0%) |
| Total (Overall) | 27 (69.2%) | 12 (30.8%) |
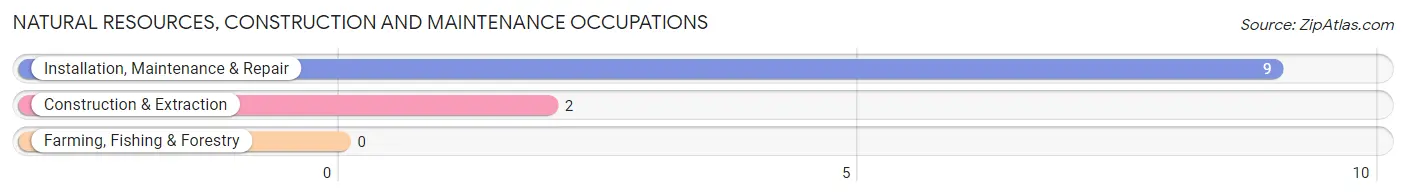
Natural Resources, Construction and Maintenance Occupations
The most common Natural Resources, Construction and Maintenance occupations in Parksville are Installation, Maintenance & Repair (9 | 23.1%), and Construction & Extraction (2 | 5.1%).
Natural Resources, Construction and Maintenance Occupations by Sex
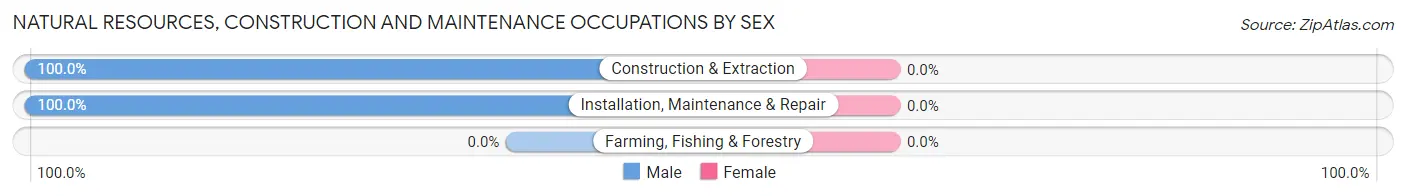
| Occupation | Male | Female |
| Farming, Fishing & Forestry | 0 (0.0%) | 0 (0.0%) |
| Construction & Extraction | 2 (100.0%) | 0 (0.0%) |
| Installation, Maintenance & Repair | 9 (100.0%) | 0 (0.0%) |
| Total (Category) | 11 (100.0%) | 0 (0.0%) |
| Total (Overall) | 27 (69.2%) | 12 (30.8%) |
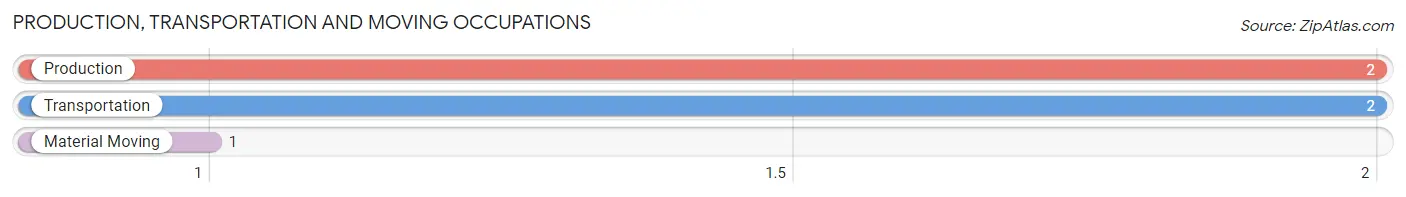
Production, Transportation and Moving Occupations
The most common Production, Transportation and Moving occupations in Parksville are Production (2 | 5.1%), Transportation (2 | 5.1%), and Material Moving (1 | 2.6%).
Production, Transportation and Moving Occupations by Sex
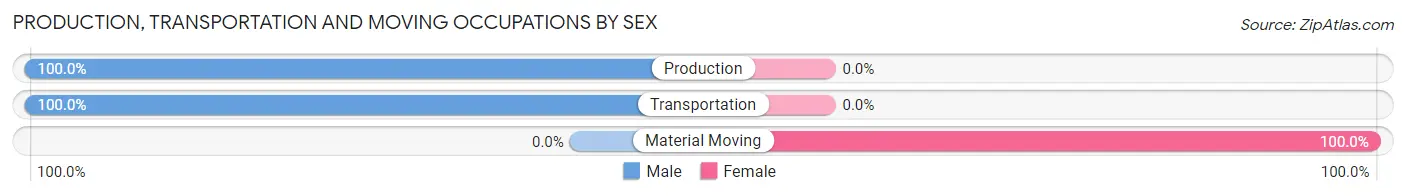
| Occupation | Male | Female |
| Production | 2 (100.0%) | 0 (0.0%) |
| Transportation | 2 (100.0%) | 0 (0.0%) |
| Material Moving | 0 (0.0%) | 1 (100.0%) |
| Total (Category) | 4 (80.0%) | 1 (20.0%) |
| Total (Overall) | 27 (69.2%) | 12 (30.8%) |
Employment Industries by Sex in Parksville
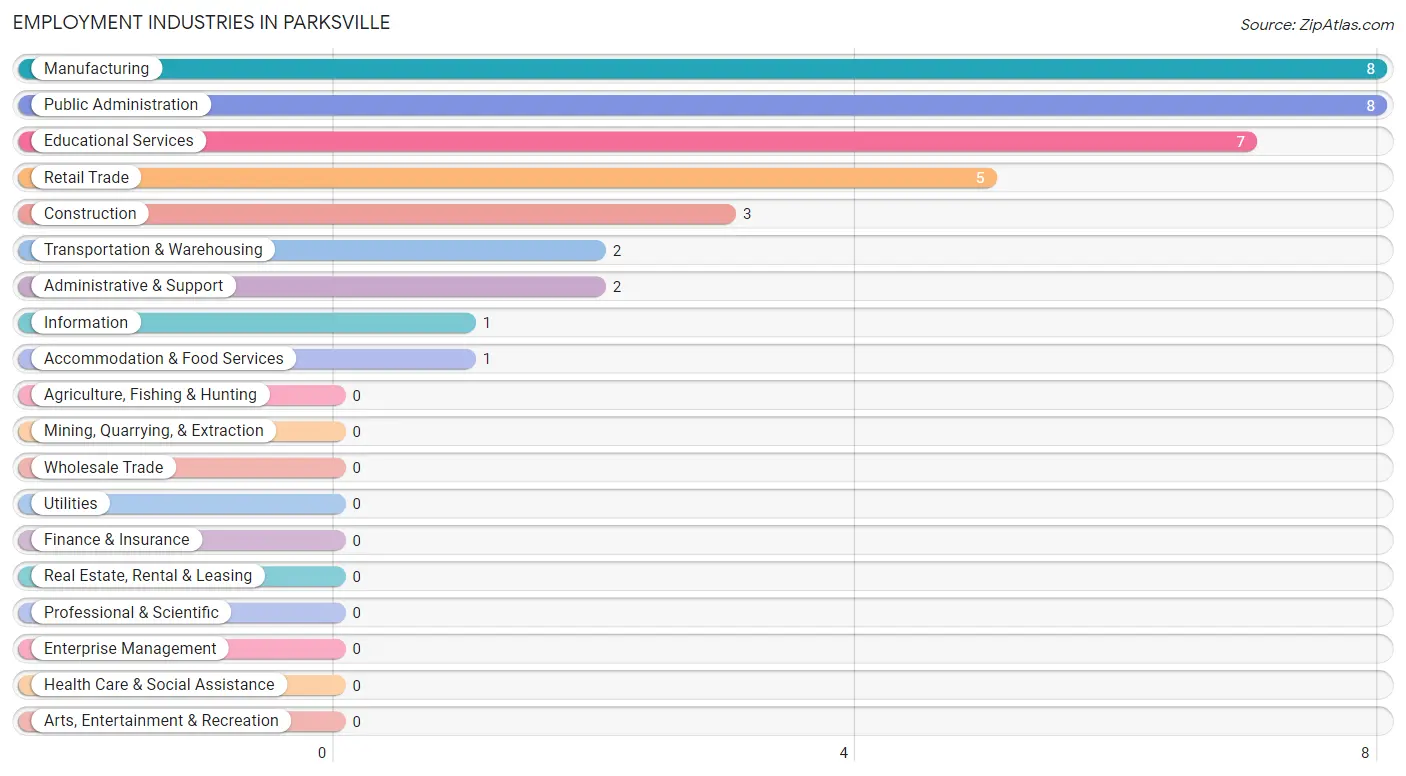
Employment Industries in Parksville
The major employment industries in Parksville include Manufacturing (8 | 20.5%), Public Administration (8 | 20.5%), Educational Services (7 | 17.9%), Retail Trade (5 | 12.8%), and Construction (3 | 7.7%).
Employment Industries by Sex in Parksville
The Parksville industries that see more men than women are Manufacturing (100.0%), Retail Trade (100.0%), and Transportation & Warehousing (100.0%), whereas the industries that tend to have a higher number of women are Educational Services (100.0%), Accommodation & Food Services (100.0%), and Construction (33.3%).
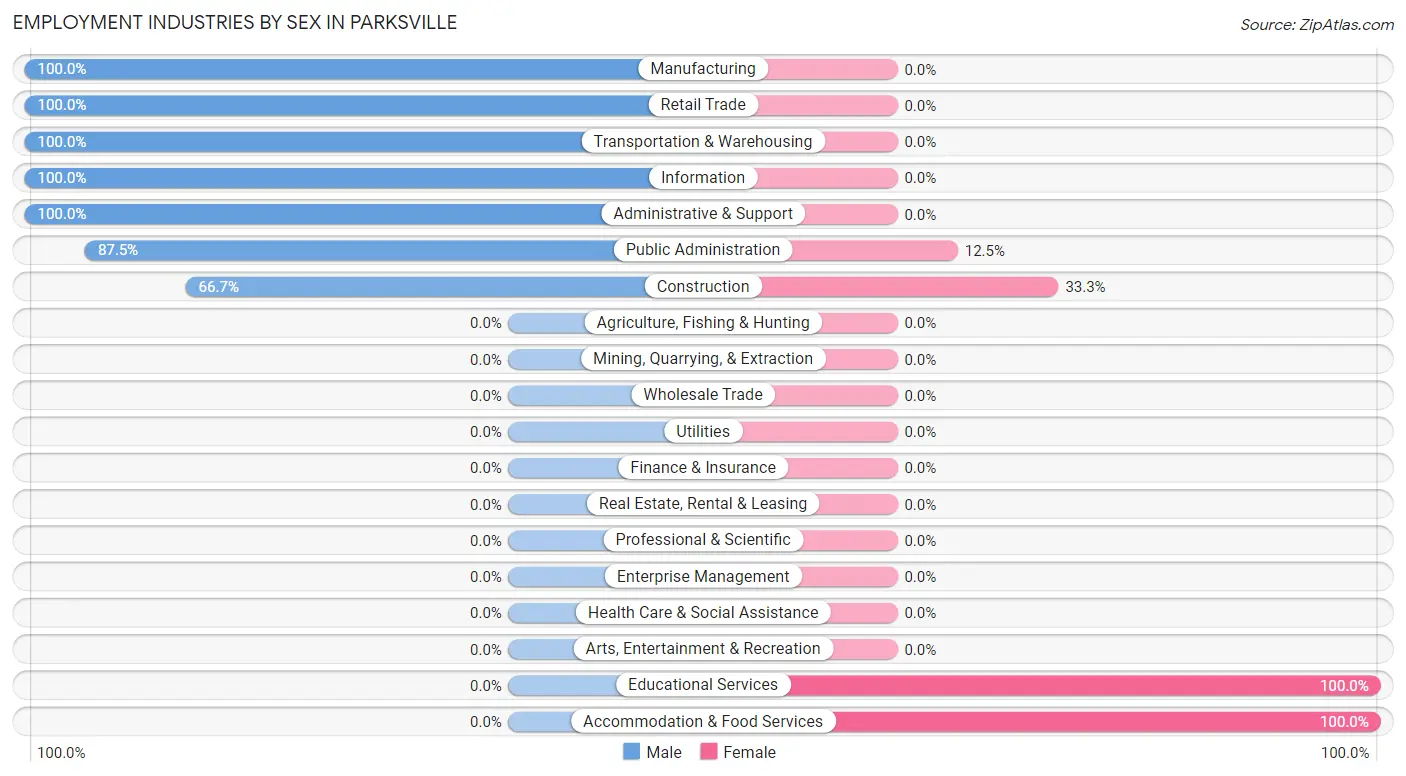
| Industry | Male | Female |
| Agriculture, Fishing & Hunting | 0 (0.0%) | 0 (0.0%) |
| Mining, Quarrying, & Extraction | 0 (0.0%) | 0 (0.0%) |
| Construction | 2 (66.7%) | 1 (33.3%) |
| Manufacturing | 8 (100.0%) | 0 (0.0%) |
| Wholesale Trade | 0 (0.0%) | 0 (0.0%) |
| Retail Trade | 5 (100.0%) | 0 (0.0%) |
| Transportation & Warehousing | 2 (100.0%) | 0 (0.0%) |
| Utilities | 0 (0.0%) | 0 (0.0%) |
| Information | 1 (100.0%) | 0 (0.0%) |
| Finance & Insurance | 0 (0.0%) | 0 (0.0%) |
| Real Estate, Rental & Leasing | 0 (0.0%) | 0 (0.0%) |
| Professional & Scientific | 0 (0.0%) | 0 (0.0%) |
| Enterprise Management | 0 (0.0%) | 0 (0.0%) |
| Administrative & Support | 2 (100.0%) | 0 (0.0%) |
| Educational Services | 0 (0.0%) | 7 (100.0%) |
| Health Care & Social Assistance | 0 (0.0%) | 0 (0.0%) |
| Arts, Entertainment & Recreation | 0 (0.0%) | 0 (0.0%) |
| Accommodation & Food Services | 0 (0.0%) | 1 (100.0%) |
| Public Administration | 7 (87.5%) | 1 (12.5%) |
| Total | 27 (69.2%) | 12 (30.8%) |
Education in Parksville
School Enrollment in Parksville
The most common levels of schooling among the 9 students in Parksville are elementary school (4 | 44.4%), college / undergraduate (4 | 44.4%), and high school (1 | 11.1%).
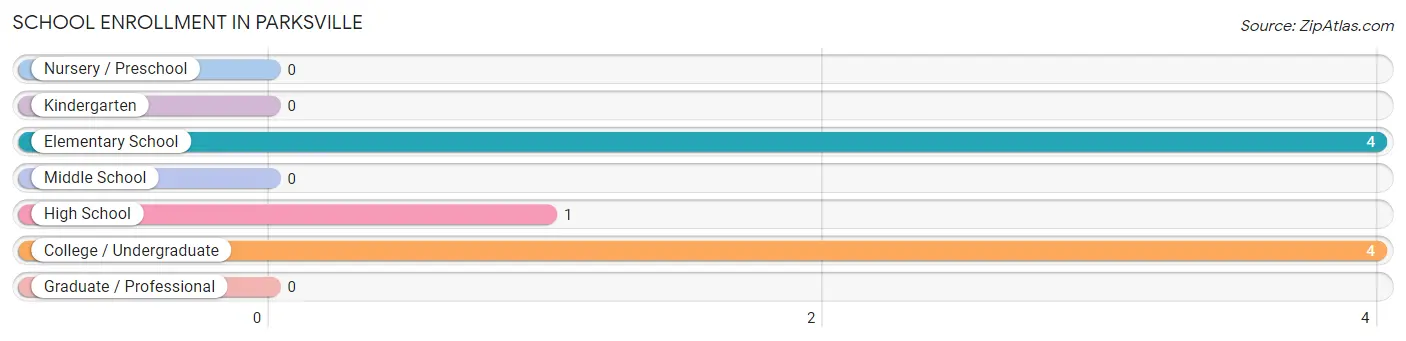
| School Level | # Students | % Students |
| Nursery / Preschool | 0 | 0.0% |
| Kindergarten | 0 | 0.0% |
| Elementary School | 4 | 44.4% |
| Middle School | 0 | 0.0% |
| High School | 1 | 11.1% |
| College / Undergraduate | 4 | 44.4% |
| Graduate / Professional | 0 | 0.0% |
| Total | 9 | 100.0% |
School Enrollment by Age by Funding Source in Parksville
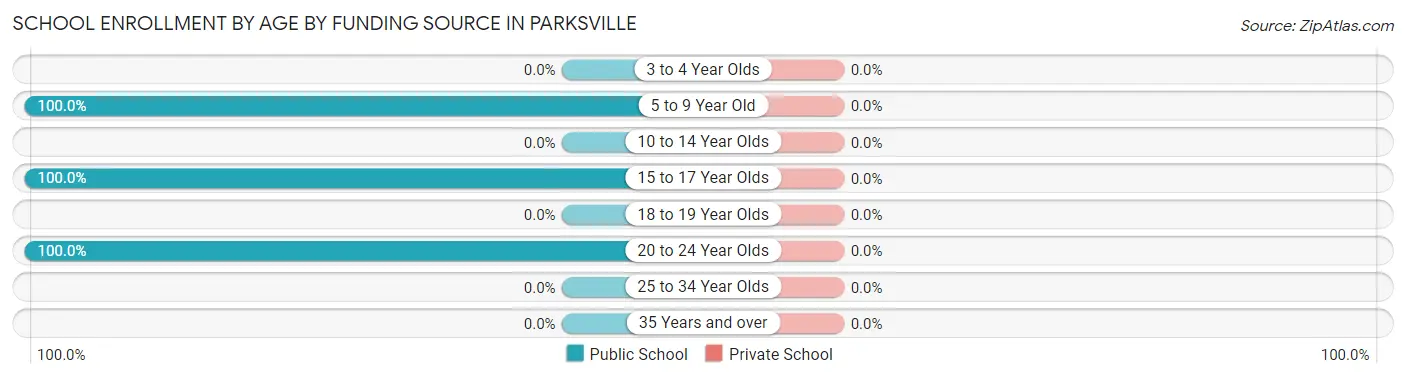
| Age Bracket | Public School | Private School |
| 3 to 4 Year Olds | 0 (0.0%) | 0 (0.0%) |
| 5 to 9 Year Old | 4 (100.0%) | 0 (0.0%) |
| 10 to 14 Year Olds | 0 (0.0%) | 0 (0.0%) |
| 15 to 17 Year Olds | 1 (100.0%) | 0 (0.0%) |
| 18 to 19 Year Olds | 0 (0.0%) | 0 (0.0%) |
| 20 to 24 Year Olds | 4 (100.0%) | 0 (0.0%) |
| 25 to 34 Year Olds | 0 (0.0%) | 0 (0.0%) |
| 35 Years and over | 0 (0.0%) | 0 (0.0%) |
| Total | 9 (100.0%) | 0 (0.0%) |
Educational Attainment by Field of Study in Parksville
Science & technology (7 | 43.8%), business (4 | 25.0%), bio, nature & agricultural (2 | 12.5%), education (2 | 12.5%), and social sciences (1 | 6.2%) are the most common fields of study among 16 individuals in Parksville who have obtained a bachelor's degree or higher.
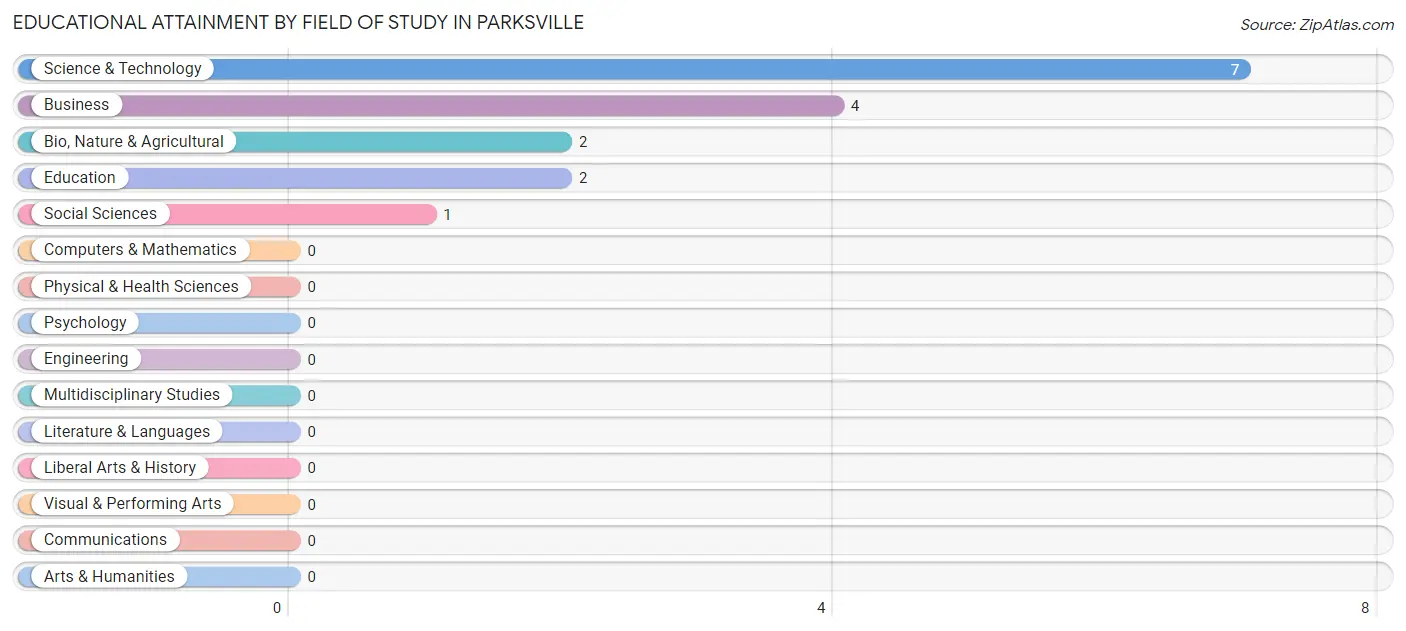
| Field of Study | # Graduates | % Graduates |
| Computers & Mathematics | 0 | 0.0% |
| Bio, Nature & Agricultural | 2 | 12.5% |
| Physical & Health Sciences | 0 | 0.0% |
| Psychology | 0 | 0.0% |
| Social Sciences | 1 | 6.2% |
| Engineering | 0 | 0.0% |
| Multidisciplinary Studies | 0 | 0.0% |
| Science & Technology | 7 | 43.8% |
| Business | 4 | 25.0% |
| Education | 2 | 12.5% |
| Literature & Languages | 0 | 0.0% |
| Liberal Arts & History | 0 | 0.0% |
| Visual & Performing Arts | 0 | 0.0% |
| Communications | 0 | 0.0% |
| Arts & Humanities | 0 | 0.0% |
| Total | 16 | 100.0% |
Transportation & Commute in Parksville
Vehicle Availability by Sex in Parksville
The most prevalent vehicle ownership categories in Parksville are males with 3 vehicles (11, accounting for 40.7%) and females with 3 vehicles (10, making up 91.7%).
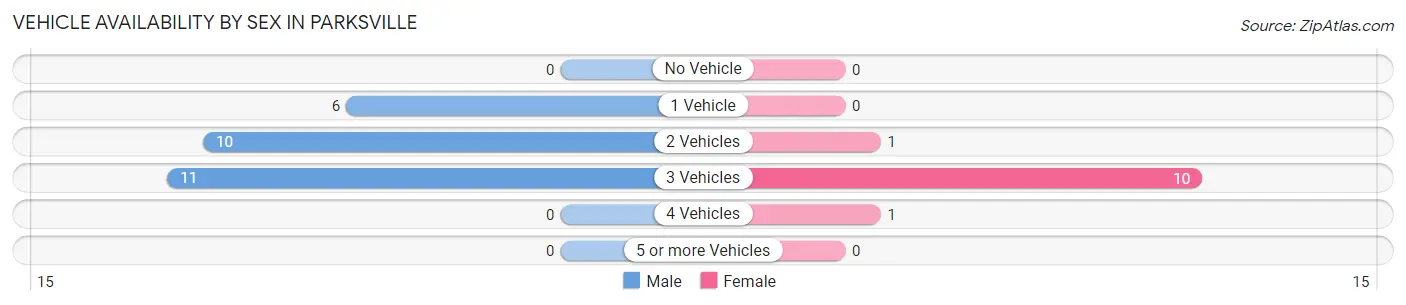
| Vehicles Available | Male | Female |
| No Vehicle | 0 (0.0%) | 0 (0.0%) |
| 1 Vehicle | 6 (22.2%) | 0 (0.0%) |
| 2 Vehicles | 10 (37.0%) | 1 (8.3%) |
| 3 Vehicles | 11 (40.7%) | 10 (83.3%) |
| 4 Vehicles | 0 (0.0%) | 1 (8.3%) |
| 5 or more Vehicles | 0 (0.0%) | 0 (0.0%) |
| Total | 27 (100.0%) | 12 (100.0%) |
Commute Time in Parksville
The most frequently occuring commute durations in Parksville are 45 to 59 minutes (9 commuters, 24.3%), 35 to 39 minutes (7 commuters, 18.9%), and 60 to 89 minutes (7 commuters, 18.9%).
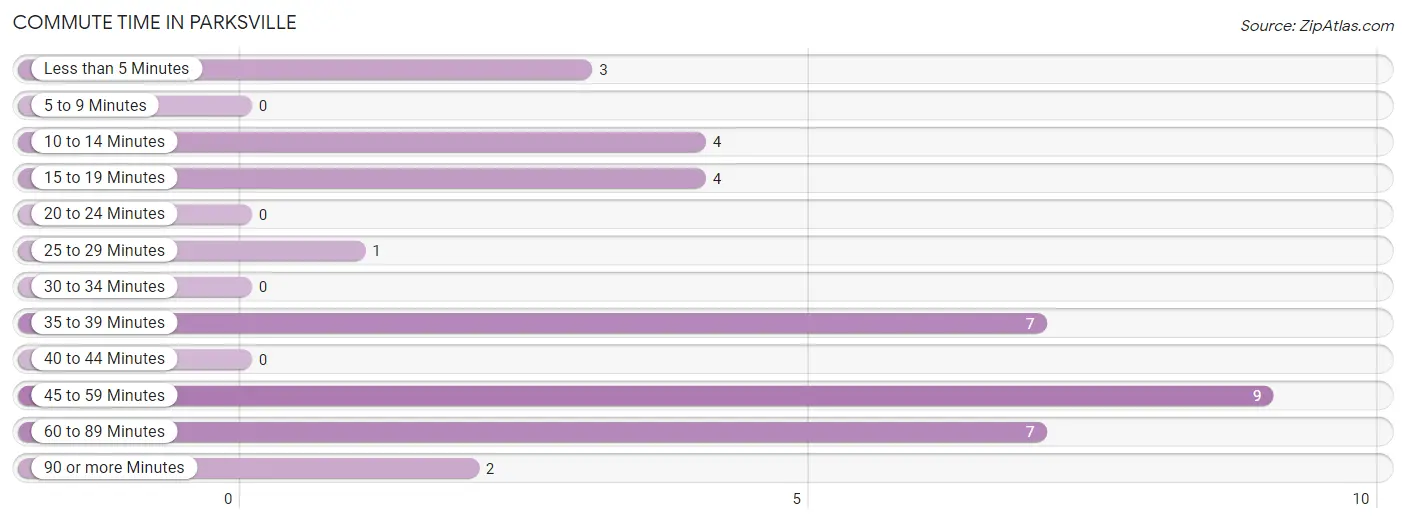
| Commute Time | # Commuters | % Commuters |
| Less than 5 Minutes | 3 | 8.1% |
| 5 to 9 Minutes | 0 | 0.0% |
| 10 to 14 Minutes | 4 | 10.8% |
| 15 to 19 Minutes | 4 | 10.8% |
| 20 to 24 Minutes | 0 | 0.0% |
| 25 to 29 Minutes | 1 | 2.7% |
| 30 to 34 Minutes | 0 | 0.0% |
| 35 to 39 Minutes | 7 | 18.9% |
| 40 to 44 Minutes | 0 | 0.0% |
| 45 to 59 Minutes | 9 | 24.3% |
| 60 to 89 Minutes | 7 | 18.9% |
| 90 or more Minutes | 2 | 5.4% |
Commute Time by Sex in Parksville
The most common commute times in Parksville are 45 to 59 minutes (9 commuters, 33.3%) for males and 35 to 39 minutes (7 commuters, 70.0%) for females.
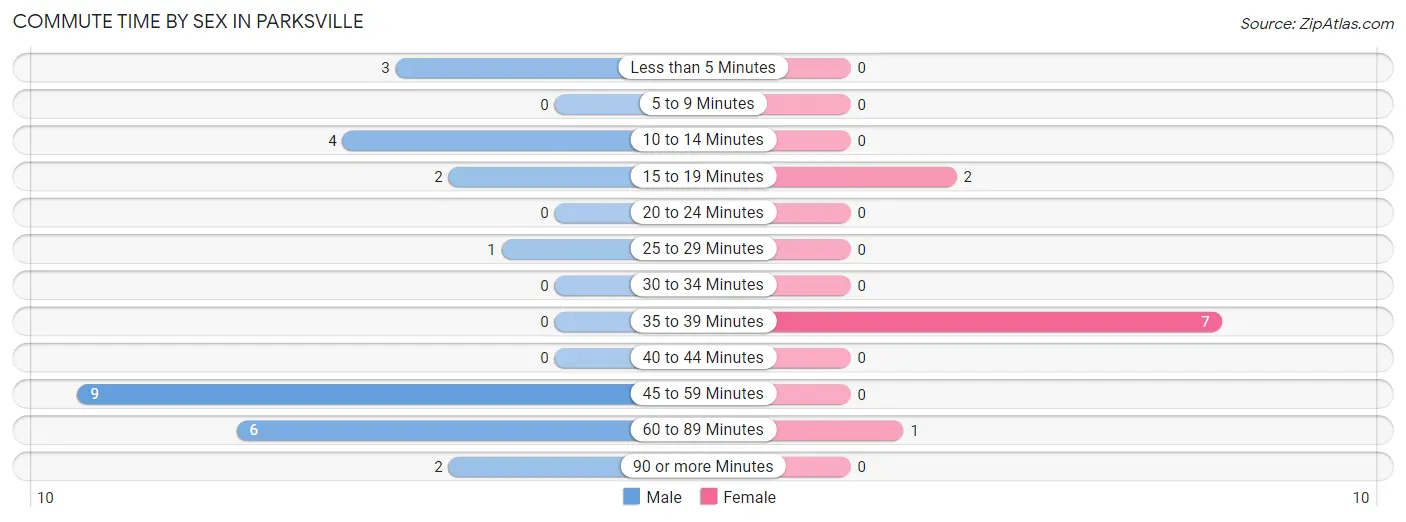
| Commute Time | Male | Female |
| Less than 5 Minutes | 3 (11.1%) | 0 (0.0%) |
| 5 to 9 Minutes | 0 (0.0%) | 0 (0.0%) |
| 10 to 14 Minutes | 4 (14.8%) | 0 (0.0%) |
| 15 to 19 Minutes | 2 (7.4%) | 2 (20.0%) |
| 20 to 24 Minutes | 0 (0.0%) | 0 (0.0%) |
| 25 to 29 Minutes | 1 (3.7%) | 0 (0.0%) |
| 30 to 34 Minutes | 0 (0.0%) | 0 (0.0%) |
| 35 to 39 Minutes | 0 (0.0%) | 7 (70.0%) |
| 40 to 44 Minutes | 0 (0.0%) | 0 (0.0%) |
| 45 to 59 Minutes | 9 (33.3%) | 0 (0.0%) |
| 60 to 89 Minutes | 6 (22.2%) | 1 (10.0%) |
| 90 or more Minutes | 2 (7.4%) | 0 (0.0%) |
Time of Departure to Work by Sex in Parksville
The most frequent times of departure to work in Parksville are 7:00 AM to 7:29 AM (9, 33.3%) for males and 6:30 AM to 6:59 AM (7, 70.0%) for females.
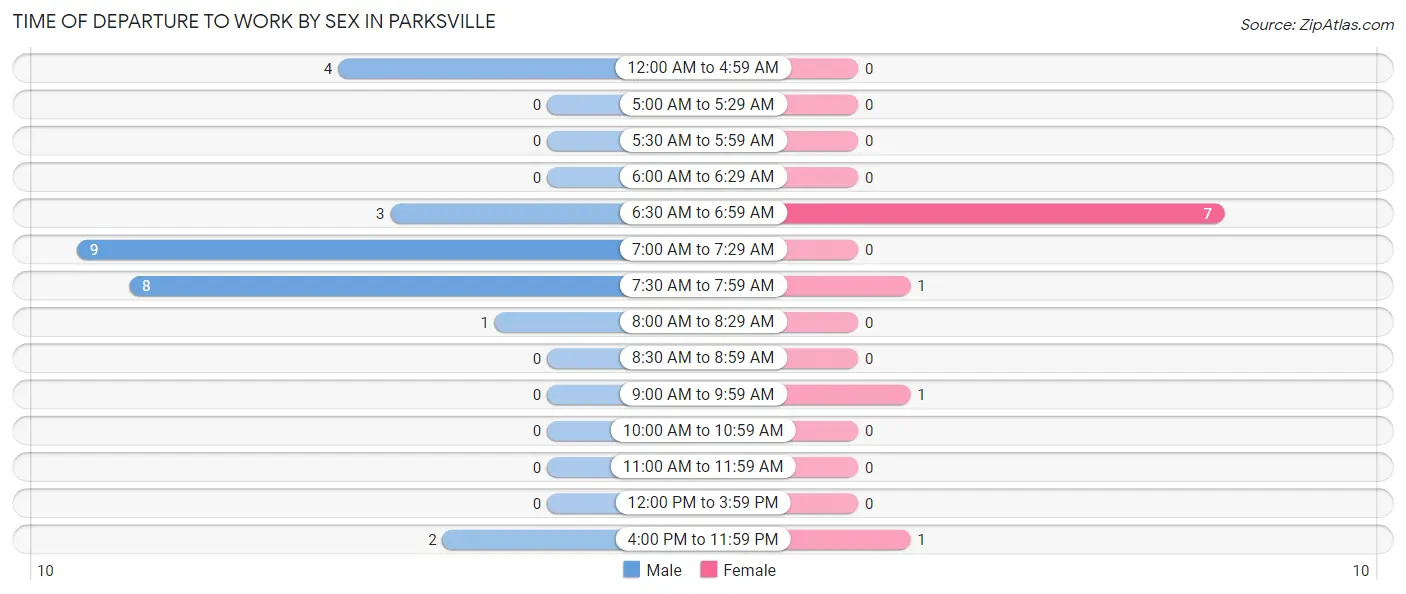
| Time of Departure | Male | Female |
| 12:00 AM to 4:59 AM | 4 (14.8%) | 0 (0.0%) |
| 5:00 AM to 5:29 AM | 0 (0.0%) | 0 (0.0%) |
| 5:30 AM to 5:59 AM | 0 (0.0%) | 0 (0.0%) |
| 6:00 AM to 6:29 AM | 0 (0.0%) | 0 (0.0%) |
| 6:30 AM to 6:59 AM | 3 (11.1%) | 7 (70.0%) |
| 7:00 AM to 7:29 AM | 9 (33.3%) | 0 (0.0%) |
| 7:30 AM to 7:59 AM | 8 (29.6%) | 1 (10.0%) |
| 8:00 AM to 8:29 AM | 1 (3.7%) | 0 (0.0%) |
| 8:30 AM to 8:59 AM | 0 (0.0%) | 0 (0.0%) |
| 9:00 AM to 9:59 AM | 0 (0.0%) | 1 (10.0%) |
| 10:00 AM to 10:59 AM | 0 (0.0%) | 0 (0.0%) |
| 11:00 AM to 11:59 AM | 0 (0.0%) | 0 (0.0%) |
| 12:00 PM to 3:59 PM | 0 (0.0%) | 0 (0.0%) |
| 4:00 PM to 11:59 PM | 2 (7.4%) | 1 (10.0%) |
| Total | 27 (100.0%) | 10 (100.0%) |
Housing Occupancy in Parksville
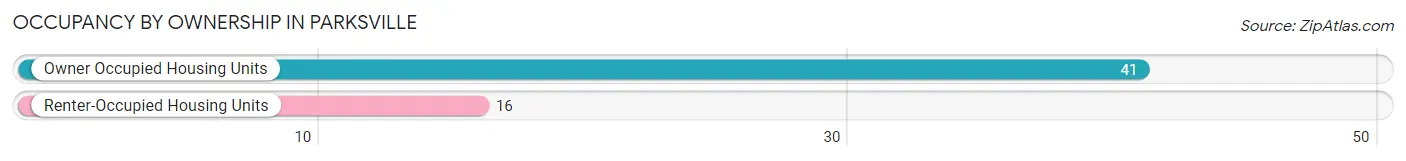
Occupancy by Ownership in Parksville
Of the total 57 dwellings in Parksville, owner-occupied units account for 41 (71.9%), while renter-occupied units make up 16 (28.1%).
| Occupancy | # Housing Units | % Housing Units |
| Owner Occupied Housing Units | 41 | 71.9% |
| Renter-Occupied Housing Units | 16 | 28.1% |
| Total Occupied Housing Units | 57 | 100.0% |
Occupancy by Household Size in Parksville
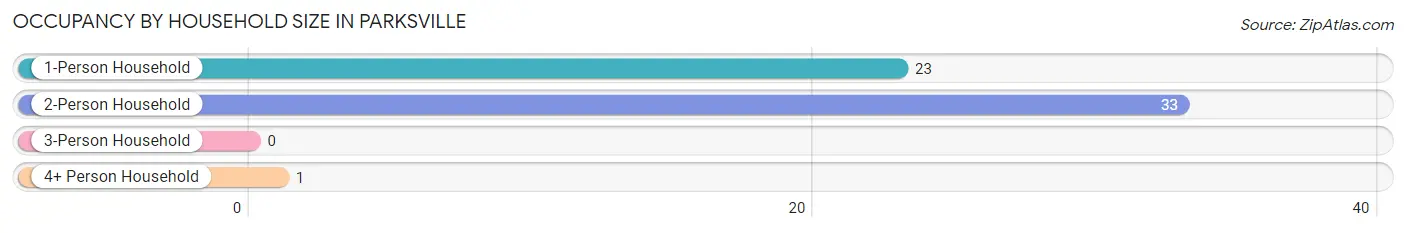
| Household Size | # Housing Units | % Housing Units |
| 1-Person Household | 23 | 40.4% |
| 2-Person Household | 33 | 57.9% |
| 3-Person Household | 0 | 0.0% |
| 4+ Person Household | 1 | 1.8% |
| Total Housing Units | 57 | 100.0% |
Occupancy by Ownership by Household Size in Parksville
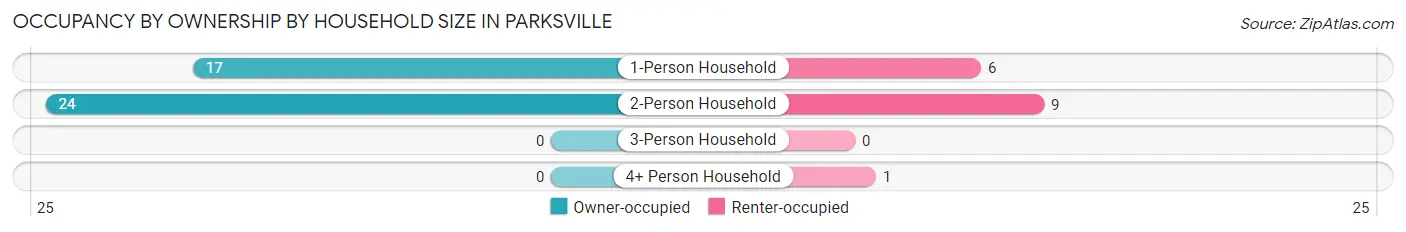
| Household Size | Owner-occupied | Renter-occupied |
| 1-Person Household | 17 (73.9%) | 6 (26.1%) |
| 2-Person Household | 24 (72.7%) | 9 (27.3%) |
| 3-Person Household | 0 (0.0%) | 0 (0.0%) |
| 4+ Person Household | 0 (0.0%) | 1 (100.0%) |
| Total Housing Units | 41 (71.9%) | 16 (28.1%) |
Occupancy by Educational Attainment in Parksville
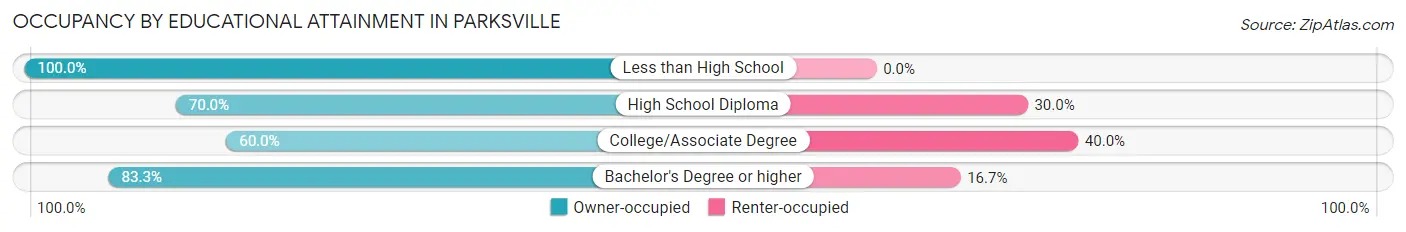
| Household Size | Owner-occupied | Renter-occupied |
| Less than High School | 6 (100.0%) | 0 (0.0%) |
| High School Diploma | 21 (70.0%) | 9 (30.0%) |
| College/Associate Degree | 9 (60.0%) | 6 (40.0%) |
| Bachelor's Degree or higher | 5 (83.3%) | 1 (16.7%) |
Occupancy by Age of Householder in Parksville
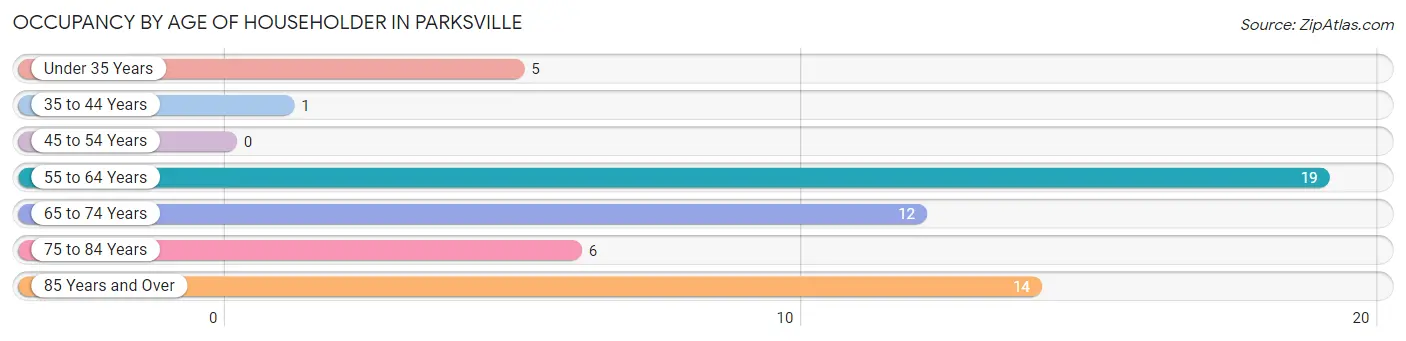
| Age Bracket | # Households | % Households |
| Under 35 Years | 5 | 8.8% |
| 35 to 44 Years | 1 | 1.8% |
| 45 to 54 Years | 0 | 0.0% |
| 55 to 64 Years | 19 | 33.3% |
| 65 to 74 Years | 12 | 21.0% |
| 75 to 84 Years | 6 | 10.5% |
| 85 Years and Over | 14 | 24.6% |
| Total | 57 | 100.0% |
Housing Finances in Parksville
Median Income by Occupancy in Parksville
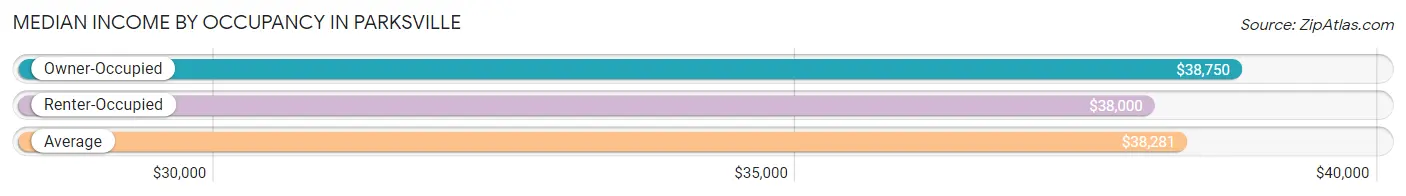
| Occupancy Type | # Households | Median Income |
| Owner-Occupied | 41 (71.9%) | $38,750 |
| Renter-Occupied | 16 (28.1%) | $38,000 |
| Average | 57 (100.0%) | $38,281 |
Occupancy by Householder Income Bracket in Parksville
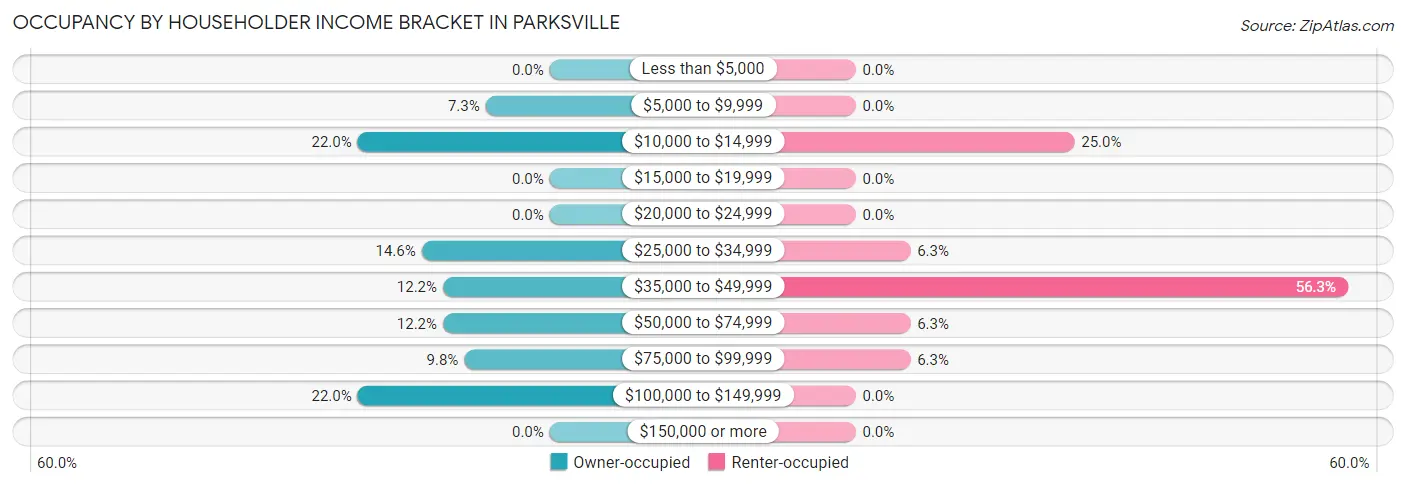
| Income Bracket | Owner-occupied | Renter-occupied |
| Less than $5,000 | 0 (0.0%) | 0 (0.0%) |
| $5,000 to $9,999 | 3 (7.3%) | 0 (0.0%) |
| $10,000 to $14,999 | 9 (22.0%) | 4 (25.0%) |
| $15,000 to $19,999 | 0 (0.0%) | 0 (0.0%) |
| $20,000 to $24,999 | 0 (0.0%) | 0 (0.0%) |
| $25,000 to $34,999 | 6 (14.6%) | 1 (6.2%) |
| $35,000 to $49,999 | 5 (12.2%) | 9 (56.2%) |
| $50,000 to $74,999 | 5 (12.2%) | 1 (6.2%) |
| $75,000 to $99,999 | 4 (9.8%) | 1 (6.2%) |
| $100,000 to $149,999 | 9 (22.0%) | 0 (0.0%) |
| $150,000 or more | 0 (0.0%) | 0 (0.0%) |
| Total | 41 (100.0%) | 16 (100.0%) |
Monthly Housing Cost Tiers in Parksville
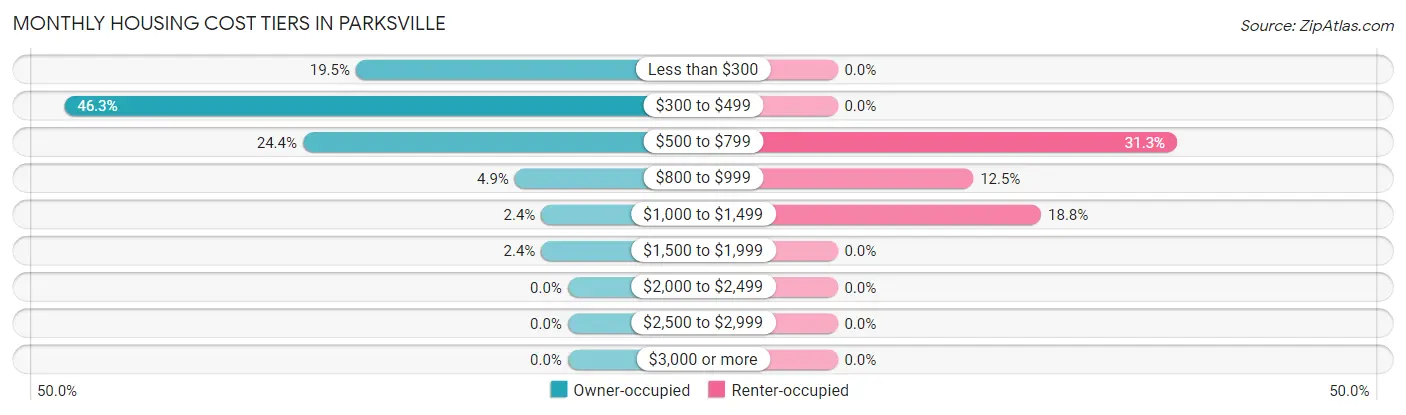
| Monthly Cost | Owner-occupied | Renter-occupied |
| Less than $300 | 8 (19.5%) | 0 (0.0%) |
| $300 to $499 | 19 (46.3%) | 0 (0.0%) |
| $500 to $799 | 10 (24.4%) | 5 (31.2%) |
| $800 to $999 | 2 (4.9%) | 2 (12.5%) |
| $1,000 to $1,499 | 1 (2.4%) | 3 (18.8%) |
| $1,500 to $1,999 | 1 (2.4%) | 0 (0.0%) |
| $2,000 to $2,499 | 0 (0.0%) | 0 (0.0%) |
| $2,500 to $2,999 | 0 (0.0%) | 0 (0.0%) |
| $3,000 or more | 0 (0.0%) | 0 (0.0%) |
| Total | 41 (100.0%) | 16 (100.0%) |
Physical Housing Characteristics in Parksville
Housing Structures in Parksville
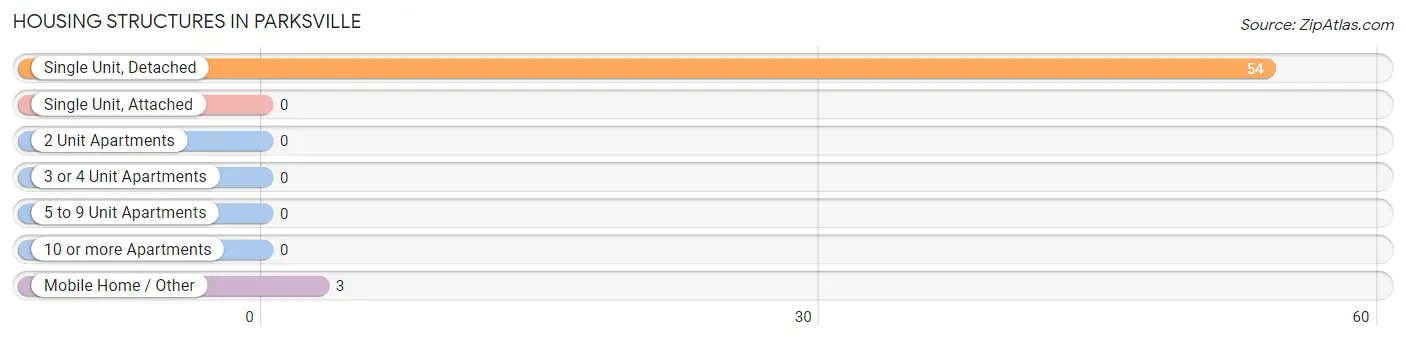
| Structure Type | # Housing Units | % Housing Units |
| Single Unit, Detached | 54 | 94.7% |
| Single Unit, Attached | 0 | 0.0% |
| 2 Unit Apartments | 0 | 0.0% |
| 3 or 4 Unit Apartments | 0 | 0.0% |
| 5 to 9 Unit Apartments | 0 | 0.0% |
| 10 or more Apartments | 0 | 0.0% |
| Mobile Home / Other | 3 | 5.3% |
| Total | 57 | 100.0% |
Housing Structures by Occupancy in Parksville
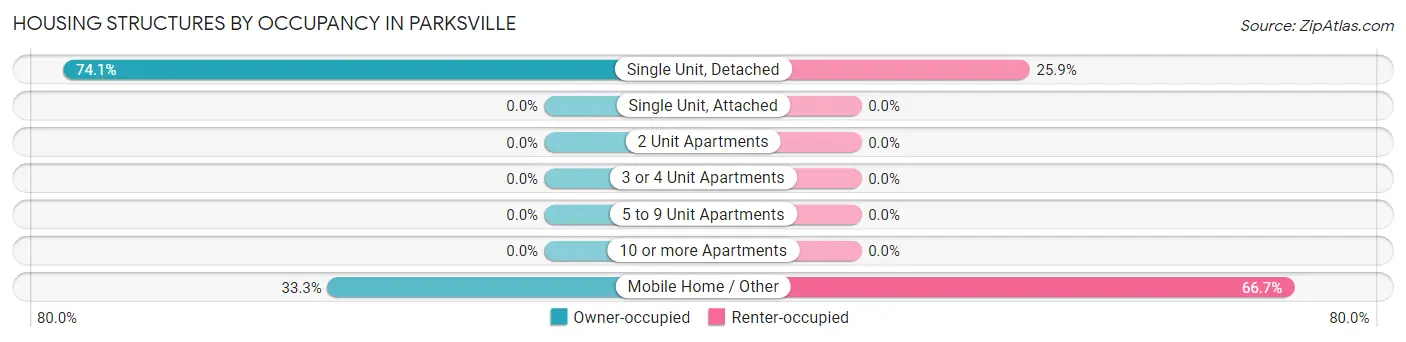
| Structure Type | Owner-occupied | Renter-occupied |
| Single Unit, Detached | 40 (74.1%) | 14 (25.9%) |
| Single Unit, Attached | 0 (0.0%) | 0 (0.0%) |
| 2 Unit Apartments | 0 (0.0%) | 0 (0.0%) |
| 3 or 4 Unit Apartments | 0 (0.0%) | 0 (0.0%) |
| 5 to 9 Unit Apartments | 0 (0.0%) | 0 (0.0%) |
| 10 or more Apartments | 0 (0.0%) | 0 (0.0%) |
| Mobile Home / Other | 1 (33.3%) | 2 (66.7%) |
| Total | 41 (71.9%) | 16 (28.1%) |
Housing Structures by Number of Rooms in Parksville
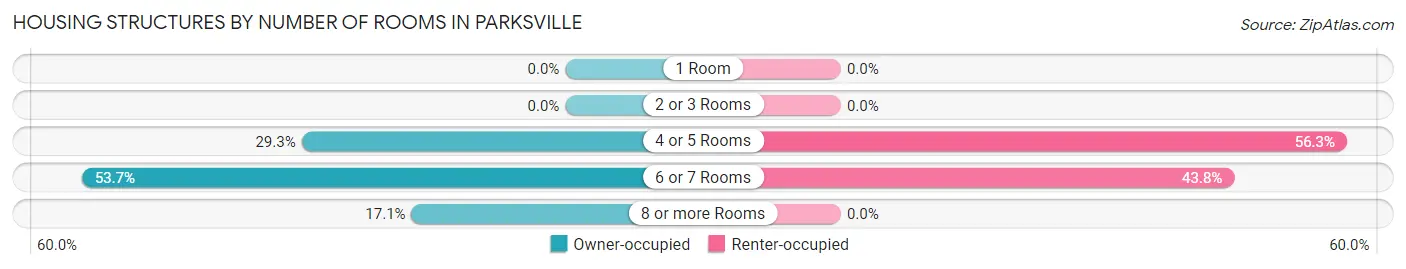
| Number of Rooms | Owner-occupied | Renter-occupied |
| 1 Room | 0 (0.0%) | 0 (0.0%) |
| 2 or 3 Rooms | 0 (0.0%) | 0 (0.0%) |
| 4 or 5 Rooms | 12 (29.3%) | 9 (56.2%) |
| 6 or 7 Rooms | 22 (53.7%) | 7 (43.8%) |
| 8 or more Rooms | 7 (17.1%) | 0 (0.0%) |
| Total | 41 (100.0%) | 16 (100.0%) |
Housing Structure by Heating Type in Parksville
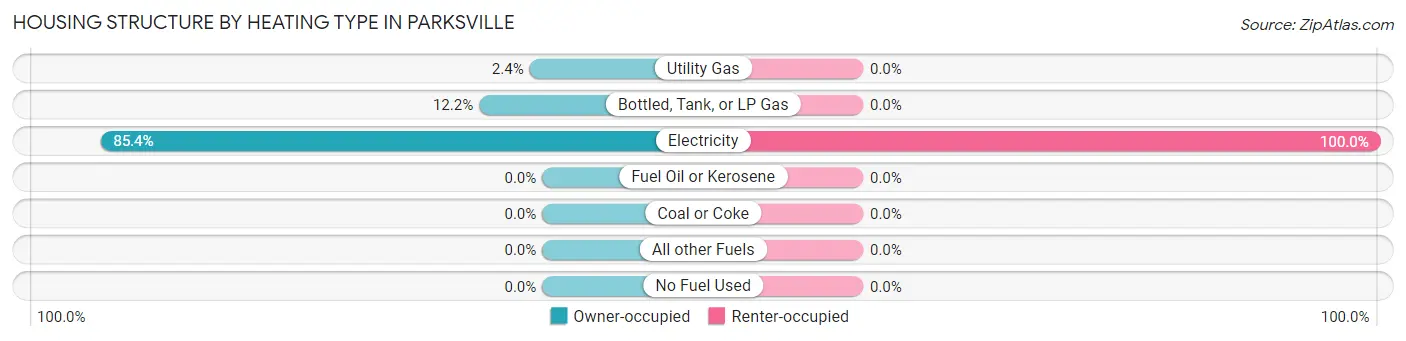
| Heating Type | Owner-occupied | Renter-occupied |
| Utility Gas | 1 (2.4%) | 0 (0.0%) |
| Bottled, Tank, or LP Gas | 5 (12.2%) | 0 (0.0%) |
| Electricity | 35 (85.4%) | 16 (100.0%) |
| Fuel Oil or Kerosene | 0 (0.0%) | 0 (0.0%) |
| Coal or Coke | 0 (0.0%) | 0 (0.0%) |
| All other Fuels | 0 (0.0%) | 0 (0.0%) |
| No Fuel Used | 0 (0.0%) | 0 (0.0%) |
| Total | 41 (100.0%) | 16 (100.0%) |
Household Vehicle Usage in Parksville
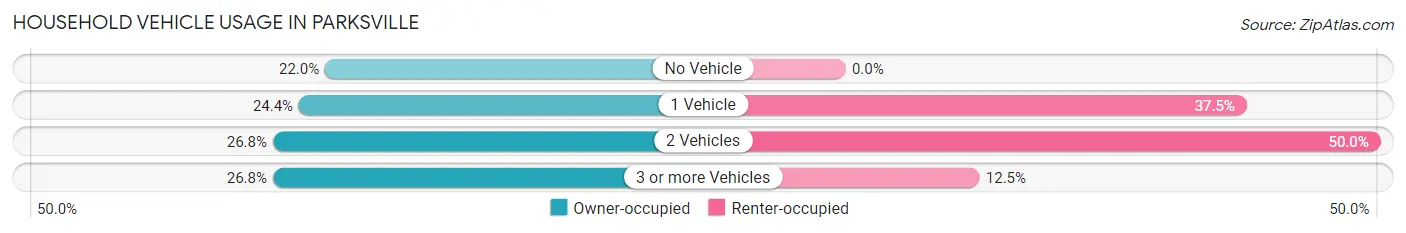
| Vehicles per Household | Owner-occupied | Renter-occupied |
| No Vehicle | 9 (22.0%) | 0 (0.0%) |
| 1 Vehicle | 10 (24.4%) | 6 (37.5%) |
| 2 Vehicles | 11 (26.8%) | 8 (50.0%) |
| 3 or more Vehicles | 11 (26.8%) | 2 (12.5%) |
| Total | 41 (100.0%) | 16 (100.0%) |
Real Estate & Mortgages in Parksville
Real Estate and Mortgage Overview in Parksville
| Characteristic | Without Mortgage | With Mortgage |
| Housing Units | 39 | 2 |
| Median Property Value | $121,300 | $0 |
| Median Household Income | $37,917 | $0 |
| Monthly Housing Costs | $392 | $0 |
| Real Estate Taxes | $500 | $0 |
Property Value by Mortgage Status in Parksville
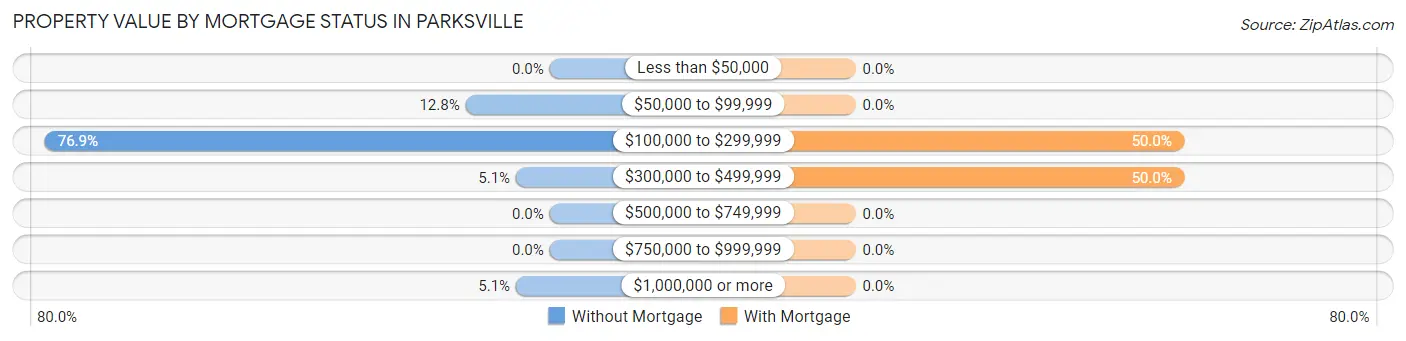
| Property Value | Without Mortgage | With Mortgage |
| Less than $50,000 | 0 (0.0%) | 0 (0.0%) |
| $50,000 to $99,999 | 5 (12.8%) | 0 (0.0%) |
| $100,000 to $299,999 | 30 (76.9%) | 1 (50.0%) |
| $300,000 to $499,999 | 2 (5.1%) | 1 (50.0%) |
| $500,000 to $749,999 | 0 (0.0%) | 0 (0.0%) |
| $750,000 to $999,999 | 0 (0.0%) | 0 (0.0%) |
| $1,000,000 or more | 2 (5.1%) | 0 (0.0%) |
| Total | 39 (100.0%) | 2 (100.0%) |
Household Income by Mortgage Status in Parksville
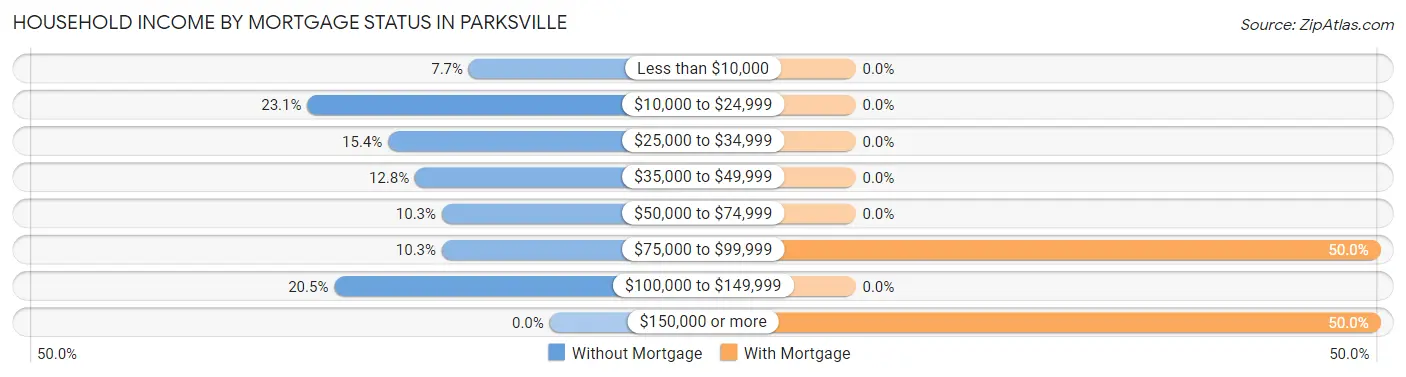
| Household Income | Without Mortgage | With Mortgage |
| Less than $10,000 | 3 (7.7%) | 0 (0.0%) |
| $10,000 to $24,999 | 9 (23.1%) | 0 (0.0%) |
| $25,000 to $34,999 | 6 (15.4%) | 0 (0.0%) |
| $35,000 to $49,999 | 5 (12.8%) | 0 (0.0%) |
| $50,000 to $74,999 | 4 (10.3%) | 0 (0.0%) |
| $75,000 to $99,999 | 4 (10.3%) | 1 (50.0%) |
| $100,000 to $149,999 | 8 (20.5%) | 0 (0.0%) |
| $150,000 or more | 0 (0.0%) | 1 (50.0%) |
| Total | 39 (100.0%) | 2 (100.0%) |
Property Value to Household Income Ratio in Parksville
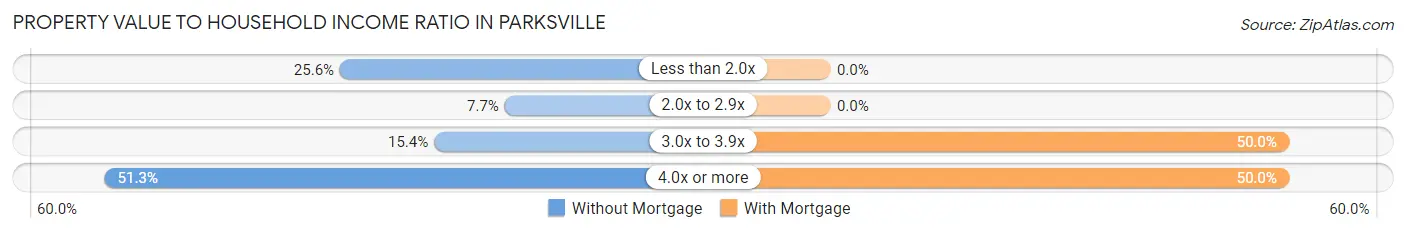
| Value-to-Income Ratio | Without Mortgage | With Mortgage |
| Less than 2.0x | 10 (25.6%) | 0 (0.0%) |
| 2.0x to 2.9x | 3 (7.7%) | 0 (0.0%) |
| 3.0x to 3.9x | 6 (15.4%) | 1 (50.0%) |
| 4.0x or more | 20 (51.3%) | 1 (50.0%) |
| Total | 39 (100.0%) | 2 (100.0%) |
Real Estate Taxes by Mortgage Status in Parksville
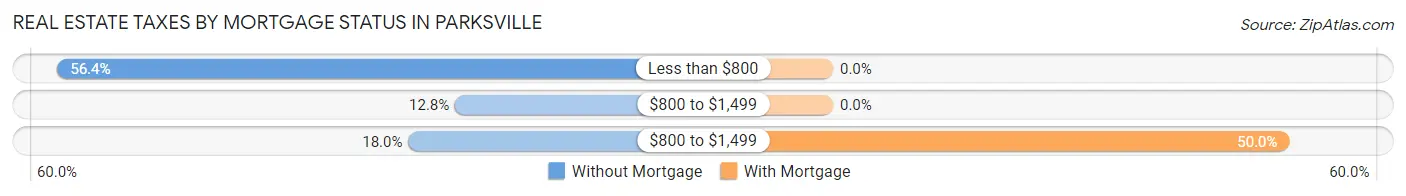
| Property Taxes | Without Mortgage | With Mortgage |
| Less than $800 | 22 (56.4%) | 0 (0.0%) |
| $800 to $1,499 | 5 (12.8%) | 0 (0.0%) |
| $800 to $1,499 | 7 (17.9%) | 1 (50.0%) |
| Total | 39 (100.0%) | 2 (100.0%) |
Health & Disability in Parksville
Health Insurance Coverage by Age in Parksville
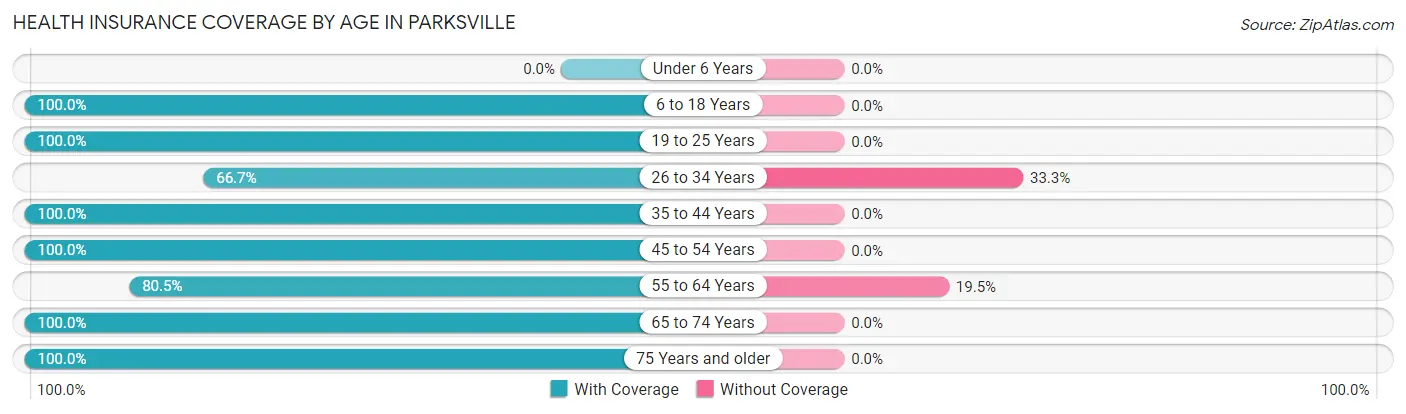
| Age Bracket | With Coverage | Without Coverage |
| Under 6 Years | 0 (0.0%) | 0 (0.0%) |
| 6 to 18 Years | 5 (100.0%) | 0 (0.0%) |
| 19 to 25 Years | 4 (100.0%) | 0 (0.0%) |
| 26 to 34 Years | 4 (66.7%) | 2 (33.3%) |
| 35 to 44 Years | 1 (100.0%) | 0 (0.0%) |
| 45 to 54 Years | 7 (100.0%) | 0 (0.0%) |
| 55 to 64 Years | 33 (80.5%) | 8 (19.5%) |
| 65 to 74 Years | 16 (100.0%) | 0 (0.0%) |
| 75 Years and older | 24 (100.0%) | 0 (0.0%) |
| Total | 94 (90.4%) | 10 (9.6%) |
Health Insurance Coverage by Citizenship Status in Parksville
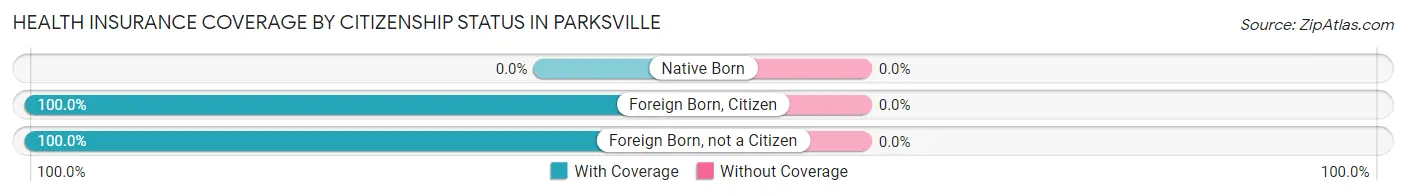
| Citizenship Status | With Coverage | Without Coverage |
| Native Born | 0 (0.0%) | 0 (0.0%) |
| Foreign Born, Citizen | 5 (100.0%) | 0 (0.0%) |
| Foreign Born, not a Citizen | 4 (100.0%) | 0 (0.0%) |
Health Insurance Coverage by Household Income in Parksville
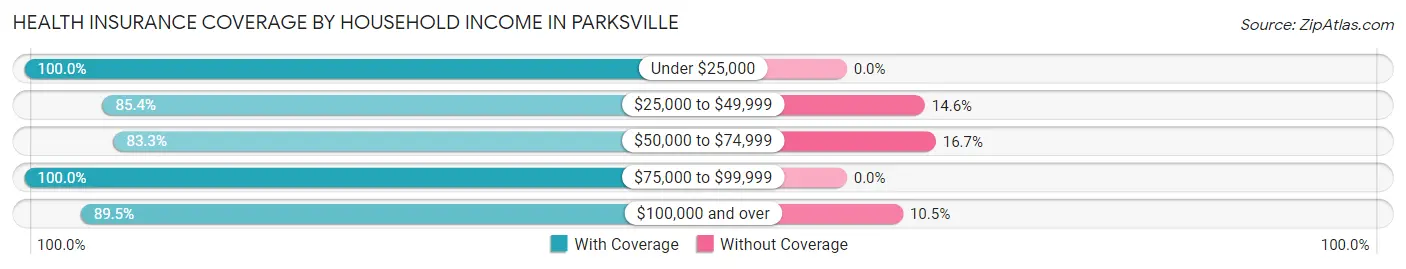
| Household Income | With Coverage | Without Coverage |
| Under $25,000 | 16 (100.0%) | 0 (0.0%) |
| $25,000 to $49,999 | 35 (85.4%) | 6 (14.6%) |
| $50,000 to $74,999 | 10 (83.3%) | 2 (16.7%) |
| $75,000 to $99,999 | 16 (100.0%) | 0 (0.0%) |
| $100,000 and over | 17 (89.5%) | 2 (10.5%) |
Public vs Private Health Insurance Coverage by Age in Parksville
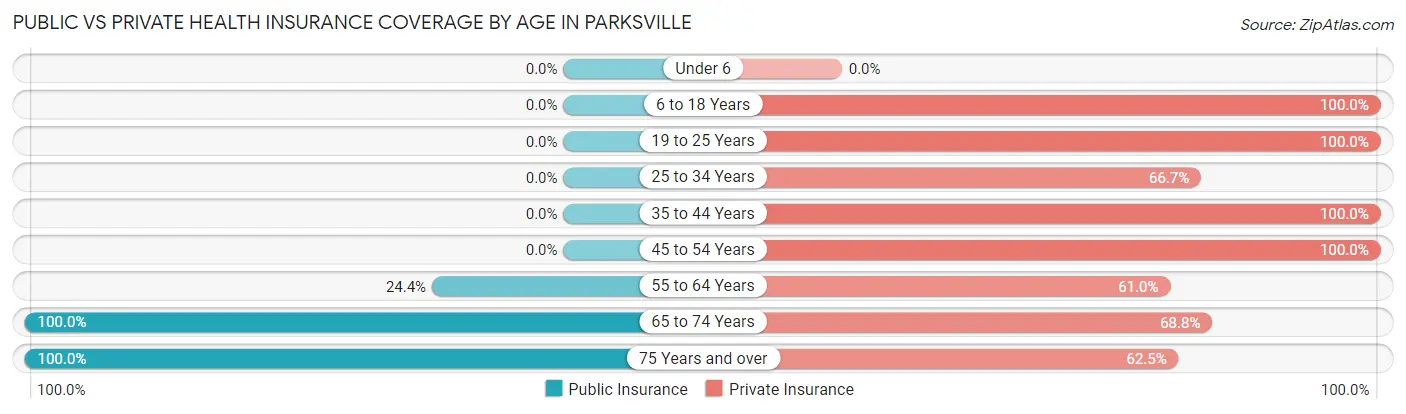
| Age Bracket | Public Insurance | Private Insurance |
| Under 6 | 0 (0.0%) | 0 (0.0%) |
| 6 to 18 Years | 0 (0.0%) | 5 (100.0%) |
| 19 to 25 Years | 0 (0.0%) | 4 (100.0%) |
| 25 to 34 Years | 0 (0.0%) | 4 (66.7%) |
| 35 to 44 Years | 0 (0.0%) | 1 (100.0%) |
| 45 to 54 Years | 0 (0.0%) | 7 (100.0%) |
| 55 to 64 Years | 10 (24.4%) | 25 (61.0%) |
| 65 to 74 Years | 16 (100.0%) | 11 (68.8%) |
| 75 Years and over | 24 (100.0%) | 15 (62.5%) |
| Total | 50 (48.1%) | 72 (69.2%) |
Disability Status by Sex by Age in Parksville
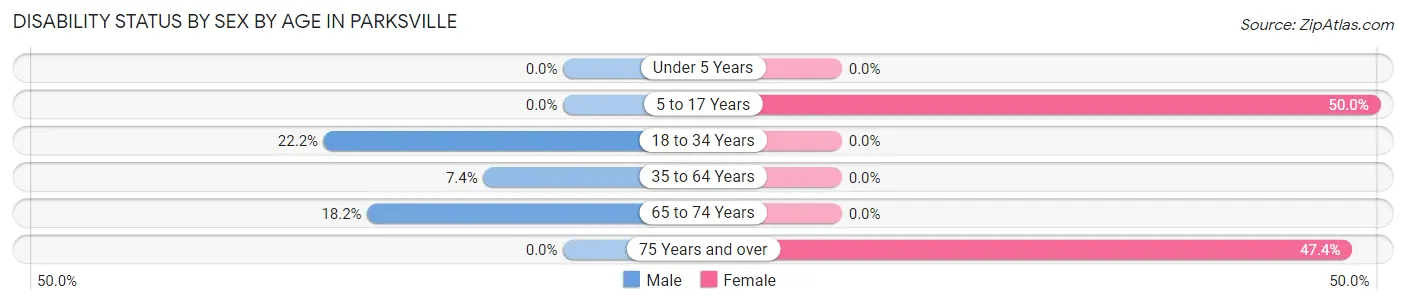
| Age Bracket | Male | Female |
| Under 5 Years | 0 (0.0%) | 0 (0.0%) |
| 5 to 17 Years | 0 (0.0%) | 2 (50.0%) |
| 18 to 34 Years | 2 (22.2%) | 0 (0.0%) |
| 35 to 64 Years | 2 (7.4%) | 0 (0.0%) |
| 65 to 74 Years | 2 (18.2%) | 0 (0.0%) |
| 75 Years and over | 0 (0.0%) | 9 (47.4%) |
Disability Class by Sex by Age in Parksville
Disability Class: Hearing Difficulty
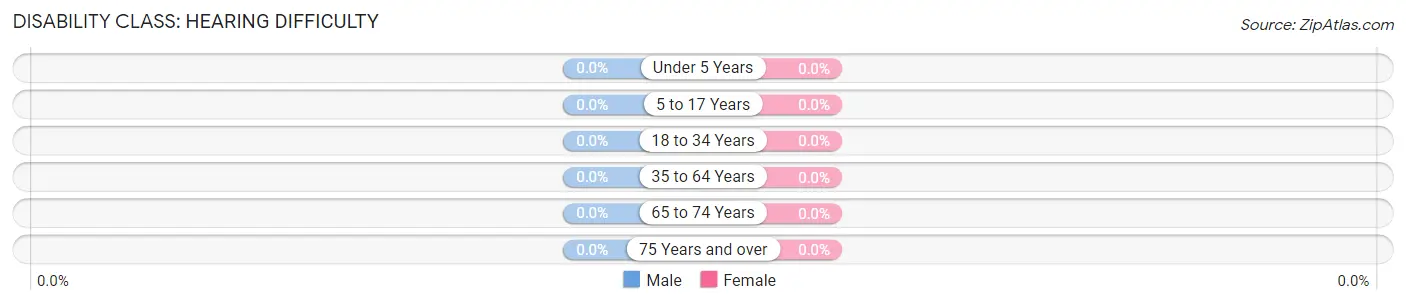
| Age Bracket | Male | Female |
| Under 5 Years | 0 (0.0%) | 0 (0.0%) |
| 5 to 17 Years | 0 (0.0%) | 0 (0.0%) |
| 18 to 34 Years | 0 (0.0%) | 0 (0.0%) |
| 35 to 64 Years | 0 (0.0%) | 0 (0.0%) |
| 65 to 74 Years | 0 (0.0%) | 0 (0.0%) |
| 75 Years and over | 0 (0.0%) | 0 (0.0%) |
Disability Class: Vision Difficulty
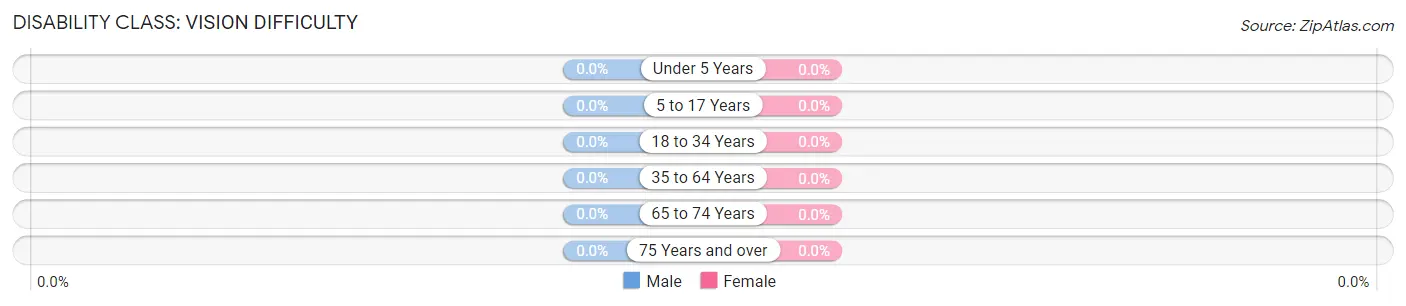
| Age Bracket | Male | Female |
| Under 5 Years | 0 (0.0%) | 0 (0.0%) |
| 5 to 17 Years | 0 (0.0%) | 0 (0.0%) |
| 18 to 34 Years | 0 (0.0%) | 0 (0.0%) |
| 35 to 64 Years | 0 (0.0%) | 0 (0.0%) |
| 65 to 74 Years | 0 (0.0%) | 0 (0.0%) |
| 75 Years and over | 0 (0.0%) | 0 (0.0%) |
Disability Class: Cognitive Difficulty
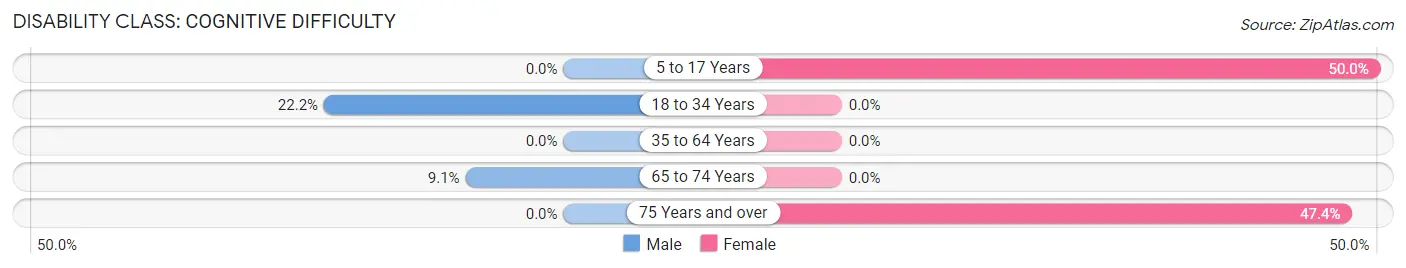
| Age Bracket | Male | Female |
| 5 to 17 Years | 0 (0.0%) | 2 (50.0%) |
| 18 to 34 Years | 2 (22.2%) | 0 (0.0%) |
| 35 to 64 Years | 0 (0.0%) | 0 (0.0%) |
| 65 to 74 Years | 1 (9.1%) | 0 (0.0%) |
| 75 Years and over | 0 (0.0%) | 9 (47.4%) |
Disability Class: Ambulatory Difficulty
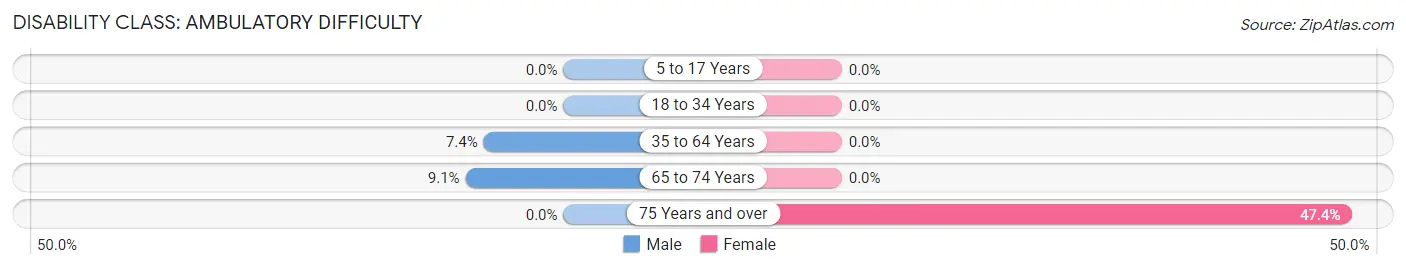
| Age Bracket | Male | Female |
| 5 to 17 Years | 0 (0.0%) | 0 (0.0%) |
| 18 to 34 Years | 0 (0.0%) | 0 (0.0%) |
| 35 to 64 Years | 2 (7.4%) | 0 (0.0%) |
| 65 to 74 Years | 1 (9.1%) | 0 (0.0%) |
| 75 Years and over | 0 (0.0%) | 9 (47.4%) |
Disability Class: Self-Care Difficulty
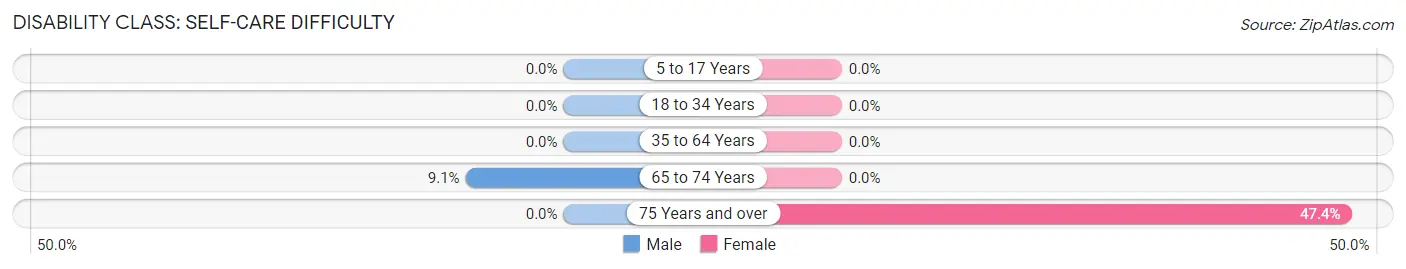
| Age Bracket | Male | Female |
| 5 to 17 Years | 0 (0.0%) | 0 (0.0%) |
| 18 to 34 Years | 0 (0.0%) | 0 (0.0%) |
| 35 to 64 Years | 0 (0.0%) | 0 (0.0%) |
| 65 to 74 Years | 1 (9.1%) | 0 (0.0%) |
| 75 Years and over | 0 (0.0%) | 9 (47.4%) |
Technology Access in Parksville
Computing Device Access in Parksville
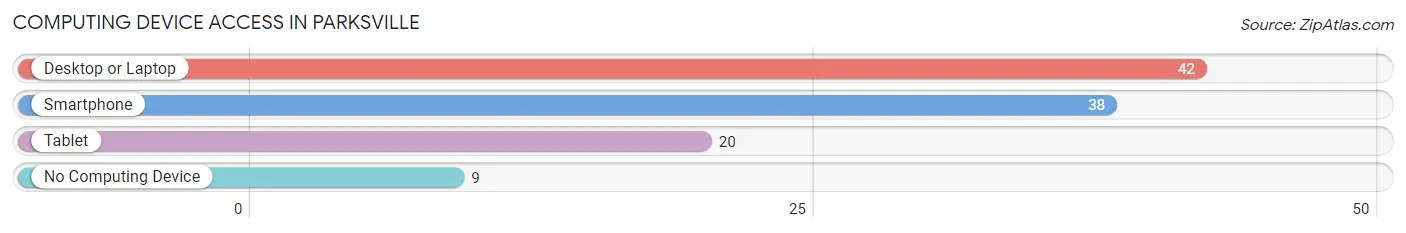
| Device Type | # Households | % Households |
| Desktop or Laptop | 42 | 73.7% |
| Smartphone | 38 | 66.7% |
| Tablet | 20 | 35.1% |
| No Computing Device | 9 | 15.8% |
| Total | 57 | 100.0% |
Internet Access in Parksville
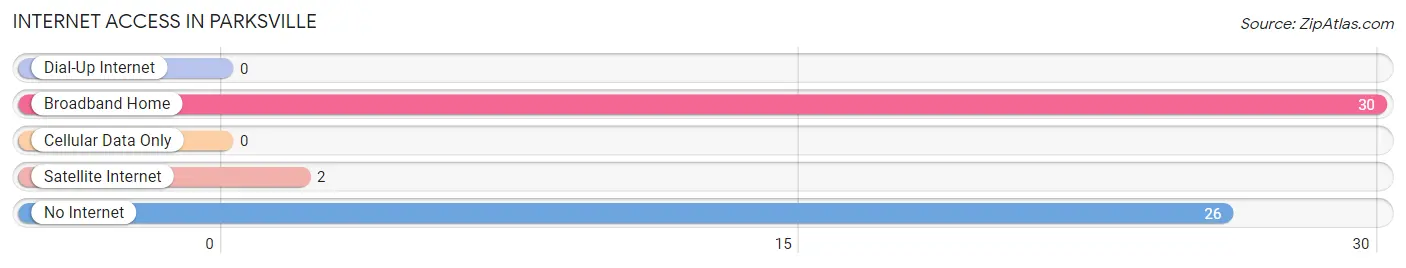
| Internet Type | # Households | % Households |
| Dial-Up Internet | 0 | 0.0% |
| Broadband Home | 30 | 52.6% |
| Cellular Data Only | 0 | 0.0% |
| Satellite Internet | 2 | 3.5% |
| No Internet | 26 | 45.6% |
| Total | 57 | 100.0% |
Parksville Summary
Parksville is a small town located in the Upstate region of South Carolina. It is situated in the foothills of the Blue Ridge Mountains, approximately 30 miles northwest of Greenville. The town is home to a population of approximately 1,500 people, and is part of the Greenville-Spartanburg-Anderson Combined Statistical Area.
History
Parksville was founded in 1820 by a group of settlers from North Carolina. The town was named after the first settler, William Parks, who had purchased the land from the Cherokee Indians. The town was originally a farming community, and the main crops grown were cotton, corn, and tobacco.
In the late 19th century, the town began to grow and develop. The railroad was extended to Parksville in 1887, and the town became a popular stop for travelers. The town also became a center for manufacturing, with several factories being built in the area.
In the early 20th century, Parksville experienced a period of growth and prosperity. The town was home to several businesses, including a cotton mill, a furniture factory, and a brickyard. The town also had a thriving downtown area, with several stores and restaurants.
Geography
Parksville is located in the foothills of the Blue Ridge Mountains, approximately 30 miles northwest of Greenville. The town is situated in a valley, with the mountains to the east and the Piedmont Plateau to the west. The town is located at an elevation of 1,000 feet above sea level.
The town is located in the Piedmont region of South Carolina, and is part of the Greenville-Spartanburg-Anderson Combined Statistical Area. The town is located in Pickens County, and is bordered by the towns of Liberty, Easley, and Pickens.
Economy
The economy of Parksville is largely based on agriculture and manufacturing. The town is home to several farms, which produce a variety of crops, including cotton, corn, and tobacco. The town is also home to several factories, which produce a variety of products, including furniture, textiles, and brick.
The town is also home to several small businesses, including restaurants, stores, and service providers. The town is also home to several tourist attractions, including the Pickens County Museum and the Pickens County Historical Society.
Demographics
As of the 2010 census, the population of Parksville was 1,500. The town is predominantly white, with a population that is 94.7% white, 2.7% African American, 0.7% Asian, and 0.7% Hispanic or Latino. The median household income in the town is $37,500, and the median home value is $125,000. The town has a poverty rate of 16.7%.
Conclusion
Parksville is a small town located in the Upstate region of South Carolina. It is situated in the foothills of the Blue Ridge Mountains, approximately 30 miles northwest of Greenville. The town is home to a population of approximately 1,500 people, and is part of the Greenville-Spartanburg-Anderson Combined Statistical Area. The economy of Parksville is largely based on agriculture and manufacturing, and the town is home to several small businesses. The town is predominantly white, with a population that is 94.7% white, 2.7% African American, 0.7% Asian, and 0.7% Hispanic or Latino. The median household income in the town is $37,500, and the median home value is $125,000. The town has a poverty rate of 16.7%.
Common Questions
What is Per Capita Income in Parksville?
Per Capita income in Parksville is $29,981.
What is the Median Family Income in Parksville?
Median Family Income in Parksville is $51,250.
What is the Median Household income in Parksville?
Median Household Income in Parksville is $38,281.
What is Inequality or Gini Index in Parksville?
Inequality or Gini Index in Parksville is 0.42.
What is the Total Population of Parksville?
Total Population of Parksville is 104.
What is the Total Male Population of Parksville?
Total Male Population of Parksville is 53.
What is the Total Female Population of Parksville?
Total Female Population of Parksville is 51.
What is the Ratio of Males per 100 Females in Parksville?
There are 103.92 Males per 100 Females in Parksville.
What is the Ratio of Females per 100 Males in Parksville?
There are 96.23 Females per 100 Males in Parksville.
What is the Median Population Age in Parksville?
Median Population Age in Parksville is 60.3 Years.
What is the Average Family Size in Parksville
Average Family Size in Parksville is 2.3 People.
What is the Average Household Size in Parksville
Average Household Size in Parksville is 1.8 People.
How Large is the Labor Force in Parksville?
There are 41 People in the Labor Forcein in Parksville.
What is the Percentage of People in the Labor Force in Parksville?
41.4% of People are in the Labor Force in Parksville.
What is the Unemployment Rate in Parksville?
Unemployment Rate in Parksville is 4.9%.