Isle Of Palms, SC Map & Demographics
Isle Of Palms Map
Isle Of Palms Overview
$119,429
PER CAPITA INCOME
$215,882
AVG FAMILY INCOME
$160,417
AVG HOUSEHOLD INCOME
56.5%
WAGE / INCOME GAP [ % ]
43.5¢/ $1
WAGE / INCOME GAP [ $ ]
$12,944
FAMILY INCOME DEFICIT
0.50
INEQUALITY / GINI INDEX
4,347
TOTAL POPULATION
2,262
MALE POPULATION
2,085
FEMALE POPULATION
108.49
MALES / 100 FEMALES
92.18
FEMALES / 100 MALES
51.7
MEDIAN AGE
2.7
AVG FAMILY SIZE
2.2
AVG HOUSEHOLD SIZE
1,917
LABOR FORCE [ PEOPLE ]
52.1%
PERCENT IN LABOR FORCE
0.7%
UNEMPLOYMENT RATE
Isle Of Palms Zip Codes
Isle Of Palms Area Codes
Income in Isle Of Palms
Income Overview in Isle Of Palms
Per Capita Income in Isle Of Palms is $119,429, while median incomes of families and households are $215,882 and $160,417 respectively.
| Characteristic | Number | Measure |
| Per Capita Income | 4,347 | $119,429 |
| Median Family Income | 1,358 | $215,882 |
| Mean Family Income | 1,358 | $267,942 |
| Median Household Income | 1,948 | $160,417 |
| Mean Household Income | 1,948 | $268,363 |
| Income Deficit | 1,358 | $12,944 |
| Wage / Income Gap (%) | 4,347 | 56.46% |
| Wage / Income Gap ($) | 4,347 | 43.54¢ per $1 |
| Gini / Inequality Index | 4,347 | 0.50 |
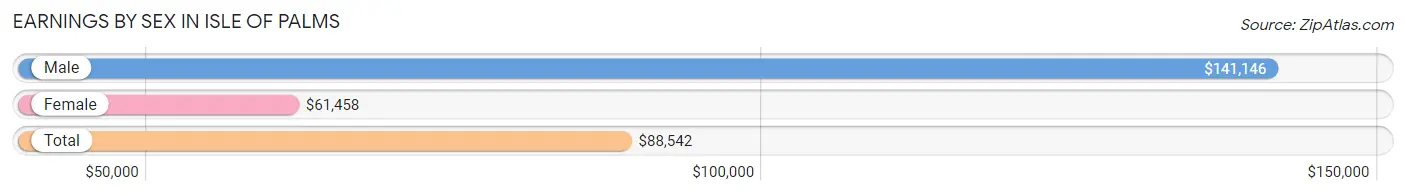
Earnings by Sex in Isle Of Palms
Average Earnings in Isle Of Palms are $88,542, $141,146 for men and $61,458 for women, a difference of 56.5%.
| Sex | Number | Average Earnings |
| Male | 1,308 (64.4%) | $141,146 |
| Female | 722 (35.6%) | $61,458 |
| Total | 2,030 (100.0%) | $88,542 |
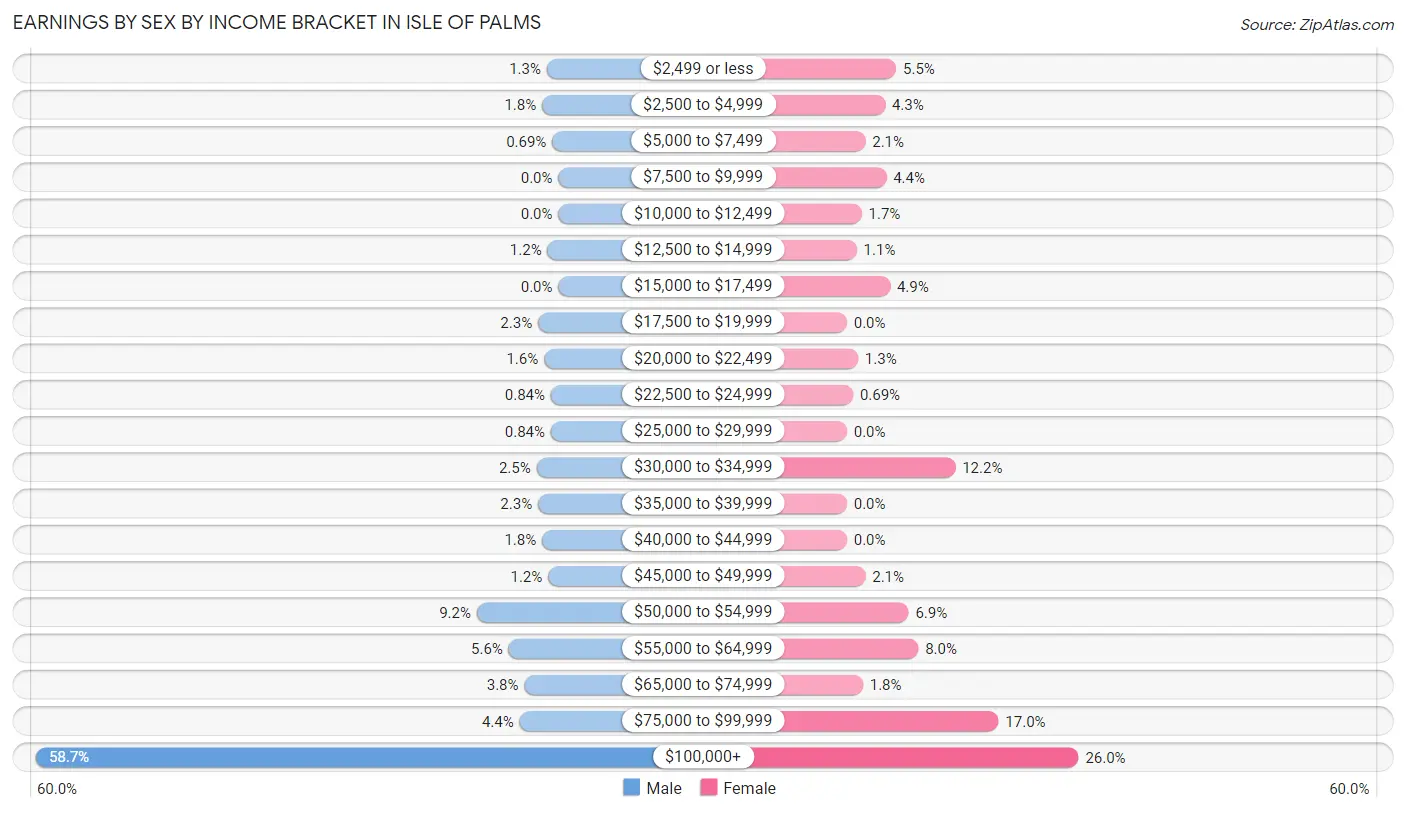
Earnings by Sex by Income Bracket in Isle Of Palms
The most common earnings brackets in Isle Of Palms are $100,000+ for men (768 | 58.7%) and $100,000+ for women (188 | 26.0%).
| Income | Male | Female |
| $2,499 or less | 17 (1.3%) | 40 (5.5%) |
| $2,500 to $4,999 | 24 (1.8%) | 31 (4.3%) |
| $5,000 to $7,499 | 9 (0.7%) | 15 (2.1%) |
| $7,500 to $9,999 | 0 (0.0%) | 32 (4.4%) |
| $10,000 to $12,499 | 0 (0.0%) | 12 (1.7%) |
| $12,500 to $14,999 | 16 (1.2%) | 8 (1.1%) |
| $15,000 to $17,499 | 0 (0.0%) | 35 (4.9%) |
| $17,500 to $19,999 | 30 (2.3%) | 0 (0.0%) |
| $20,000 to $22,499 | 21 (1.6%) | 9 (1.3%) |
| $22,500 to $24,999 | 11 (0.8%) | 5 (0.7%) |
| $25,000 to $29,999 | 11 (0.8%) | 0 (0.0%) |
| $30,000 to $34,999 | 32 (2.5%) | 88 (12.2%) |
| $35,000 to $39,999 | 30 (2.3%) | 0 (0.0%) |
| $40,000 to $44,999 | 24 (1.8%) | 0 (0.0%) |
| $45,000 to $49,999 | 15 (1.1%) | 15 (2.1%) |
| $50,000 to $54,999 | 120 (9.2%) | 50 (6.9%) |
| $55,000 to $64,999 | 73 (5.6%) | 58 (8.0%) |
| $65,000 to $74,999 | 50 (3.8%) | 13 (1.8%) |
| $75,000 to $99,999 | 57 (4.4%) | 123 (17.0%) |
| $100,000+ | 768 (58.7%) | 188 (26.0%) |
| Total | 1,308 (100.0%) | 722 (100.0%) |
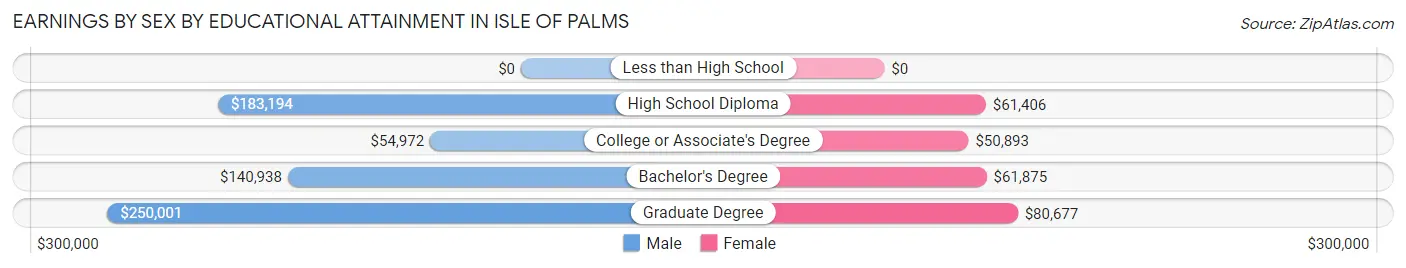
Earnings by Sex by Educational Attainment in Isle Of Palms
Average earnings in Isle Of Palms are $143,636 for men and $63,333 for women, a difference of 55.9%. Men with an educational attainment of graduate degree enjoy the highest average annual earnings of $250,001, while those with college or associate's degree education earn the least with $54,972. Women with an educational attainment of graduate degree earn the most with the average annual earnings of $80,677, while those with college or associate's degree education have the smallest earnings of $50,893.
| Educational Attainment | Male Income | Female Income |
| Less than High School | - | - |
| High School Diploma | $183,194 | $61,406 |
| College or Associate's Degree | $54,972 | $50,893 |
| Bachelor's Degree | $140,938 | $61,875 |
| Graduate Degree | $250,001 | $80,677 |
| Total | $143,636 | $63,333 |
Family Income in Isle Of Palms
Family Income Brackets in Isle Of Palms
According to the Isle Of Palms family income data, there are 699 families falling into the $200,000+ income range, which is the most common income bracket and makes up 51.5% of all families.
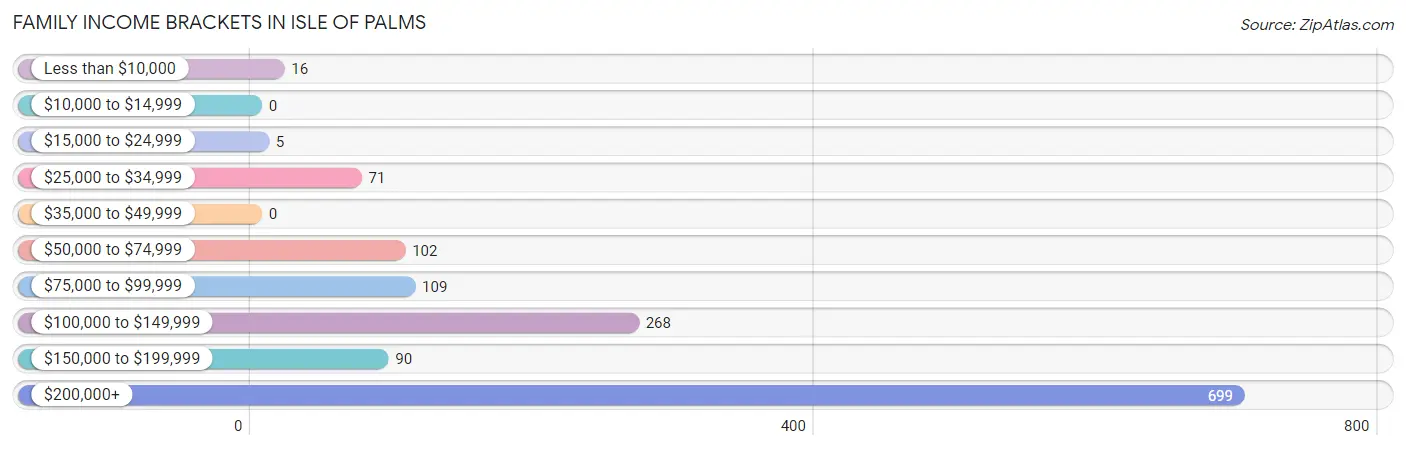
| Income Bracket | # Families | % Families |
| Less than $10,000 | 16 | 1.2% |
| $10,000 to $14,999 | 0 | 0.0% |
| $15,000 to $24,999 | 5 | 0.4% |
| $25,000 to $34,999 | 71 | 5.2% |
| $35,000 to $49,999 | 0 | 0.0% |
| $50,000 to $74,999 | 102 | 7.5% |
| $75,000 to $99,999 | 109 | 8.0% |
| $100,000 to $149,999 | 268 | 19.7% |
| $150,000 to $199,999 | 90 | 6.6% |
| $200,000+ | 699 | 51.5% |
Family Income by Famaliy Size in Isle Of Palms
4-person families (147 | 10.8%) account for the highest median family income in Isle Of Palms with $250,001 per family, while 3-person families (259 | 19.1%) have the highest median income of $77,318 per family member.
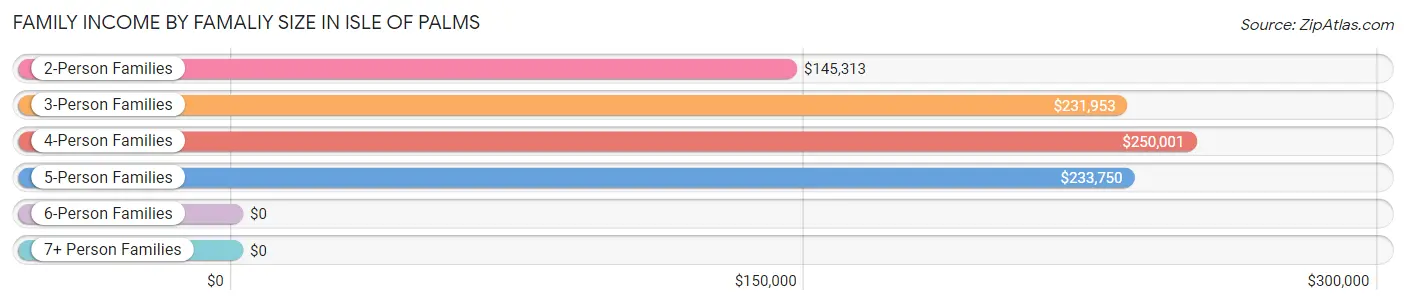
| Income Bracket | # Families | Median Income |
| 2-Person Families | 827 (60.9%) | $145,313 |
| 3-Person Families | 259 (19.1%) | $231,953 |
| 4-Person Families | 147 (10.8%) | $250,001 |
| 5-Person Families | 125 (9.2%) | $233,750 |
| 6-Person Families | 0 (0.0%) | $0 |
| 7+ Person Families | 0 (0.0%) | $0 |
| Total | 1,358 (100.0%) | $215,882 |
Family Income by Number of Earners in Isle Of Palms
The median family income in Isle Of Palms is $215,882, with families comprising 3+ earners (62) having the highest median family income of $250,001, while families with no earners (322) have the lowest median family income of $126,250, accounting for 4.6% and 23.7% of families, respectively.
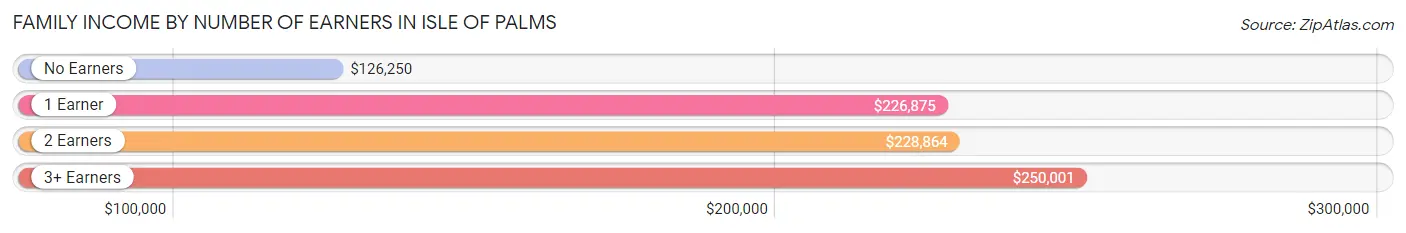
| Number of Earners | # Families | Median Income |
| No Earners | 322 (23.7%) | $126,250 |
| 1 Earner | 534 (39.3%) | $226,875 |
| 2 Earners | 440 (32.4%) | $228,864 |
| 3+ Earners | 62 (4.6%) | $250,001 |
| Total | 1,358 (100.0%) | $215,882 |
Household Income in Isle Of Palms
Household Income Brackets in Isle Of Palms
With 873 households falling in the category, the $200,000+ income range is the most frequent in Isle Of Palms, accounting for 44.8% of all households. In contrast, only 6 households (0.3%) fall into the $10,000 to $14,999 income bracket, making it the least populous group.
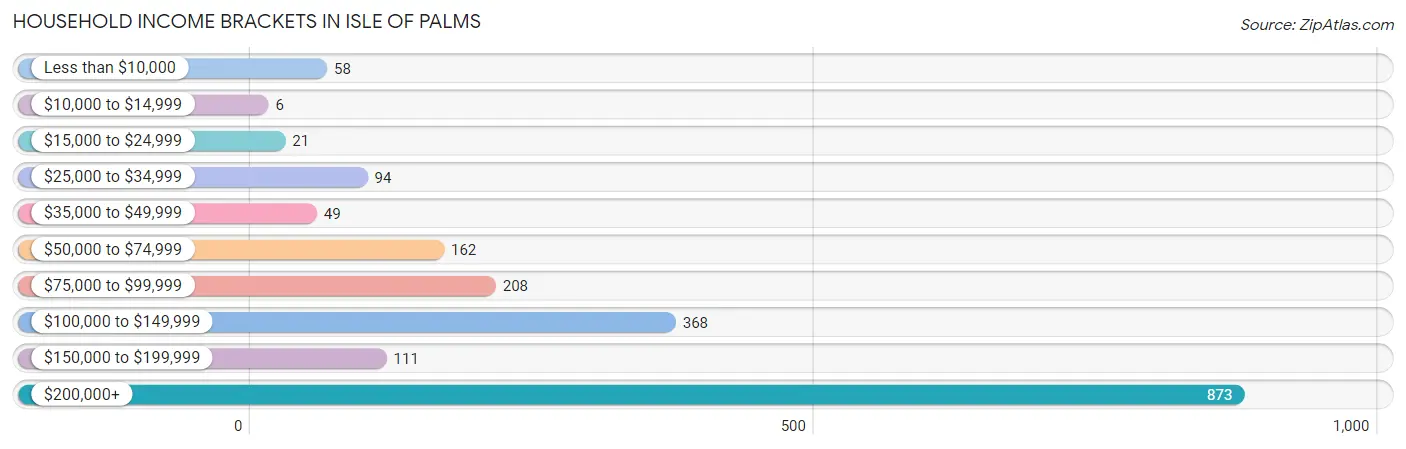
| Income Bracket | # Households | % Households |
| Less than $10,000 | 58 | 3.0% |
| $10,000 to $14,999 | 6 | 0.3% |
| $15,000 to $24,999 | 21 | 1.1% |
| $25,000 to $34,999 | 94 | 4.8% |
| $35,000 to $49,999 | 49 | 2.5% |
| $50,000 to $74,999 | 162 | 8.3% |
| $75,000 to $99,999 | 208 | 10.7% |
| $100,000 to $149,999 | 368 | 18.9% |
| $150,000 to $199,999 | 111 | 5.7% |
| $200,000+ | 873 | 44.8% |
Household Income by Householder Age in Isle Of Palms
The median household income in Isle Of Palms is $160,417, with the highest median household income of $250,001 found in the 25 to 44 years age bracket for the primary householder. A total of 360 households (18.5%) fall into this category. Meanwhile, the 15 to 24 years age bracket for the primary householder has the lowest median household income of $0, with 17 households (0.9%) in this group.
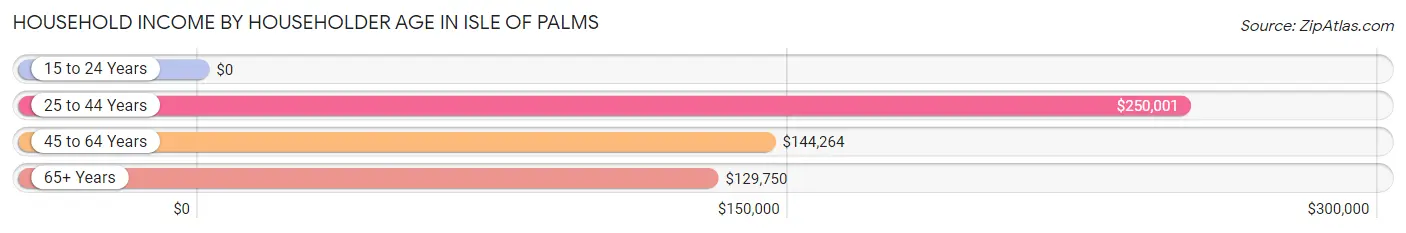
| Income Bracket | # Households | Median Income |
| 15 to 24 Years | 17 (0.9%) | $0 |
| 25 to 44 Years | 360 (18.5%) | $250,001 |
| 45 to 64 Years | 811 (41.6%) | $144,264 |
| 65+ Years | 760 (39.0%) | $129,750 |
| Total | 1,948 (100.0%) | $160,417 |
Poverty in Isle Of Palms
Income Below Poverty by Sex and Age in Isle Of Palms
With 2.0% poverty level for males and 2.3% for females among the residents of Isle Of Palms, 18 to 24 year old males and 75 year old and over females are the most vulnerable to poverty, with 14 males (20.0%) and 18 females (7.5%) in their respective age groups living below the poverty level.
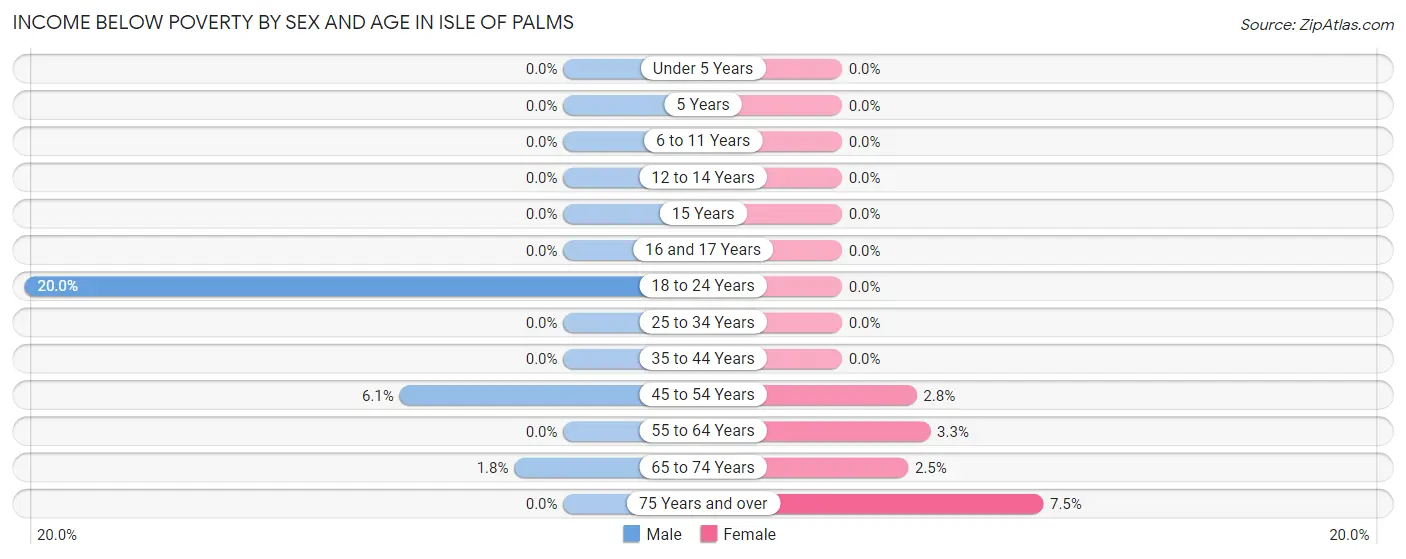
| Age Bracket | Male | Female |
| Under 5 Years | 0 (0.0%) | 0 (0.0%) |
| 5 Years | 0 (0.0%) | 0 (0.0%) |
| 6 to 11 Years | 0 (0.0%) | 0 (0.0%) |
| 12 to 14 Years | 0 (0.0%) | 0 (0.0%) |
| 15 Years | 0 (0.0%) | 0 (0.0%) |
| 16 and 17 Years | 0 (0.0%) | 0 (0.0%) |
| 18 to 24 Years | 14 (20.0%) | 0 (0.0%) |
| 25 to 34 Years | 0 (0.0%) | 0 (0.0%) |
| 35 to 44 Years | 0 (0.0%) | 0 (0.0%) |
| 45 to 54 Years | 24 (6.1%) | 9 (2.8%) |
| 55 to 64 Years | 0 (0.0%) | 10 (3.3%) |
| 65 to 74 Years | 8 (1.8%) | 10 (2.5%) |
| 75 Years and over | 0 (0.0%) | 18 (7.5%) |
| Total | 46 (2.0%) | 47 (2.3%) |
Income Above Poverty by Sex and Age in Isle Of Palms
According to the poverty statistics in Isle Of Palms, males aged under 5 years and females aged under 5 years are the age groups that are most secure financially, with 100.0% of males and 100.0% of females in these age groups living above the poverty line.
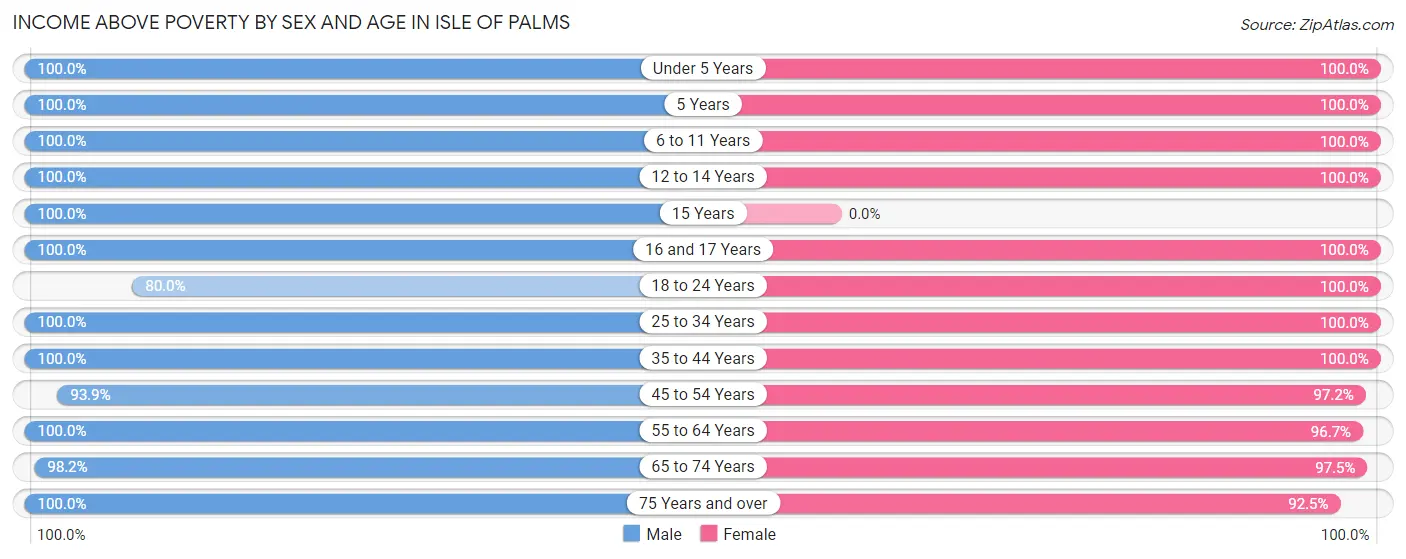
| Age Bracket | Male | Female |
| Under 5 Years | 85 (100.0%) | 67 (100.0%) |
| 5 Years | 11 (100.0%) | 34 (100.0%) |
| 6 to 11 Years | 174 (100.0%) | 177 (100.0%) |
| 12 to 14 Years | 33 (100.0%) | 57 (100.0%) |
| 15 Years | 16 (100.0%) | 0 (0.0%) |
| 16 and 17 Years | 23 (100.0%) | 41 (100.0%) |
| 18 to 24 Years | 56 (80.0%) | 44 (100.0%) |
| 25 to 34 Years | 106 (100.0%) | 144 (100.0%) |
| 35 to 44 Years | 316 (100.0%) | 230 (100.0%) |
| 45 to 54 Years | 371 (93.9%) | 316 (97.2%) |
| 55 to 64 Years | 366 (100.0%) | 295 (96.7%) |
| 65 to 74 Years | 432 (98.2%) | 397 (97.5%) |
| 75 Years and over | 227 (100.0%) | 223 (92.5%) |
| Total | 2,216 (98.0%) | 2,025 (97.7%) |
Income Below Poverty Among Married-Couple Families in Isle Of Palms
The poverty statistics for married-couple families in Isle Of Palms show that 1.2% or 16 of the total 1,299 families live below the poverty line. Families with no children have the highest poverty rate of 1.7%, comprising of 16 families. On the other hand, families with 1 or 2 children have the lowest poverty rate of 0.0%, which includes 0 families.
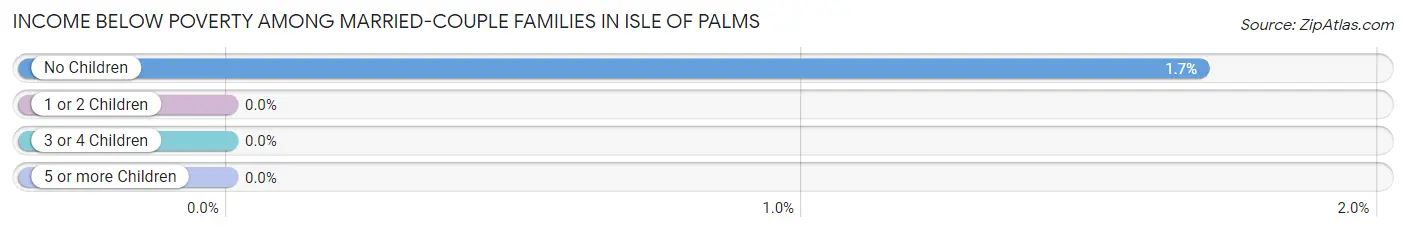
| Children | Above Poverty | Below Poverty |
| No Children | 929 (98.3%) | 16 (1.7%) |
| 1 or 2 Children | 234 (100.0%) | 0 (0.0%) |
| 3 or 4 Children | 120 (100.0%) | 0 (0.0%) |
| 5 or more Children | 0 (0.0%) | 0 (0.0%) |
| Total | 1,283 (98.8%) | 16 (1.2%) |
Income Below Poverty Among Single-Parent Households in Isle Of Palms
| Children | Single Father | Single Mother |
| No Children | 0 (0.0%) | 0 (0.0%) |
| 1 or 2 Children | 0 (0.0%) | 0 (0.0%) |
| 3 or 4 Children | 0 (0.0%) | 0 (0.0%) |
| 5 or more Children | 0 (0.0%) | 0 (0.0%) |
| Total | 0 (0.0%) | 0 (0.0%) |
Income Below Poverty Among Married-Couple vs Single-Parent Households in Isle Of Palms
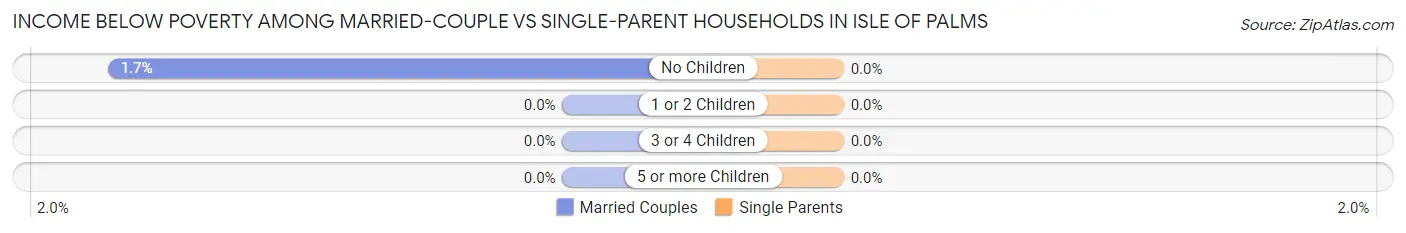
| Children | Married-Couple Families | Single-Parent Households |
| No Children | 16 (1.7%) | 0 (0.0%) |
| 1 or 2 Children | 0 (0.0%) | 0 (0.0%) |
| 3 or 4 Children | 0 (0.0%) | 0 (0.0%) |
| 5 or more Children | 0 (0.0%) | 0 (0.0%) |
| Total | 16 (1.2%) | 0 (0.0%) |
Race in Isle Of Palms
The most populous races in Isle Of Palms are White / Caucasian (4,208 | 96.8%), Asian (92 | 2.1%), and Hispanic or Latino (53 | 1.2%).
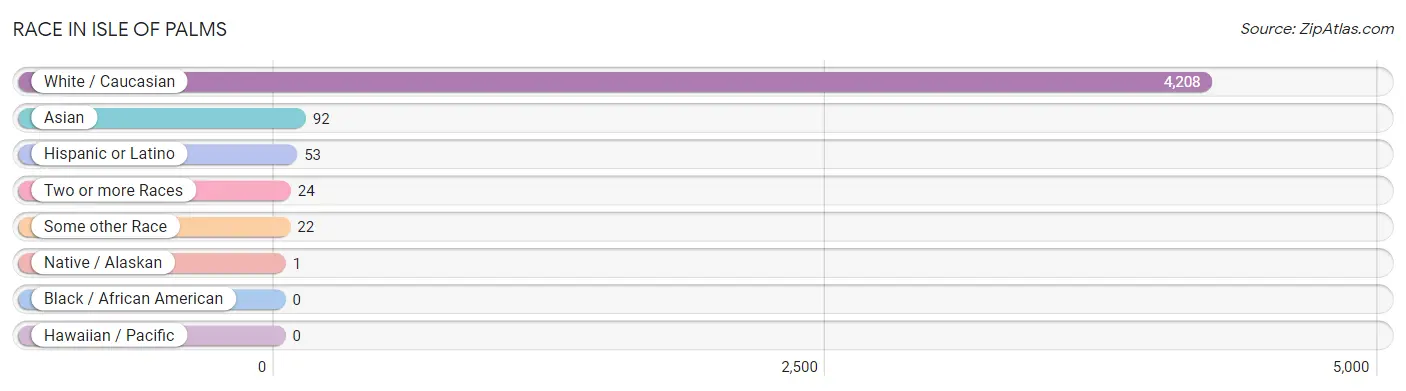
| Race | # Population | % Population |
| Asian | 92 | 2.1% |
| Black / African American | 0 | 0.0% |
| Hawaiian / Pacific | 0 | 0.0% |
| Hispanic or Latino | 53 | 1.2% |
| Native / Alaskan | 1 | 0.0% |
| White / Caucasian | 4,208 | 96.8% |
| Two or more Races | 24 | 0.5% |
| Some other Race | 22 | 0.5% |
| Total | 4,347 | 100.0% |
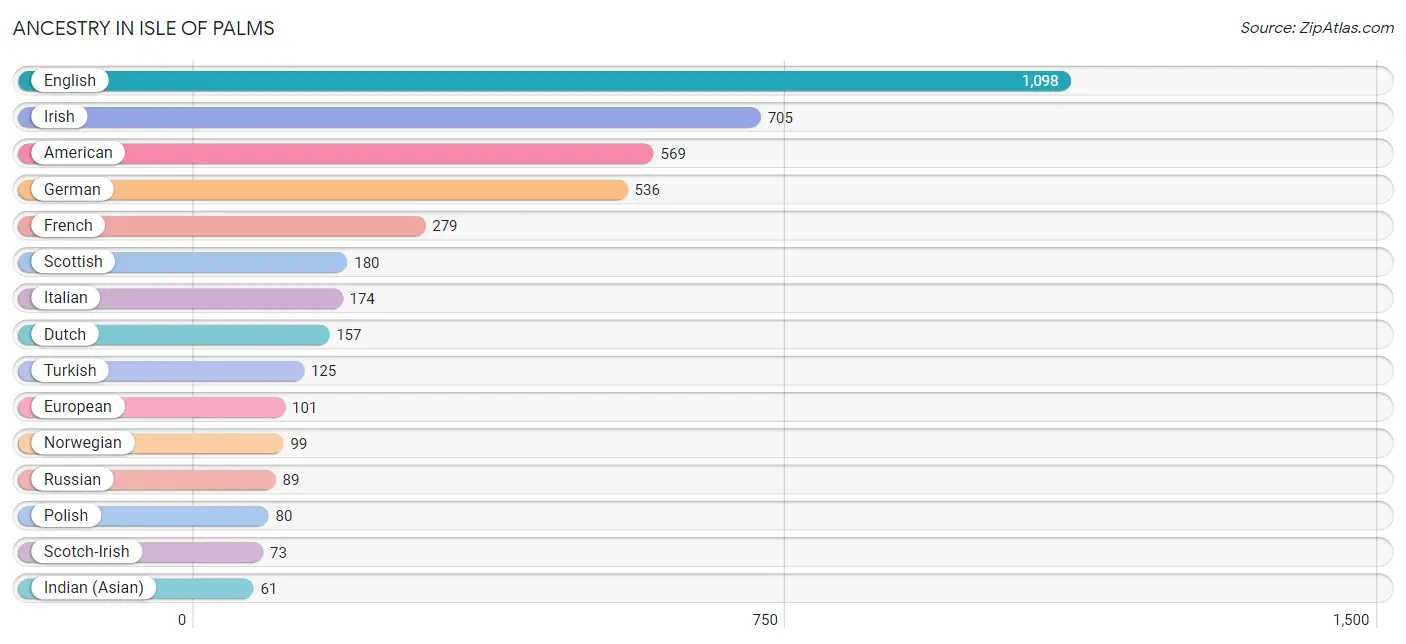
Ancestry in Isle Of Palms
The most populous ancestries reported in Isle Of Palms are English (1,098 | 25.3%), Irish (705 | 16.2%), American (569 | 13.1%), German (536 | 12.3%), and French (279 | 6.4%), together accounting for 73.3% of all Isle Of Palms residents.
| Ancestry | # Population | % Population |
| Afghan | 22 | 0.5% |
| American | 569 | 13.1% |
| Arab | 11 | 0.3% |
| Armenian | 9 | 0.2% |
| Austrian | 16 | 0.4% |
| British | 12 | 0.3% |
| Central American | 22 | 0.5% |
| Cherokee | 14 | 0.3% |
| Colombian | 14 | 0.3% |
| Czech | 3 | 0.1% |
| Dutch | 157 | 3.6% |
| Eastern European | 18 | 0.4% |
| English | 1,098 | 25.3% |
| European | 101 | 2.3% |
| French | 279 | 6.4% |
| French Canadian | 4 | 0.1% |
| German | 536 | 12.3% |
| Greek | 49 | 1.1% |
| Guatemalan | 22 | 0.5% |
| Hungarian | 49 | 1.1% |
| Indian (Asian) | 61 | 1.4% |
| Irish | 705 | 16.2% |
| Italian | 174 | 4.0% |
| Korean | 7 | 0.2% |
| Lithuanian | 14 | 0.3% |
| Macedonian | 5 | 0.1% |
| Mexican | 14 | 0.3% |
| Northern European | 7 | 0.2% |
| Norwegian | 99 | 2.3% |
| Polish | 80 | 1.8% |
| Romanian | 5 | 0.1% |
| Russian | 89 | 2.1% |
| Scotch-Irish | 73 | 1.7% |
| Scottish | 180 | 4.1% |
| Slavic | 30 | 0.7% |
| Slovak | 19 | 0.4% |
| South American | 14 | 0.3% |
| Spaniard | 3 | 0.1% |
| Spanish American Indian | 1 | 0.0% |
| Swedish | 11 | 0.3% |
| Swiss | 41 | 0.9% |
| Syrian | 11 | 0.3% |
| Thai | 24 | 0.5% |
| Turkish | 125 | 2.9% | View All 44 Rows |
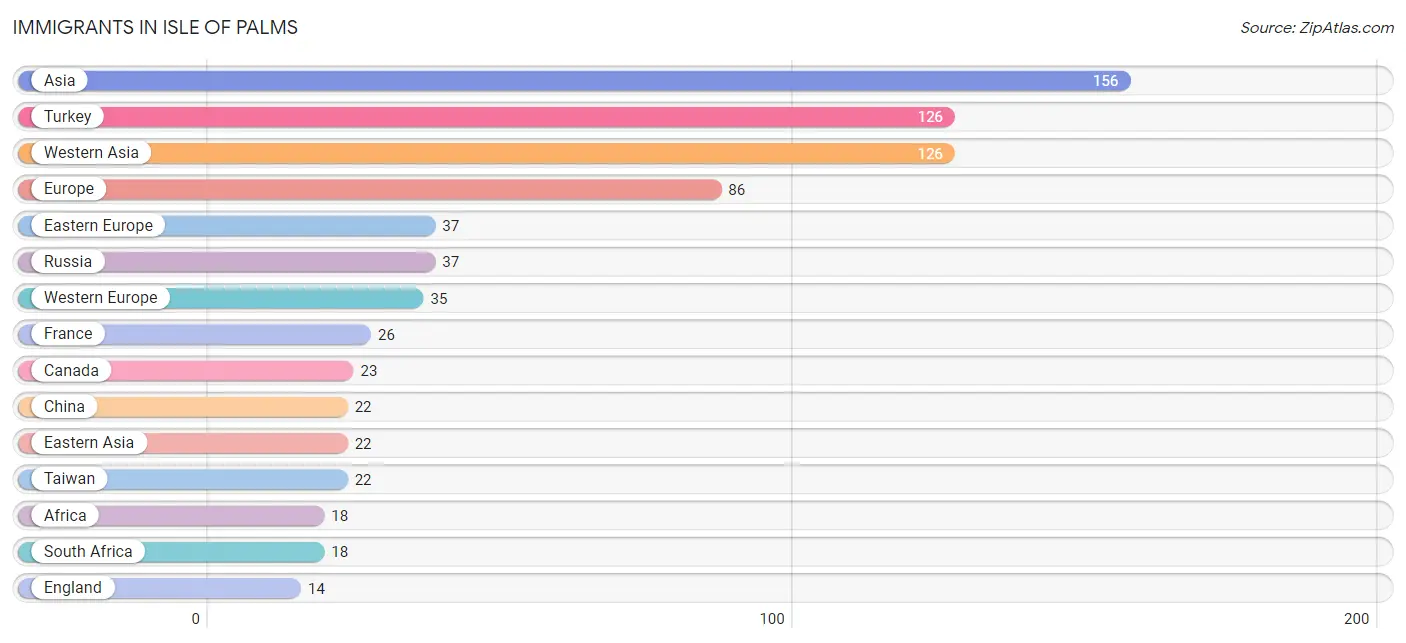
Immigrants in Isle Of Palms
The most numerous immigrant groups reported in Isle Of Palms came from Asia (156 | 3.6%), Turkey (126 | 2.9%), Western Asia (126 | 2.9%), Europe (86 | 2.0%), and Eastern Europe (37 | 0.9%), together accounting for 12.2% of all Isle Of Palms residents.
| Immigration Origin | # Population | % Population |
| Afghanistan | 7 | 0.2% |
| Africa | 18 | 0.4% |
| Asia | 156 | 3.6% |
| Canada | 23 | 0.5% |
| Central America | 7 | 0.2% |
| China | 22 | 0.5% |
| Colombia | 5 | 0.1% |
| Eastern Asia | 22 | 0.5% |
| Eastern Europe | 37 | 0.9% |
| England | 14 | 0.3% |
| Europe | 86 | 2.0% |
| France | 26 | 0.6% |
| Germany | 9 | 0.2% |
| Guatemala | 7 | 0.2% |
| India | 1 | 0.0% |
| Latin America | 12 | 0.3% |
| Northern Europe | 14 | 0.3% |
| Russia | 37 | 0.9% |
| South Africa | 18 | 0.4% |
| South America | 5 | 0.1% |
| South Central Asia | 8 | 0.2% |
| Taiwan | 22 | 0.5% |
| Turkey | 126 | 2.9% |
| Western Asia | 126 | 2.9% |
| Western Europe | 35 | 0.8% | View All 25 Rows |
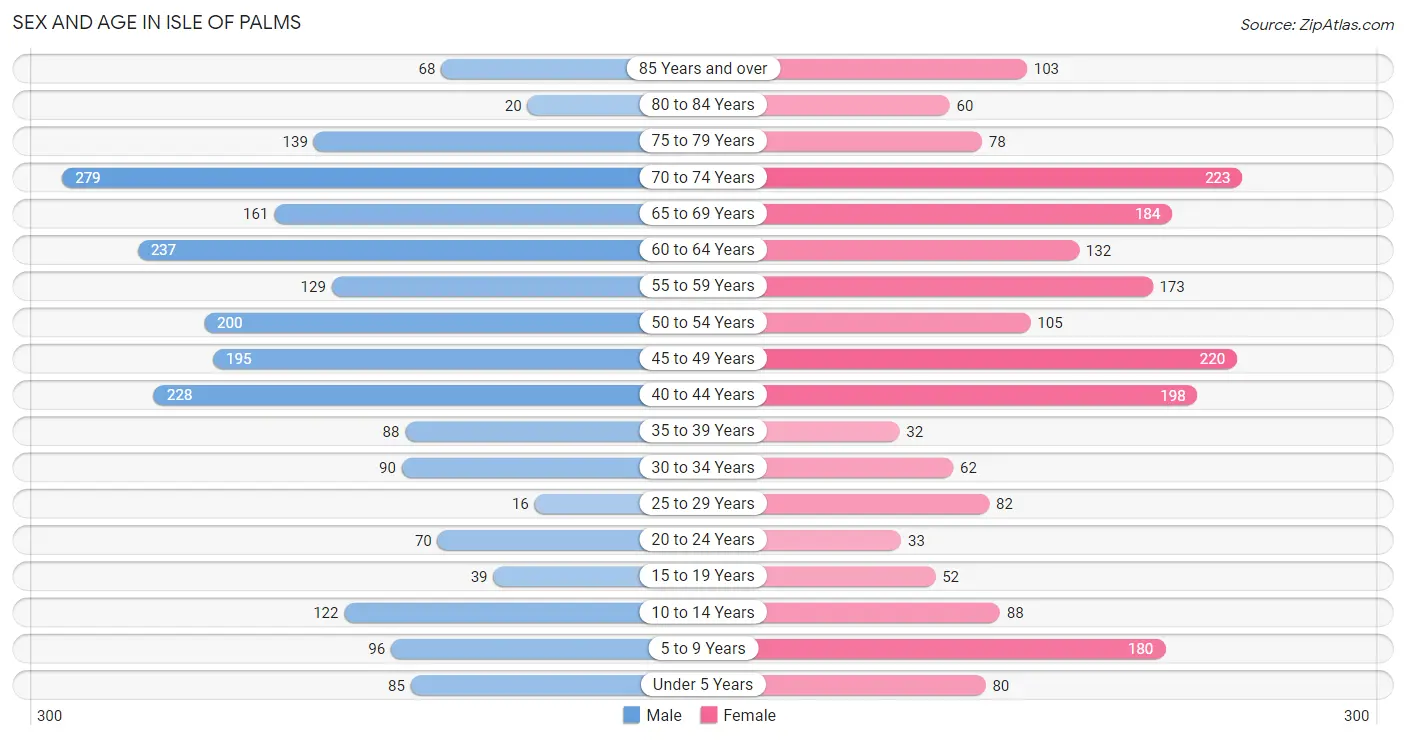
Sex and Age in Isle Of Palms
Sex and Age in Isle Of Palms
The most populous age groups in Isle Of Palms are 70 to 74 Years (279 | 12.3%) for men and 70 to 74 Years (223 | 10.7%) for women.
| Age Bracket | Male | Female |
| Under 5 Years | 85 (3.8%) | 80 (3.8%) |
| 5 to 9 Years | 96 (4.2%) | 180 (8.6%) |
| 10 to 14 Years | 122 (5.4%) | 88 (4.2%) |
| 15 to 19 Years | 39 (1.7%) | 52 (2.5%) |
| 20 to 24 Years | 70 (3.1%) | 33 (1.6%) |
| 25 to 29 Years | 16 (0.7%) | 82 (3.9%) |
| 30 to 34 Years | 90 (4.0%) | 62 (3.0%) |
| 35 to 39 Years | 88 (3.9%) | 32 (1.5%) |
| 40 to 44 Years | 228 (10.1%) | 198 (9.5%) |
| 45 to 49 Years | 195 (8.6%) | 220 (10.5%) |
| 50 to 54 Years | 200 (8.8%) | 105 (5.0%) |
| 55 to 59 Years | 129 (5.7%) | 173 (8.3%) |
| 60 to 64 Years | 237 (10.5%) | 132 (6.3%) |
| 65 to 69 Years | 161 (7.1%) | 184 (8.8%) |
| 70 to 74 Years | 279 (12.3%) | 223 (10.7%) |
| 75 to 79 Years | 139 (6.1%) | 78 (3.7%) |
| 80 to 84 Years | 20 (0.9%) | 60 (2.9%) |
| 85 Years and over | 68 (3.0%) | 103 (4.9%) |
| Total | 2,262 (100.0%) | 2,085 (100.0%) |
Families and Households in Isle Of Palms
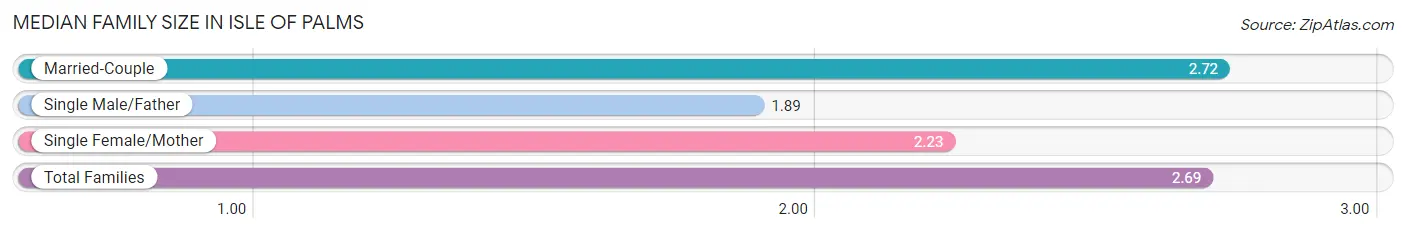
Median Family Size in Isle Of Palms
The median family size in Isle Of Palms is 2.69 persons per family, with married-couple families (1,299 | 95.7%) accounting for the largest median family size of 2.72 persons per family. On the other hand, single male/father families (19 | 1.4%) represent the smallest median family size with 1.89 persons per family.
| Family Type | # Families | Family Size |
| Married-Couple | 1,299 (95.7%) | 2.72 |
| Single Male/Father | 19 (1.4%) | 1.89 |
| Single Female/Mother | 40 (2.9%) | 2.23 |
| Total Families | 1,358 (100.0%) | 2.69 |
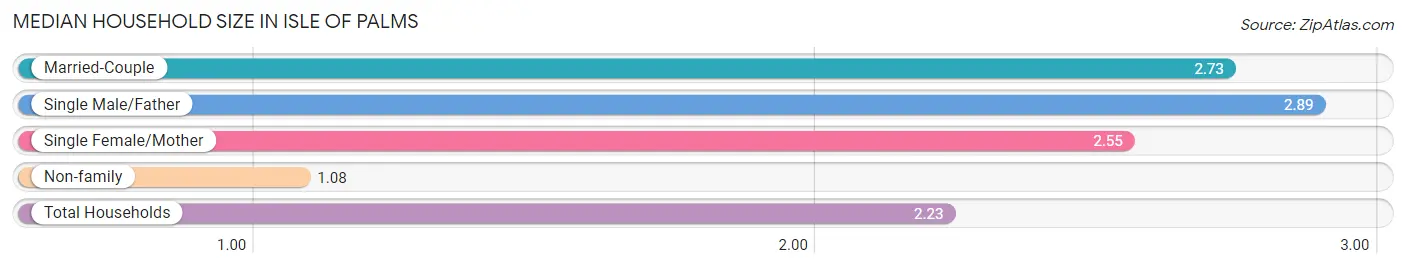
Median Household Size in Isle Of Palms
The median household size in Isle Of Palms is 2.23 persons per household, with single male/father households (19 | 1.0%) accounting for the largest median household size of 2.89 persons per household. non-family households (590 | 30.3%) represent the smallest median household size with 1.08 persons per household.
| Household Type | # Households | Household Size |
| Married-Couple | 1,299 (66.7%) | 2.73 |
| Single Male/Father | 19 (1.0%) | 2.89 |
| Single Female/Mother | 40 (2.1%) | 2.55 |
| Non-family | 590 (30.3%) | 1.08 |
| Total Households | 1,948 (100.0%) | 2.23 |
Household Size by Marriage Status in Isle Of Palms
Out of a total of 1,948 households in Isle Of Palms, 1,358 (69.7%) are family households, while 590 (30.3%) are nonfamily households. The most numerous type of family households are 2-person households, comprising 803, and the most common type of nonfamily households are 1-person households, comprising 559.
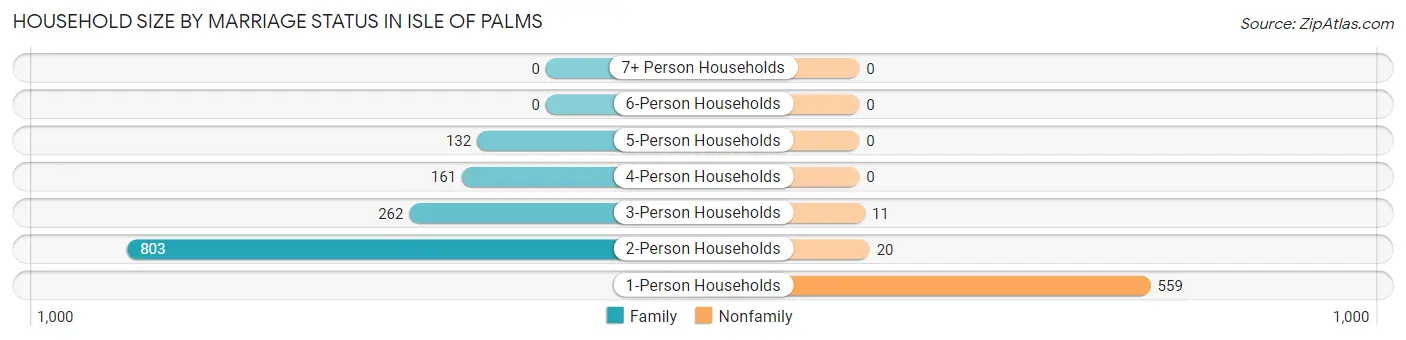
| Household Size | Family Households | Nonfamily Households |
| 1-Person Households | - | 559 (28.7%) |
| 2-Person Households | 803 (41.2%) | 20 (1.0%) |
| 3-Person Households | 262 (13.5%) | 11 (0.6%) |
| 4-Person Households | 161 (8.3%) | 0 (0.0%) |
| 5-Person Households | 132 (6.8%) | 0 (0.0%) |
| 6-Person Households | 0 (0.0%) | 0 (0.0%) |
| 7+ Person Households | 0 (0.0%) | 0 (0.0%) |
| Total | 1,358 (69.7%) | 590 (30.3%) |
Female Fertility in Isle Of Palms
Fertility by Age in Isle Of Palms
Average fertility rate in Isle Of Palms is 143.0 births per 1,000 women. Women in the age bracket of 20 to 34 years have the highest fertility rate with 316.0 births per 1,000 women. Women in the age bracket of 20 to 34 years acount for 56.0% of all women with births.
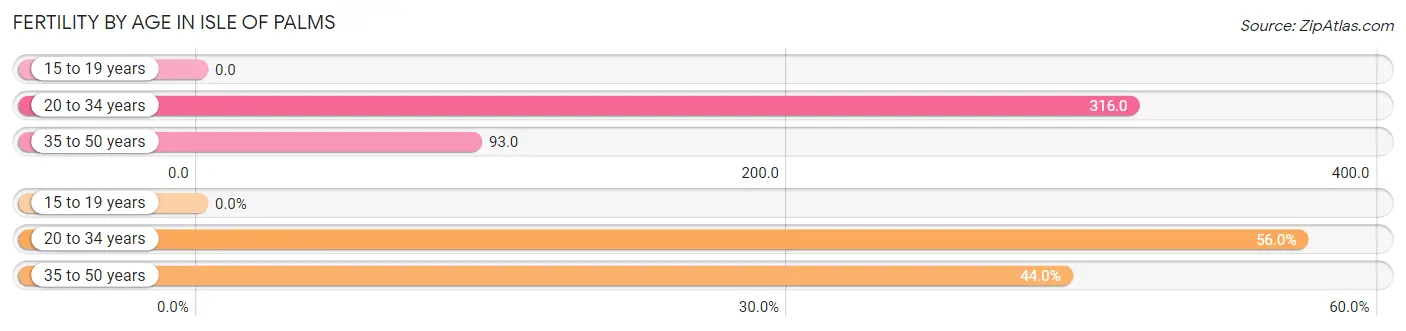
| Age Bracket | Women with Births | Births / 1,000 Women |
| 15 to 19 years | 0 (0.0%) | 0.0 |
| 20 to 34 years | 56 (56.0%) | 316.0 |
| 35 to 50 years | 44 (44.0%) | 93.0 |
| Total | 100 (100.0%) | 143.0 |
Fertility by Age by Marriage Status in Isle Of Palms
81.0% of women with births (100) in Isle Of Palms are married. The highest percentage of unmarried women with births falls into 20 to 34 years age bracket with 33.9% of them unmarried at the time of birth, while the lowest percentage of unmarried women with births belong to 35 to 50 years age bracket with 0.0% of them unmarried.
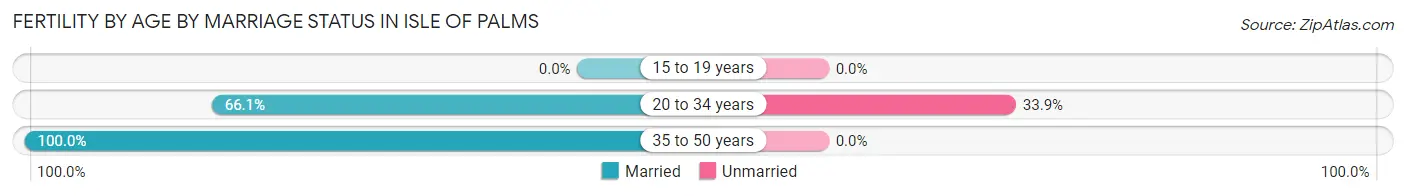
| Age Bracket | Married | Unmarried |
| 15 to 19 years | 0 (0.0%) | 0 (0.0%) |
| 20 to 34 years | 37 (66.1%) | 19 (33.9%) |
| 35 to 50 years | 44 (100.0%) | 0 (0.0%) |
| Total | 81 (81.0%) | 19 (19.0%) |
Fertility by Education in Isle Of Palms
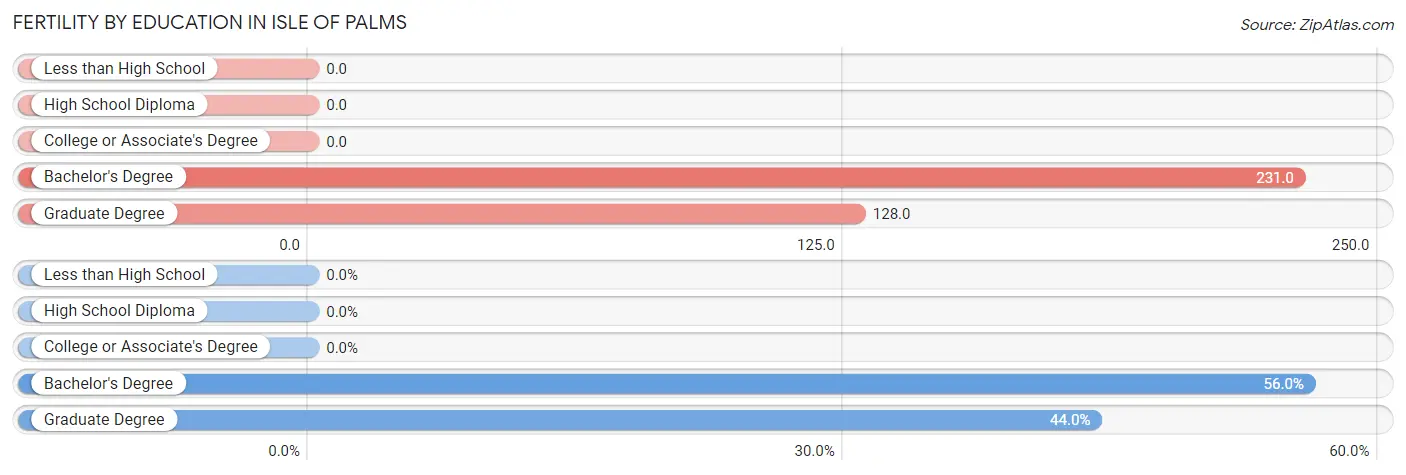
| Educational Attainment | Women with Births | Births / 1,000 Women |
| Less than High School | 0 (0.0%) | 0.0 |
| High School Diploma | 0 (0.0%) | 0.0 |
| College or Associate's Degree | 0 (0.0%) | 0.0 |
| Bachelor's Degree | 56 (56.0%) | 231.0 |
| Graduate Degree | 44 (44.0%) | 128.0 |
| Total | 100 (100.0%) | 143.0 |
Fertility by Education by Marriage Status in Isle Of Palms
19.0% of women with births in Isle Of Palms are unmarried. Women with the educational attainment of graduate degree are most likely to be married with 100.0% of them married at childbirth, while women with the educational attainment of bachelor's degree are least likely to be married with 33.9% of them unmarried at childbirth.
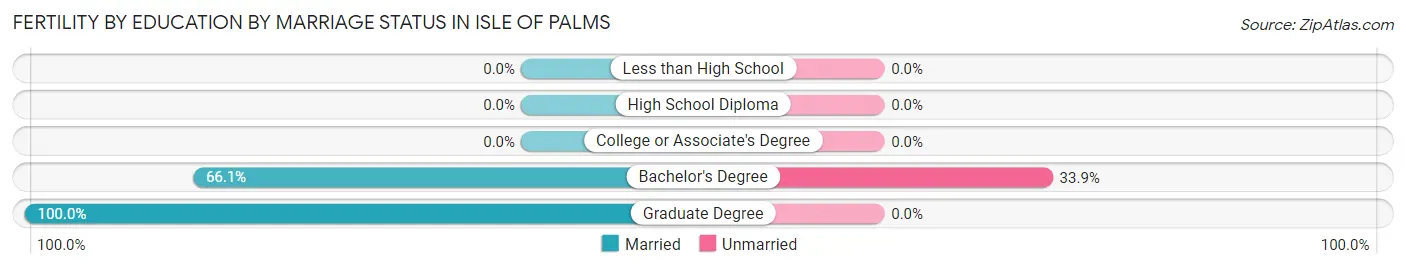
| Educational Attainment | Married | Unmarried |
| Less than High School | 0 (0.0%) | 0 (0.0%) |
| High School Diploma | 0 (0.0%) | 0 (0.0%) |
| College or Associate's Degree | 0 (0.0%) | 0 (0.0%) |
| Bachelor's Degree | 37 (66.1%) | 19 (33.9%) |
| Graduate Degree | 44 (100.0%) | 0 (0.0%) |
| Total | 81 (81.0%) | 19 (19.0%) |
Employment Characteristics in Isle Of Palms
Employment by Class of Employer in Isle Of Palms
Among the 1,899 employed individuals in Isle Of Palms, private company employees (1,243 | 65.5%), self-employed (not incorporated) (200 | 10.5%), and self-employed (incorporated) (170 | 8.9%) make up the most common classes of employment.
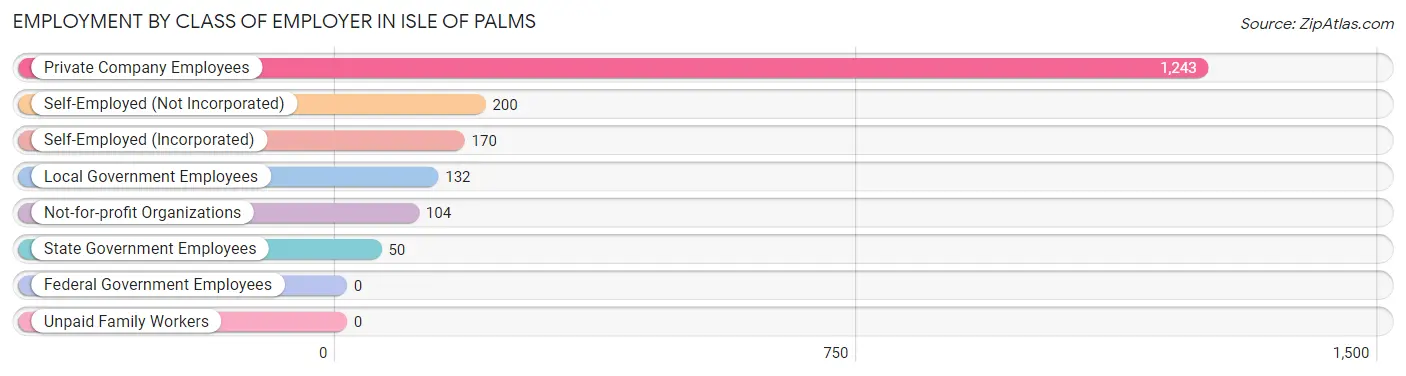
| Employer Class | # Employees | % Employees |
| Private Company Employees | 1,243 | 65.5% |
| Self-Employed (Incorporated) | 170 | 8.9% |
| Self-Employed (Not Incorporated) | 200 | 10.5% |
| Not-for-profit Organizations | 104 | 5.5% |
| Local Government Employees | 132 | 7.0% |
| State Government Employees | 50 | 2.6% |
| Federal Government Employees | 0 | 0.0% |
| Unpaid Family Workers | 0 | 0.0% |
| Total | 1,899 | 100.0% |
Employment Status by Age in Isle Of Palms
According to the labor force statistics for Isle Of Palms, out of the total population over 16 years of age (3,680), 52.1% or 1,917 individuals are in the labor force, with 0.7% or 13 of them unemployed. The age group with the highest labor force participation rate is 25 to 29 years, with 100.0% or 98 individuals in the labor force. Within the labor force, the 20 to 24 years age range has the highest percentage of unemployed individuals, with 16.7% or 14 of them being unemployed.
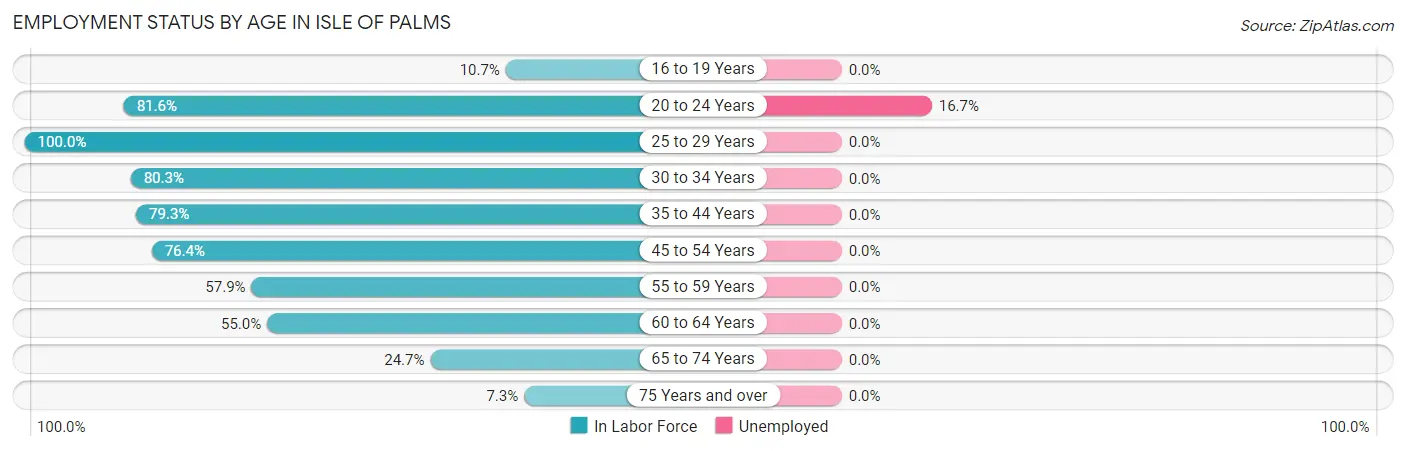
| Age Bracket | In Labor Force | Unemployed |
| 16 to 19 Years | 8 (10.7%) | 0 (0.0%) |
| 20 to 24 Years | 84 (81.6%) | 14 (16.7%) |
| 25 to 29 Years | 98 (100.0%) | 0 (0.0%) |
| 30 to 34 Years | 122 (80.3%) | 0 (0.0%) |
| 35 to 44 Years | 433 (79.3%) | 0 (0.0%) |
| 45 to 54 Years | 550 (76.4%) | 0 (0.0%) |
| 55 to 59 Years | 175 (57.9%) | 0 (0.0%) |
| 60 to 64 Years | 203 (55.0%) | 0 (0.0%) |
| 65 to 74 Years | 209 (24.7%) | 0 (0.0%) |
| 75 Years and over | 34 (7.3%) | 0 (0.0%) |
| Total | 1,917 (52.1%) | 13 (0.7%) |
Employment Status by Educational Attainment in Isle Of Palms
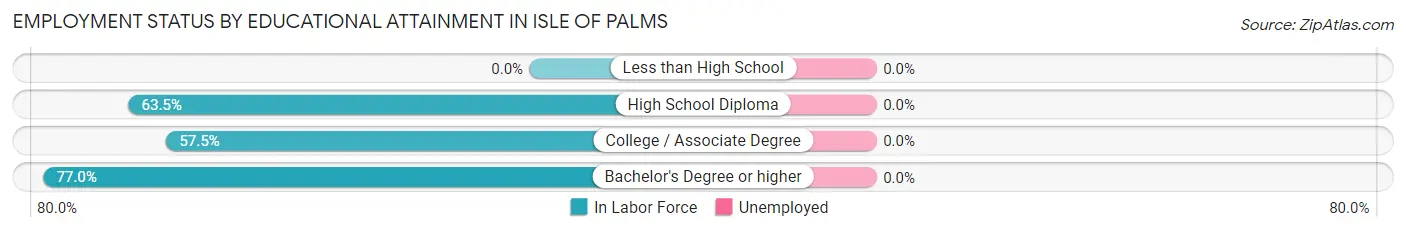
| Educational Attainment | In Labor Force | Unemployed |
| Less than High School | 0 (0.0%) | 0 (0.0%) |
| High School Diploma | 66 (63.5%) | 0 (0.0%) |
| College / Associate Degree | 264 (57.5%) | 0 (0.0%) |
| Bachelor's Degree or higher | 1,250 (77.0%) | 0 (0.0%) |
| Total | 1,581 (72.3%) | 0 (0.0%) |
Employment Occupations by Sex in Isle Of Palms
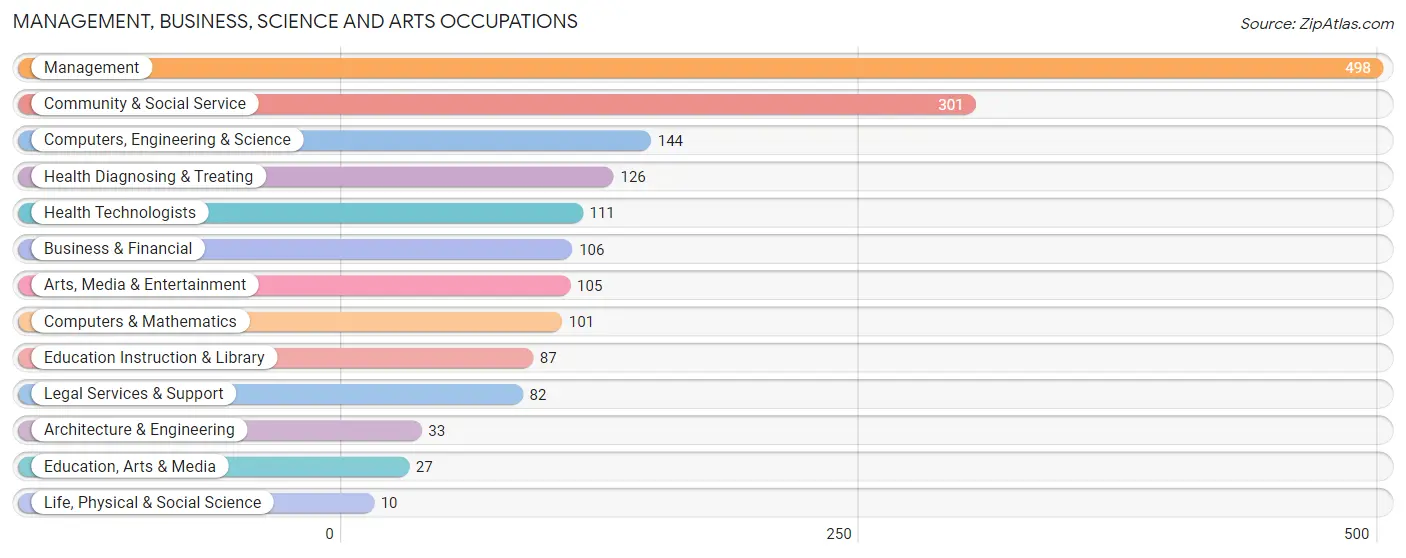
Management, Business, Science and Arts Occupations
The most common Management, Business, Science and Arts occupations in Isle Of Palms are Management (498 | 26.2%), Community & Social Service (301 | 15.8%), Computers, Engineering & Science (144 | 7.6%), Health Diagnosing & Treating (126 | 6.6%), and Health Technologists (111 | 5.8%).
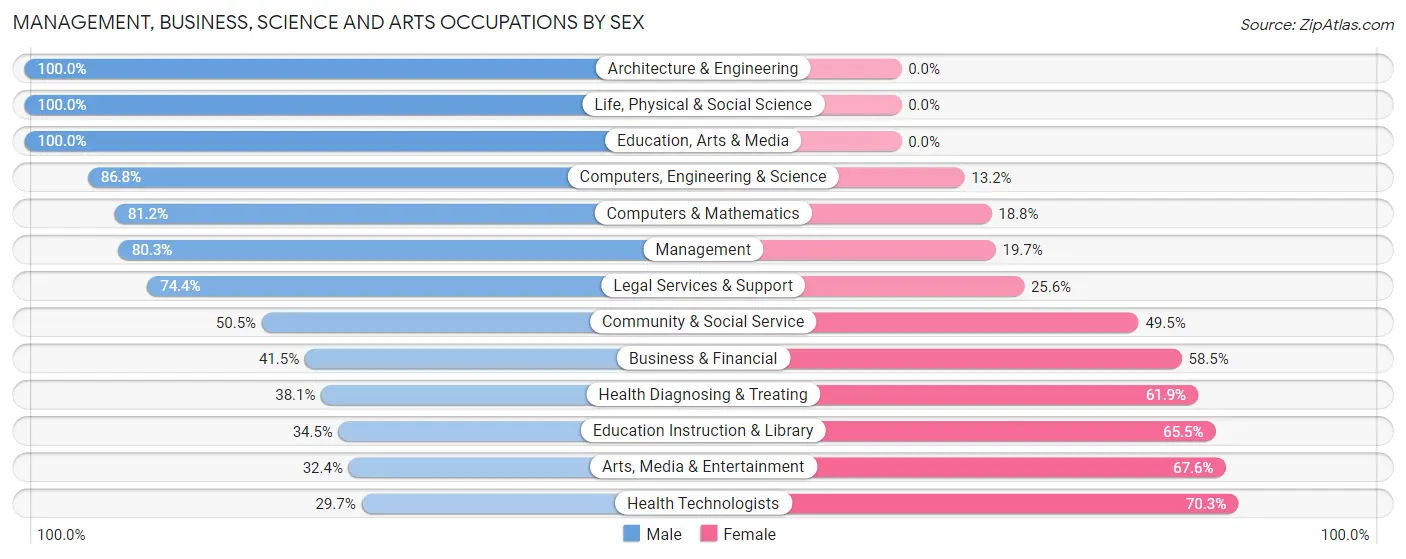
Management, Business, Science and Arts Occupations by Sex
Within the Management, Business, Science and Arts occupations in Isle Of Palms, the most male-oriented occupations are Architecture & Engineering (100.0%), Life, Physical & Social Science (100.0%), and Education, Arts & Media (100.0%), while the most female-oriented occupations are Health Technologists (70.3%), Arts, Media & Entertainment (67.6%), and Education Instruction & Library (65.5%).
| Occupation | Male | Female |
| Management | 400 (80.3%) | 98 (19.7%) |
| Business & Financial | 44 (41.5%) | 62 (58.5%) |
| Computers, Engineering & Science | 125 (86.8%) | 19 (13.2%) |
| Computers & Mathematics | 82 (81.2%) | 19 (18.8%) |
| Architecture & Engineering | 33 (100.0%) | 0 (0.0%) |
| Life, Physical & Social Science | 10 (100.0%) | 0 (0.0%) |
| Community & Social Service | 152 (50.5%) | 149 (49.5%) |
| Education, Arts & Media | 27 (100.0%) | 0 (0.0%) |
| Legal Services & Support | 61 (74.4%) | 21 (25.6%) |
| Education Instruction & Library | 30 (34.5%) | 57 (65.5%) |
| Arts, Media & Entertainment | 34 (32.4%) | 71 (67.6%) |
| Health Diagnosing & Treating | 48 (38.1%) | 78 (61.9%) |
| Health Technologists | 33 (29.7%) | 78 (70.3%) |
| Total (Category) | 769 (65.4%) | 406 (34.5%) |
| Total (Overall) | 1,224 (64.3%) | 678 (35.6%) |
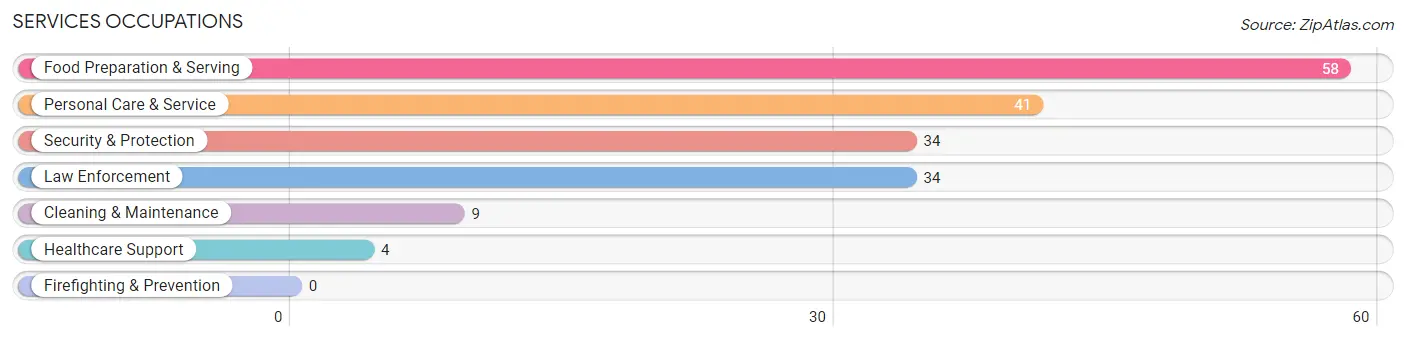
Services Occupations
The most common Services occupations in Isle Of Palms are Food Preparation & Serving (58 | 3.0%), Personal Care & Service (41 | 2.2%), Security & Protection (34 | 1.8%), Law Enforcement (34 | 1.8%), and Cleaning & Maintenance (9 | 0.5%).
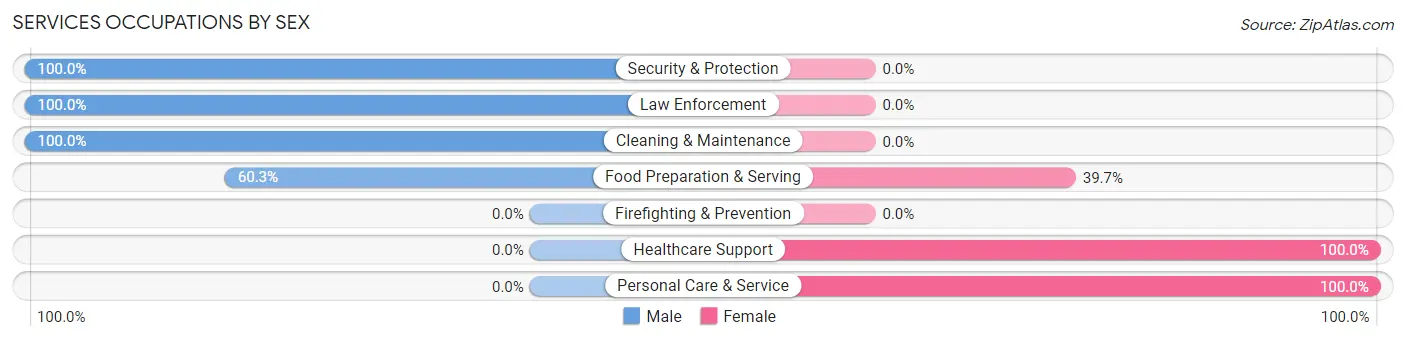
Services Occupations by Sex
Within the Services occupations in Isle Of Palms, the most male-oriented occupations are Security & Protection (100.0%), Law Enforcement (100.0%), and Cleaning & Maintenance (100.0%), while the most female-oriented occupations are Healthcare Support (100.0%), Personal Care & Service (100.0%), and Food Preparation & Serving (39.7%).
| Occupation | Male | Female |
| Healthcare Support | 0 (0.0%) | 4 (100.0%) |
| Security & Protection | 34 (100.0%) | 0 (0.0%) |
| Firefighting & Prevention | 0 (0.0%) | 0 (0.0%) |
| Law Enforcement | 34 (100.0%) | 0 (0.0%) |
| Food Preparation & Serving | 35 (60.3%) | 23 (39.7%) |
| Cleaning & Maintenance | 9 (100.0%) | 0 (0.0%) |
| Personal Care & Service | 0 (0.0%) | 41 (100.0%) |
| Total (Category) | 78 (53.4%) | 68 (46.6%) |
| Total (Overall) | 1,224 (64.3%) | 678 (35.6%) |
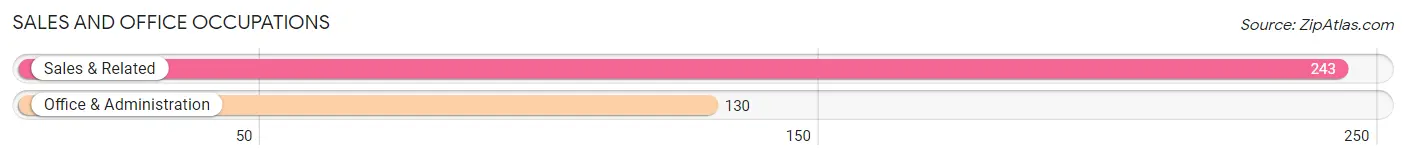
Sales and Office Occupations
The most common Sales and Office occupations in Isle Of Palms are Sales & Related (243 | 12.8%), and Office & Administration (130 | 6.8%).
Sales and Office Occupations by Sex
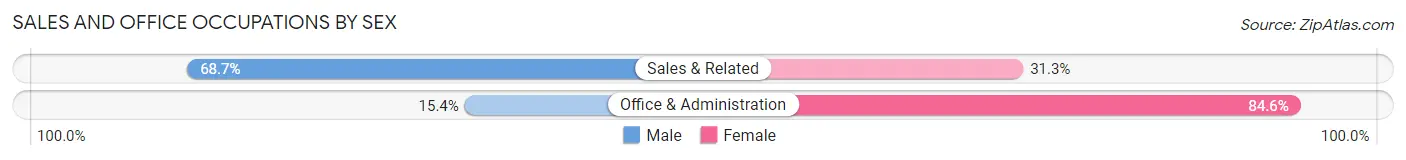
| Occupation | Male | Female |
| Sales & Related | 167 (68.7%) | 76 (31.3%) |
| Office & Administration | 20 (15.4%) | 110 (84.6%) |
| Total (Category) | 187 (50.1%) | 186 (49.9%) |
| Total (Overall) | 1,224 (64.3%) | 678 (35.6%) |
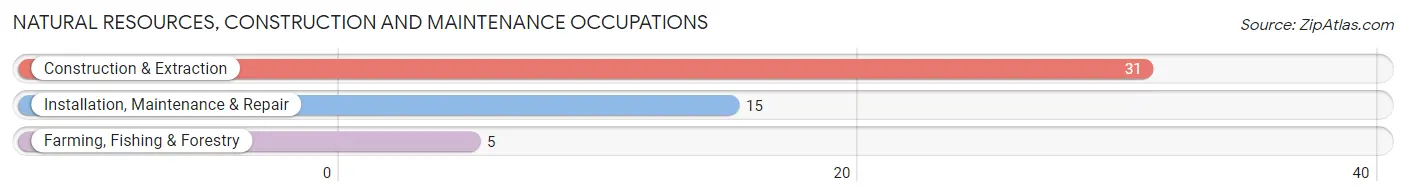
Natural Resources, Construction and Maintenance Occupations
The most common Natural Resources, Construction and Maintenance occupations in Isle Of Palms are Construction & Extraction (31 | 1.6%), Installation, Maintenance & Repair (15 | 0.8%), and Farming, Fishing & Forestry (5 | 0.3%).
Natural Resources, Construction and Maintenance Occupations by Sex
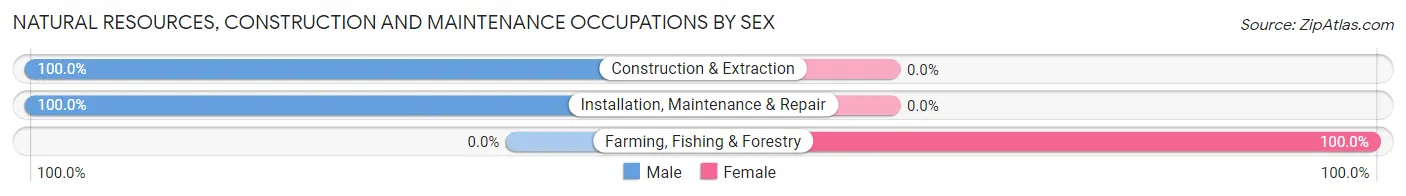
| Occupation | Male | Female |
| Farming, Fishing & Forestry | 0 (0.0%) | 5 (100.0%) |
| Construction & Extraction | 31 (100.0%) | 0 (0.0%) |
| Installation, Maintenance & Repair | 15 (100.0%) | 0 (0.0%) |
| Total (Category) | 46 (90.2%) | 5 (9.8%) |
| Total (Overall) | 1,224 (64.3%) | 678 (35.6%) |
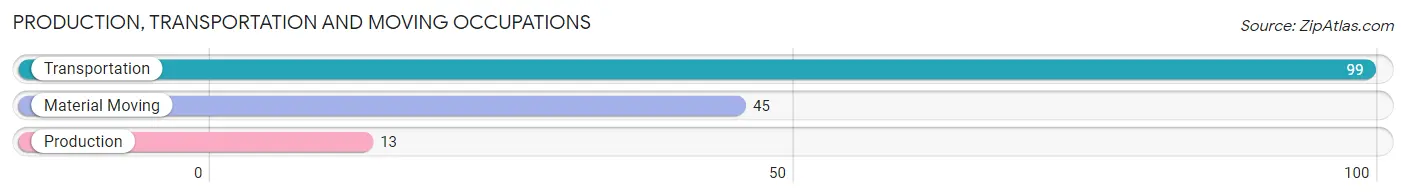
Production, Transportation and Moving Occupations
The most common Production, Transportation and Moving occupations in Isle Of Palms are Transportation (99 | 5.2%), Material Moving (45 | 2.4%), and Production (13 | 0.7%).
Production, Transportation and Moving Occupations by Sex
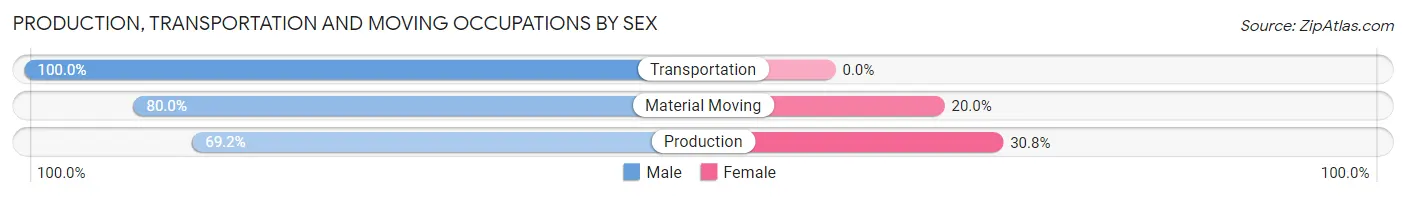
| Occupation | Male | Female |
| Production | 9 (69.2%) | 4 (30.8%) |
| Transportation | 99 (100.0%) | 0 (0.0%) |
| Material Moving | 36 (80.0%) | 9 (20.0%) |
| Total (Category) | 144 (91.7%) | 13 (8.3%) |
| Total (Overall) | 1,224 (64.3%) | 678 (35.6%) |
Employment Industries by Sex in Isle Of Palms
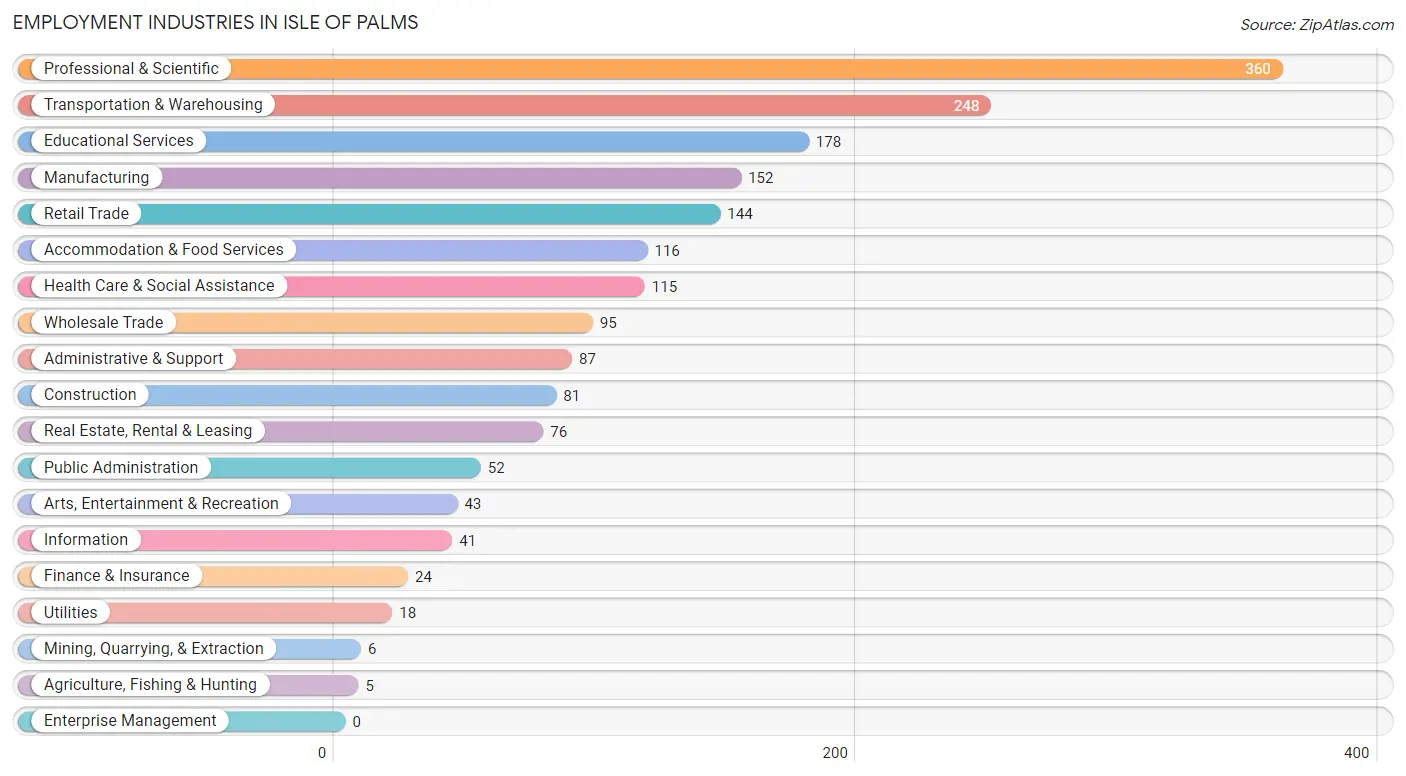
Employment Industries in Isle Of Palms
The major employment industries in Isle Of Palms include Professional & Scientific (360 | 18.9%), Transportation & Warehousing (248 | 13.0%), Educational Services (178 | 9.4%), Manufacturing (152 | 8.0%), and Retail Trade (144 | 7.6%).
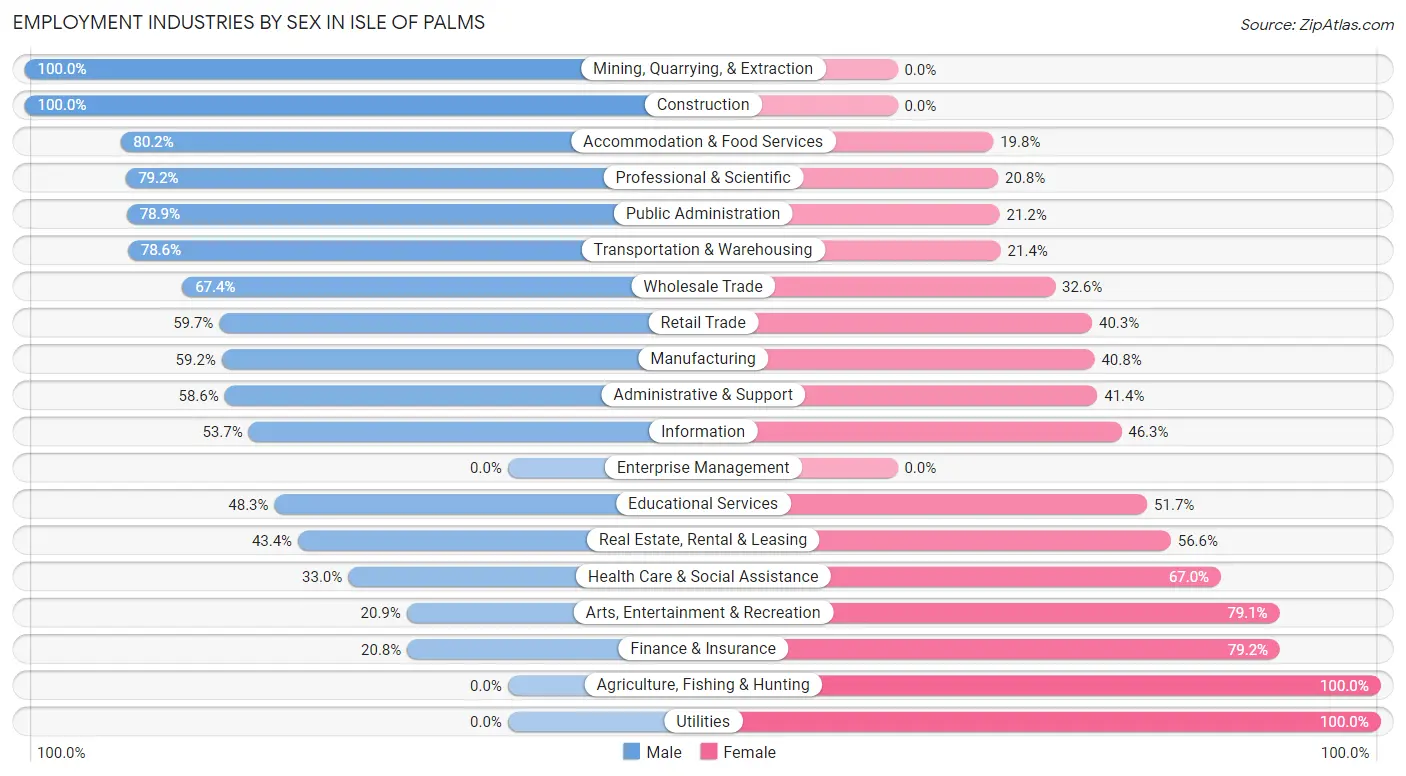
Employment Industries by Sex in Isle Of Palms
The Isle Of Palms industries that see more men than women are Mining, Quarrying, & Extraction (100.0%), Construction (100.0%), and Accommodation & Food Services (80.2%), whereas the industries that tend to have a higher number of women are Agriculture, Fishing & Hunting (100.0%), Utilities (100.0%), and Finance & Insurance (79.2%).
| Industry | Male | Female |
| Agriculture, Fishing & Hunting | 0 (0.0%) | 5 (100.0%) |
| Mining, Quarrying, & Extraction | 6 (100.0%) | 0 (0.0%) |
| Construction | 81 (100.0%) | 0 (0.0%) |
| Manufacturing | 90 (59.2%) | 62 (40.8%) |
| Wholesale Trade | 64 (67.4%) | 31 (32.6%) |
| Retail Trade | 86 (59.7%) | 58 (40.3%) |
| Transportation & Warehousing | 195 (78.6%) | 53 (21.4%) |
| Utilities | 0 (0.0%) | 18 (100.0%) |
| Information | 22 (53.7%) | 19 (46.3%) |
| Finance & Insurance | 5 (20.8%) | 19 (79.2%) |
| Real Estate, Rental & Leasing | 33 (43.4%) | 43 (56.6%) |
| Professional & Scientific | 285 (79.2%) | 75 (20.8%) |
| Enterprise Management | 0 (0.0%) | 0 (0.0%) |
| Administrative & Support | 51 (58.6%) | 36 (41.4%) |
| Educational Services | 86 (48.3%) | 92 (51.7%) |
| Health Care & Social Assistance | 38 (33.0%) | 77 (67.0%) |
| Arts, Entertainment & Recreation | 9 (20.9%) | 34 (79.1%) |
| Accommodation & Food Services | 93 (80.2%) | 23 (19.8%) |
| Public Administration | 41 (78.8%) | 11 (21.1%) |
| Total | 1,224 (64.3%) | 678 (35.6%) |
Education in Isle Of Palms
School Enrollment in Isle Of Palms
The most common levels of schooling among the 657 students in Isle Of Palms are elementary school (238 | 36.2%), middle school (124 | 18.9%), and high school (115 | 17.5%).
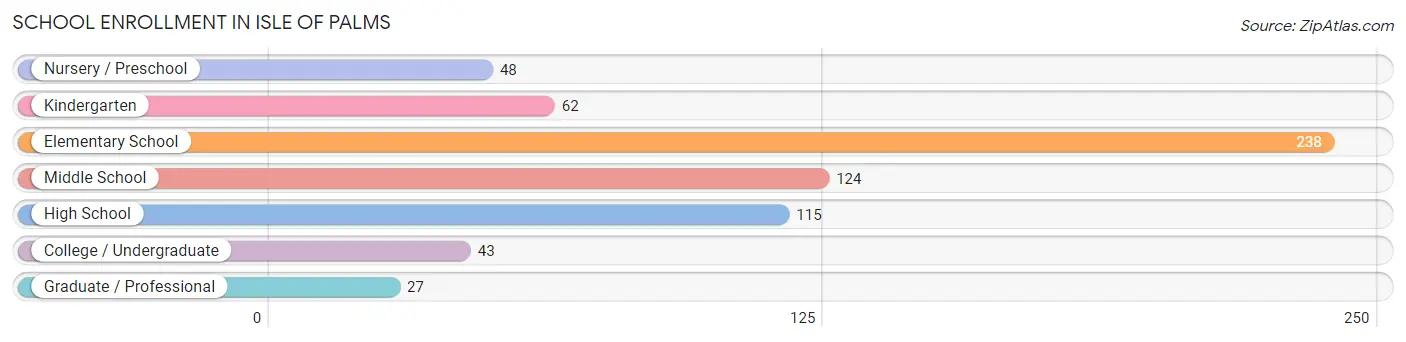
| School Level | # Students | % Students |
| Nursery / Preschool | 48 | 7.3% |
| Kindergarten | 62 | 9.4% |
| Elementary School | 238 | 36.2% |
| Middle School | 124 | 18.9% |
| High School | 115 | 17.5% |
| College / Undergraduate | 43 | 6.5% |
| Graduate / Professional | 27 | 4.1% |
| Total | 657 | 100.0% |
School Enrollment by Age by Funding Source in Isle Of Palms
Out of a total of 657 students who are enrolled in schools in Isle Of Palms, 120 (18.3%) attend a private institution, while the remaining 537 (81.7%) are enrolled in public schools. The age group of 3 to 4 year olds has the highest likelihood of being enrolled in private schools, with 21 (67.7% in the age bracket) enrolled. Conversely, the age group of 18 to 19 year olds has the lowest likelihood of being enrolled in a private school, with 11 (100.0% in the age bracket) attending a public institution.
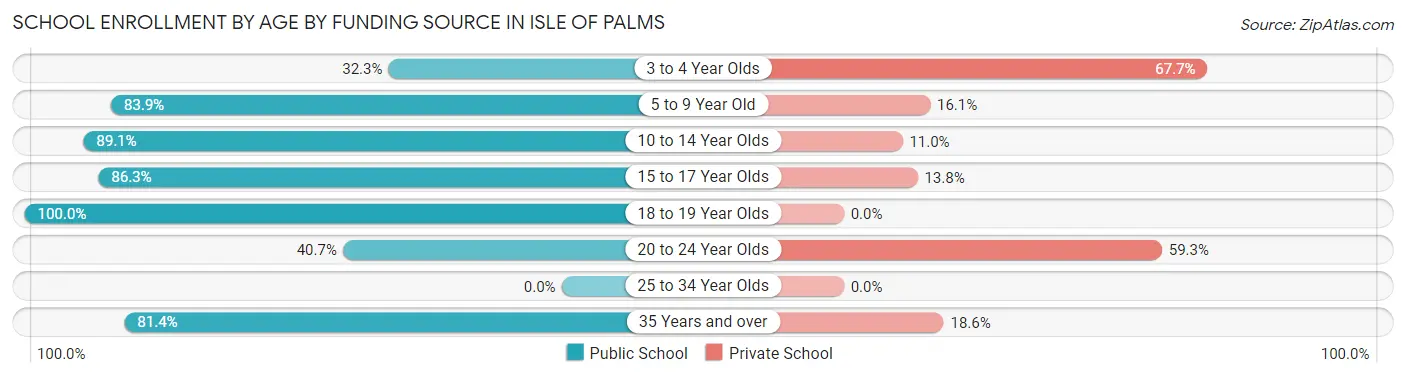
| Age Bracket | Public School | Private School |
| 3 to 4 Year Olds | 10 (32.3%) | 21 (67.7%) |
| 5 to 9 Year Old | 214 (83.9%) | 41 (16.1%) |
| 10 to 14 Year Olds | 187 (89.0%) | 23 (11.0%) |
| 15 to 17 Year Olds | 69 (86.3%) | 11 (13.8%) |
| 18 to 19 Year Olds | 11 (100.0%) | 0 (0.0%) |
| 20 to 24 Year Olds | 11 (40.7%) | 16 (59.3%) |
| 25 to 34 Year Olds | 0 (0.0%) | 0 (0.0%) |
| 35 Years and over | 35 (81.4%) | 8 (18.6%) |
| Total | 537 (81.7%) | 120 (18.3%) |
Educational Attainment by Field of Study in Isle Of Palms
Business (569 | 21.1%), education (260 | 9.6%), literature & languages (241 | 8.9%), bio, nature & agricultural (238 | 8.8%), and science & technology (209 | 7.7%) are the most common fields of study among 2,701 individuals in Isle Of Palms who have obtained a bachelor's degree or higher.
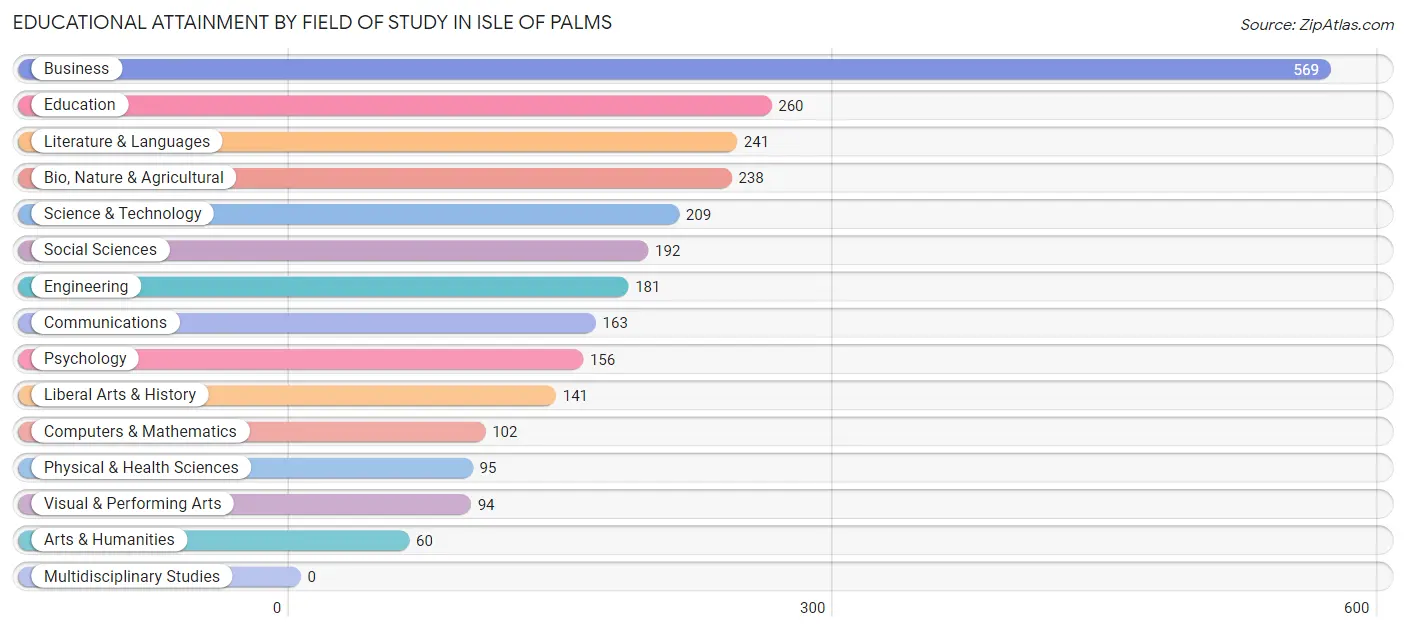
| Field of Study | # Graduates | % Graduates |
| Computers & Mathematics | 102 | 3.8% |
| Bio, Nature & Agricultural | 238 | 8.8% |
| Physical & Health Sciences | 95 | 3.5% |
| Psychology | 156 | 5.8% |
| Social Sciences | 192 | 7.1% |
| Engineering | 181 | 6.7% |
| Multidisciplinary Studies | 0 | 0.0% |
| Science & Technology | 209 | 7.7% |
| Business | 569 | 21.1% |
| Education | 260 | 9.6% |
| Literature & Languages | 241 | 8.9% |
| Liberal Arts & History | 141 | 5.2% |
| Visual & Performing Arts | 94 | 3.5% |
| Communications | 163 | 6.0% |
| Arts & Humanities | 60 | 2.2% |
| Total | 2,701 | 100.0% |
Transportation & Commute in Isle Of Palms
Vehicle Availability by Sex in Isle Of Palms
The most prevalent vehicle ownership categories in Isle Of Palms are males with 2 vehicles (607, accounting for 49.6%) and females with 2 vehicles (417, making up 89.9%).
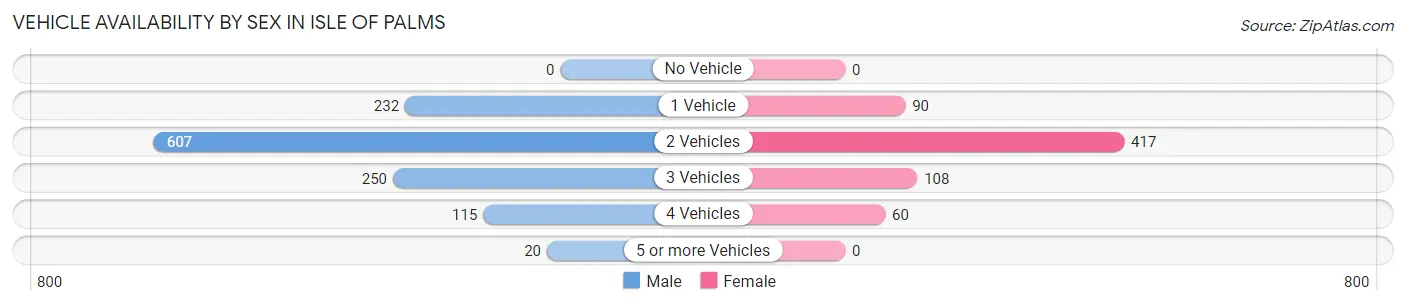
| Vehicles Available | Male | Female |
| No Vehicle | 0 (0.0%) | 0 (0.0%) |
| 1 Vehicle | 232 (19.0%) | 90 (13.3%) |
| 2 Vehicles | 607 (49.6%) | 417 (61.8%) |
| 3 Vehicles | 250 (20.4%) | 108 (16.0%) |
| 4 Vehicles | 115 (9.4%) | 60 (8.9%) |
| 5 or more Vehicles | 20 (1.6%) | 0 (0.0%) |
| Total | 1,224 (100.0%) | 675 (100.0%) |
Commute Time in Isle Of Palms
The most frequently occuring commute durations in Isle Of Palms are 30 to 34 minutes (469 commuters, 32.9%), 20 to 24 minutes (162 commuters, 11.4%), and 15 to 19 minutes (137 commuters, 9.6%).
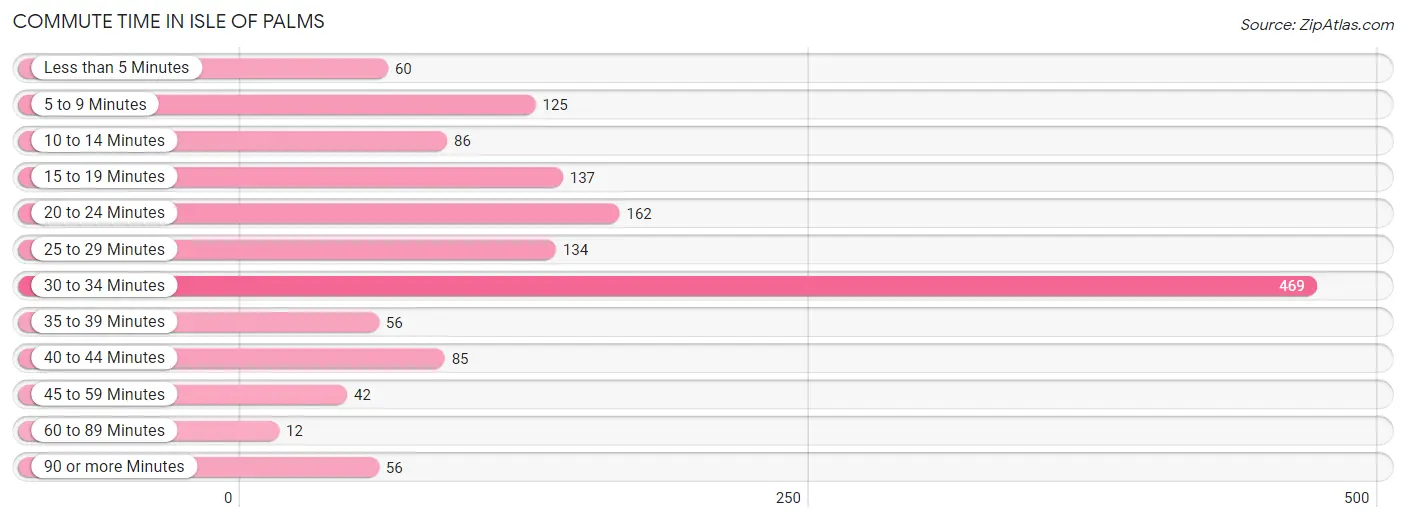
| Commute Time | # Commuters | % Commuters |
| Less than 5 Minutes | 60 | 4.2% |
| 5 to 9 Minutes | 125 | 8.8% |
| 10 to 14 Minutes | 86 | 6.0% |
| 15 to 19 Minutes | 137 | 9.6% |
| 20 to 24 Minutes | 162 | 11.4% |
| 25 to 29 Minutes | 134 | 9.4% |
| 30 to 34 Minutes | 469 | 32.9% |
| 35 to 39 Minutes | 56 | 3.9% |
| 40 to 44 Minutes | 85 | 6.0% |
| 45 to 59 Minutes | 42 | 2.9% |
| 60 to 89 Minutes | 12 | 0.8% |
| 90 or more Minutes | 56 | 3.9% |
Commute Time by Sex in Isle Of Palms
The most common commute times in Isle Of Palms are 30 to 34 minutes (330 commuters, 35.4%) for males and 30 to 34 minutes (139 commuters, 28.2%) for females.
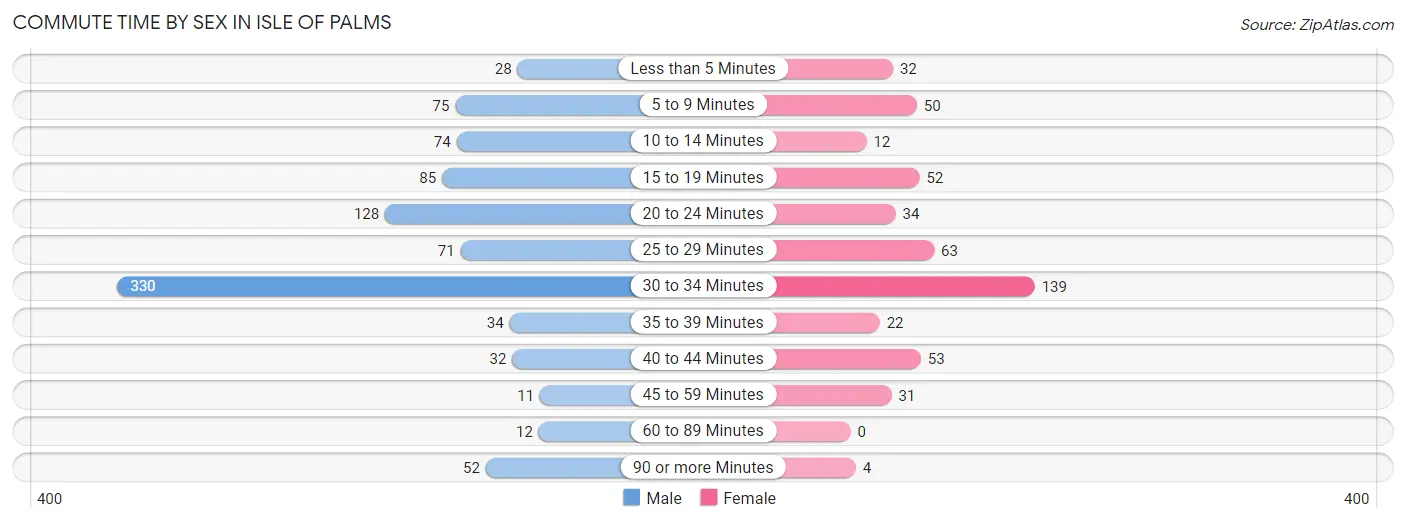
| Commute Time | Male | Female |
| Less than 5 Minutes | 28 (3.0%) | 32 (6.5%) |
| 5 to 9 Minutes | 75 (8.1%) | 50 (10.2%) |
| 10 to 14 Minutes | 74 (7.9%) | 12 (2.4%) |
| 15 to 19 Minutes | 85 (9.1%) | 52 (10.6%) |
| 20 to 24 Minutes | 128 (13.7%) | 34 (6.9%) |
| 25 to 29 Minutes | 71 (7.6%) | 63 (12.8%) |
| 30 to 34 Minutes | 330 (35.4%) | 139 (28.2%) |
| 35 to 39 Minutes | 34 (3.6%) | 22 (4.5%) |
| 40 to 44 Minutes | 32 (3.4%) | 53 (10.8%) |
| 45 to 59 Minutes | 11 (1.2%) | 31 (6.3%) |
| 60 to 89 Minutes | 12 (1.3%) | 0 (0.0%) |
| 90 or more Minutes | 52 (5.6%) | 4 (0.8%) |
Time of Departure to Work by Sex in Isle Of Palms
The most frequent times of departure to work in Isle Of Palms are 7:00 AM to 7:29 AM (238, 25.5%) for males and 8:00 AM to 8:29 AM (86, 17.5%) for females.
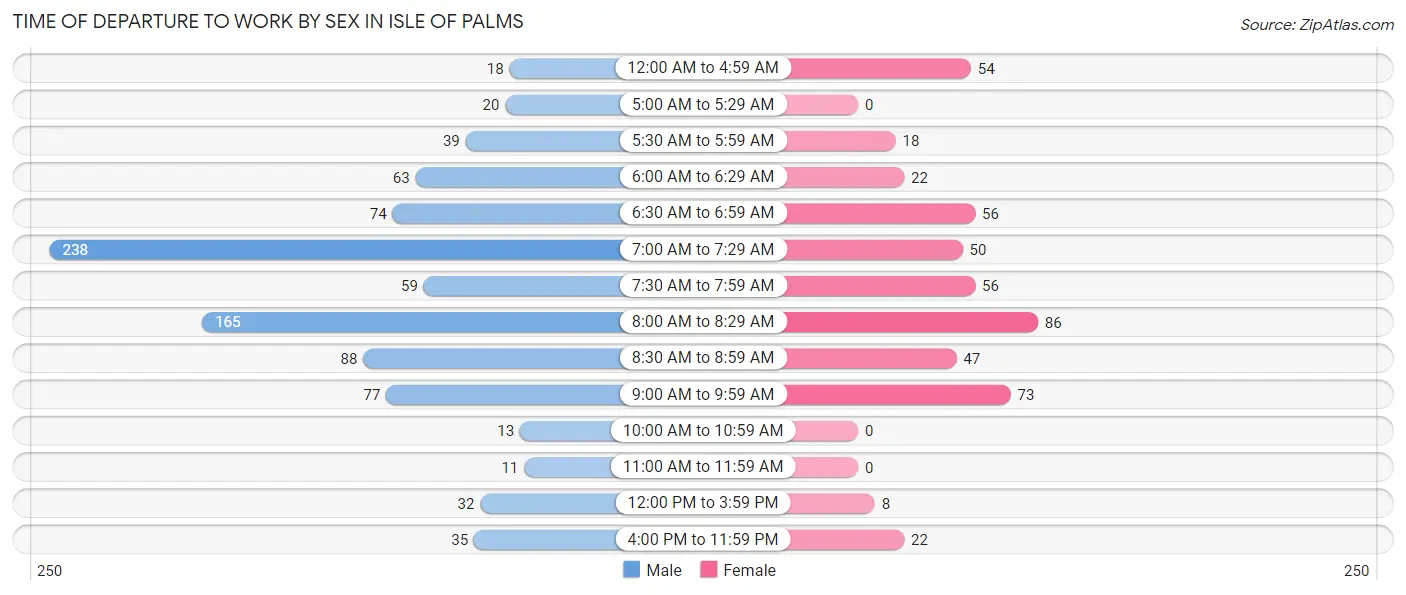
| Time of Departure | Male | Female |
| 12:00 AM to 4:59 AM | 18 (1.9%) | 54 (11.0%) |
| 5:00 AM to 5:29 AM | 20 (2.1%) | 0 (0.0%) |
| 5:30 AM to 5:59 AM | 39 (4.2%) | 18 (3.7%) |
| 6:00 AM to 6:29 AM | 63 (6.8%) | 22 (4.5%) |
| 6:30 AM to 6:59 AM | 74 (7.9%) | 56 (11.4%) |
| 7:00 AM to 7:29 AM | 238 (25.5%) | 50 (10.2%) |
| 7:30 AM to 7:59 AM | 59 (6.3%) | 56 (11.4%) |
| 8:00 AM to 8:29 AM | 165 (17.7%) | 86 (17.5%) |
| 8:30 AM to 8:59 AM | 88 (9.4%) | 47 (9.6%) |
| 9:00 AM to 9:59 AM | 77 (8.3%) | 73 (14.8%) |
| 10:00 AM to 10:59 AM | 13 (1.4%) | 0 (0.0%) |
| 11:00 AM to 11:59 AM | 11 (1.2%) | 0 (0.0%) |
| 12:00 PM to 3:59 PM | 32 (3.4%) | 8 (1.6%) |
| 4:00 PM to 11:59 PM | 35 (3.8%) | 22 (4.5%) |
| Total | 932 (100.0%) | 492 (100.0%) |
Housing Occupancy in Isle Of Palms
Occupancy by Ownership in Isle Of Palms
Of the total 1,948 dwellings in Isle Of Palms, owner-occupied units account for 1,754 (90.0%), while renter-occupied units make up 194 (10.0%).
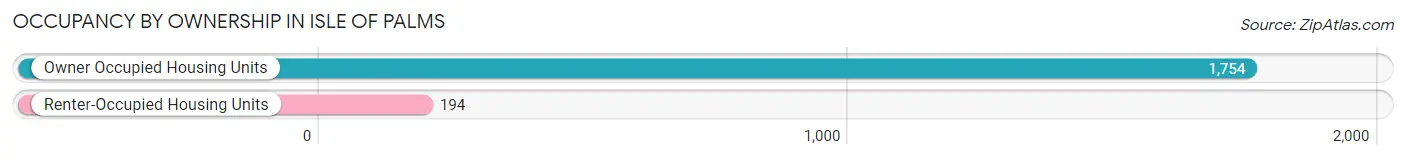
| Occupancy | # Housing Units | % Housing Units |
| Owner Occupied Housing Units | 1,754 | 90.0% |
| Renter-Occupied Housing Units | 194 | 10.0% |
| Total Occupied Housing Units | 1,948 | 100.0% |
Occupancy by Household Size in Isle Of Palms
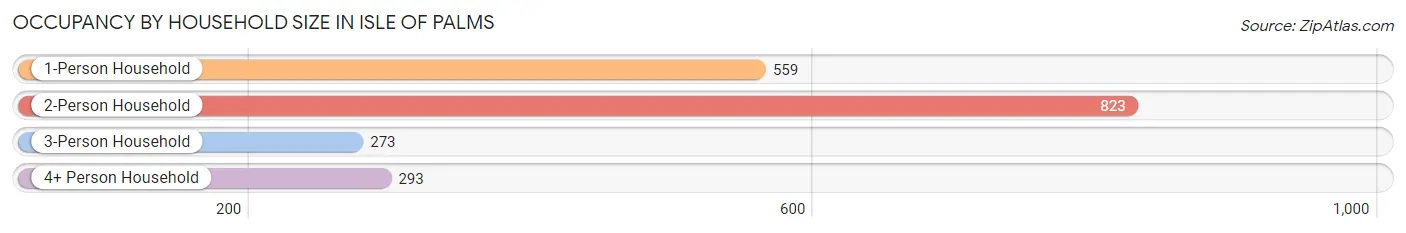
| Household Size | # Housing Units | % Housing Units |
| 1-Person Household | 559 | 28.7% |
| 2-Person Household | 823 | 42.2% |
| 3-Person Household | 273 | 14.0% |
| 4+ Person Household | 293 | 15.0% |
| Total Housing Units | 1,948 | 100.0% |
Occupancy by Ownership by Household Size in Isle Of Palms
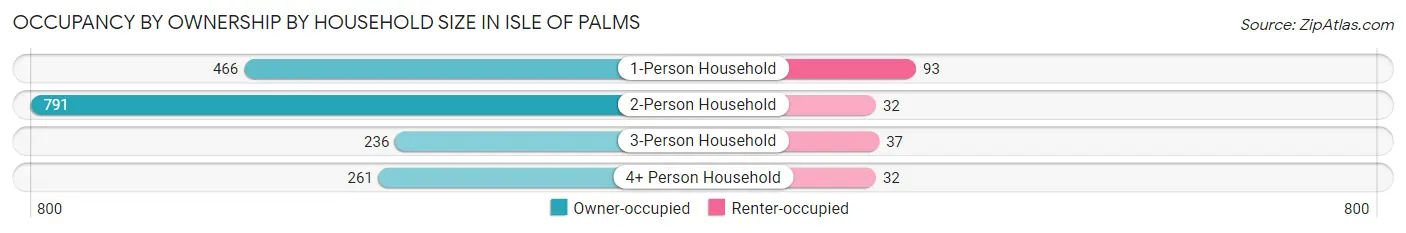
| Household Size | Owner-occupied | Renter-occupied |
| 1-Person Household | 466 (83.4%) | 93 (16.6%) |
| 2-Person Household | 791 (96.1%) | 32 (3.9%) |
| 3-Person Household | 236 (86.5%) | 37 (13.6%) |
| 4+ Person Household | 261 (89.1%) | 32 (10.9%) |
| Total Housing Units | 1,754 (90.0%) | 194 (10.0%) |
Occupancy by Educational Attainment in Isle Of Palms
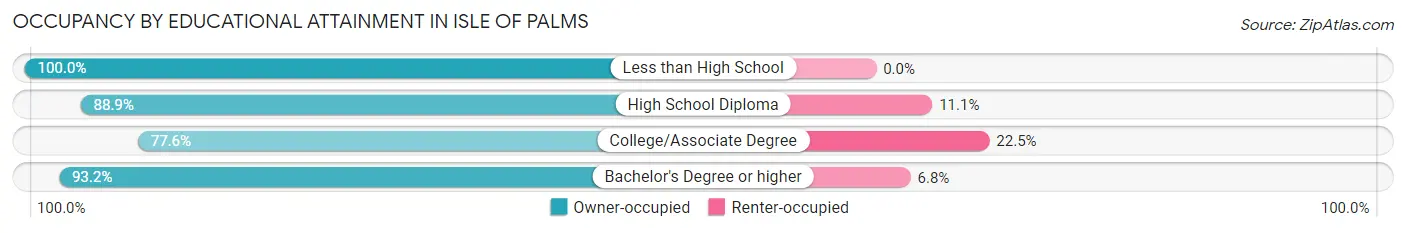
| Household Size | Owner-occupied | Renter-occupied |
| Less than High School | 9 (100.0%) | 0 (0.0%) |
| High School Diploma | 40 (88.9%) | 5 (11.1%) |
| College/Associate Degree | 297 (77.5%) | 86 (22.5%) |
| Bachelor's Degree or higher | 1,408 (93.2%) | 103 (6.8%) |
Occupancy by Age of Householder in Isle Of Palms
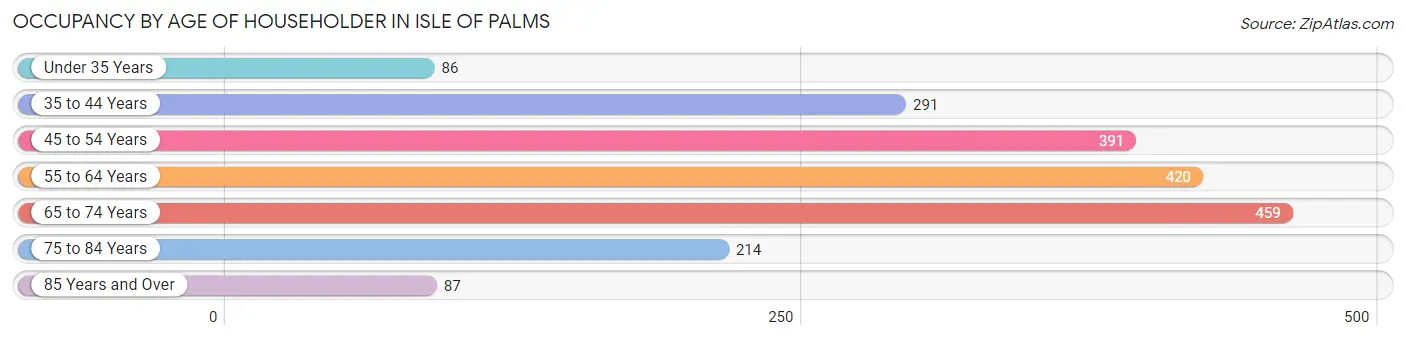
| Age Bracket | # Households | % Households |
| Under 35 Years | 86 | 4.4% |
| 35 to 44 Years | 291 | 14.9% |
| 45 to 54 Years | 391 | 20.1% |
| 55 to 64 Years | 420 | 21.6% |
| 65 to 74 Years | 459 | 23.6% |
| 75 to 84 Years | 214 | 11.0% |
| 85 Years and Over | 87 | 4.5% |
| Total | 1,948 | 100.0% |
Housing Finances in Isle Of Palms
Median Income by Occupancy in Isle Of Palms
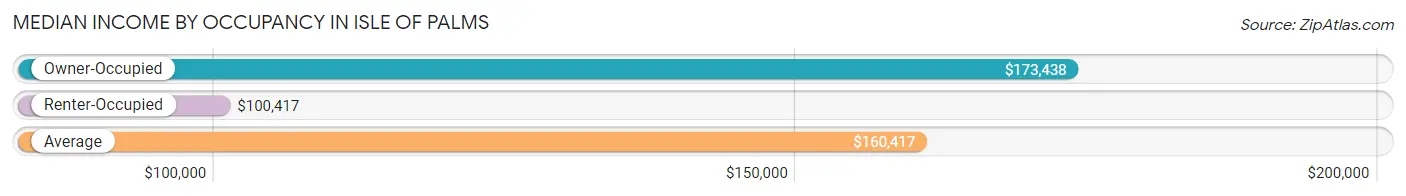
| Occupancy Type | # Households | Median Income |
| Owner-Occupied | 1,754 (90.0%) | $173,438 |
| Renter-Occupied | 194 (10.0%) | $100,417 |
| Average | 1,948 (100.0%) | $160,417 |
Occupancy by Householder Income Bracket in Isle Of Palms
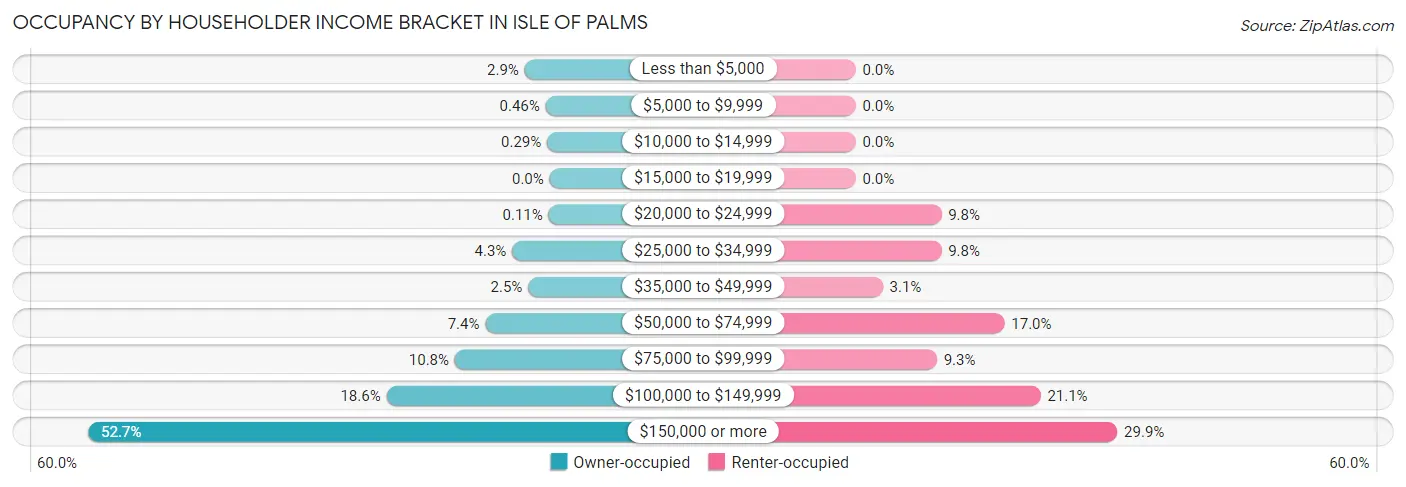
| Income Bracket | Owner-occupied | Renter-occupied |
| Less than $5,000 | 50 (2.9%) | 0 (0.0%) |
| $5,000 to $9,999 | 8 (0.5%) | 0 (0.0%) |
| $10,000 to $14,999 | 5 (0.3%) | 0 (0.0%) |
| $15,000 to $19,999 | 0 (0.0%) | 0 (0.0%) |
| $20,000 to $24,999 | 2 (0.1%) | 19 (9.8%) |
| $25,000 to $34,999 | 75 (4.3%) | 19 (9.8%) |
| $35,000 to $49,999 | 43 (2.5%) | 6 (3.1%) |
| $50,000 to $74,999 | 129 (7.3%) | 33 (17.0%) |
| $75,000 to $99,999 | 190 (10.8%) | 18 (9.3%) |
| $100,000 to $149,999 | 327 (18.6%) | 41 (21.1%) |
| $150,000 or more | 925 (52.7%) | 58 (29.9%) |
| Total | 1,754 (100.0%) | 194 (100.0%) |
Monthly Housing Cost Tiers in Isle Of Palms
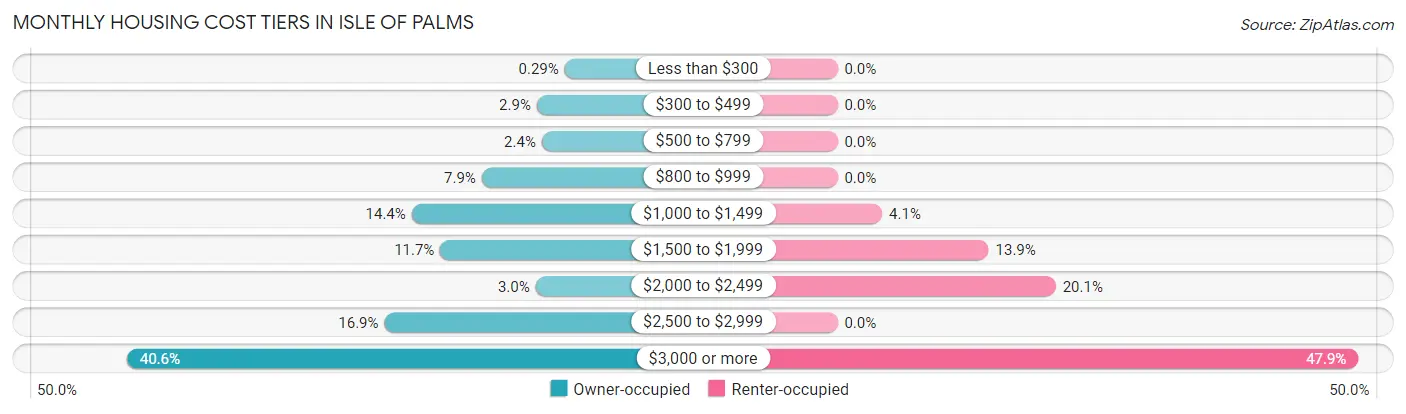
| Monthly Cost | Owner-occupied | Renter-occupied |
| Less than $300 | 5 (0.3%) | 0 (0.0%) |
| $300 to $499 | 50 (2.9%) | 0 (0.0%) |
| $500 to $799 | 42 (2.4%) | 0 (0.0%) |
| $800 to $999 | 139 (7.9%) | 0 (0.0%) |
| $1,000 to $1,499 | 252 (14.4%) | 8 (4.1%) |
| $1,500 to $1,999 | 206 (11.7%) | 27 (13.9%) |
| $2,000 to $2,499 | 52 (3.0%) | 39 (20.1%) |
| $2,500 to $2,999 | 296 (16.9%) | 0 (0.0%) |
| $3,000 or more | 712 (40.6%) | 93 (47.9%) |
| Total | 1,754 (100.0%) | 194 (100.0%) |
Physical Housing Characteristics in Isle Of Palms
Housing Structures in Isle Of Palms
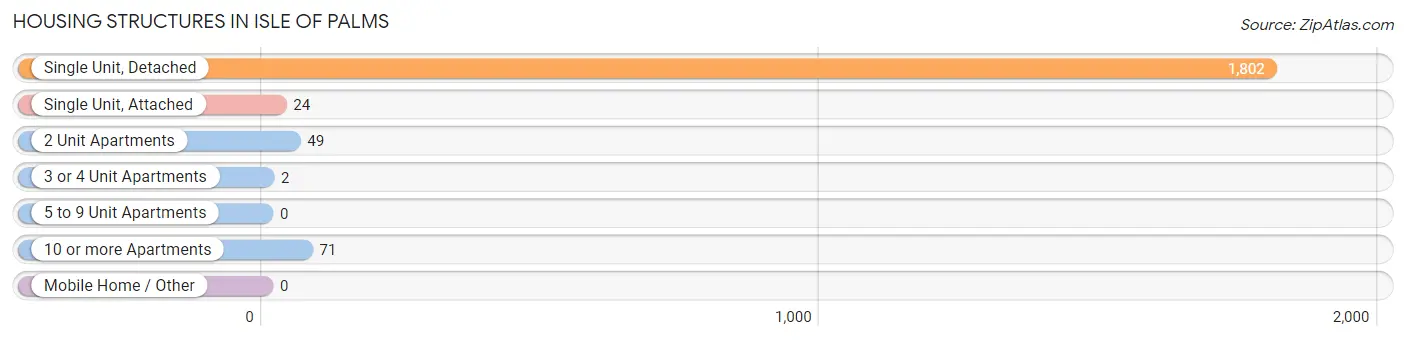
| Structure Type | # Housing Units | % Housing Units |
| Single Unit, Detached | 1,802 | 92.5% |
| Single Unit, Attached | 24 | 1.2% |
| 2 Unit Apartments | 49 | 2.5% |
| 3 or 4 Unit Apartments | 2 | 0.1% |
| 5 to 9 Unit Apartments | 0 | 0.0% |
| 10 or more Apartments | 71 | 3.6% |
| Mobile Home / Other | 0 | 0.0% |
| Total | 1,948 | 100.0% |
Housing Structures by Occupancy in Isle Of Palms
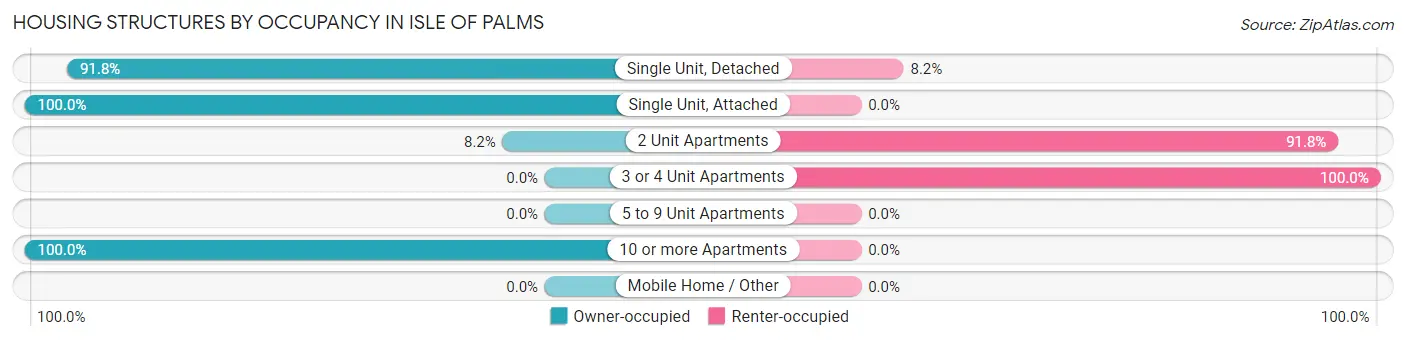
| Structure Type | Owner-occupied | Renter-occupied |
| Single Unit, Detached | 1,655 (91.8%) | 147 (8.2%) |
| Single Unit, Attached | 24 (100.0%) | 0 (0.0%) |
| 2 Unit Apartments | 4 (8.2%) | 45 (91.8%) |
| 3 or 4 Unit Apartments | 0 (0.0%) | 2 (100.0%) |
| 5 to 9 Unit Apartments | 0 (0.0%) | 0 (0.0%) |
| 10 or more Apartments | 71 (100.0%) | 0 (0.0%) |
| Mobile Home / Other | 0 (0.0%) | 0 (0.0%) |
| Total | 1,754 (90.0%) | 194 (10.0%) |
Housing Structures by Number of Rooms in Isle Of Palms
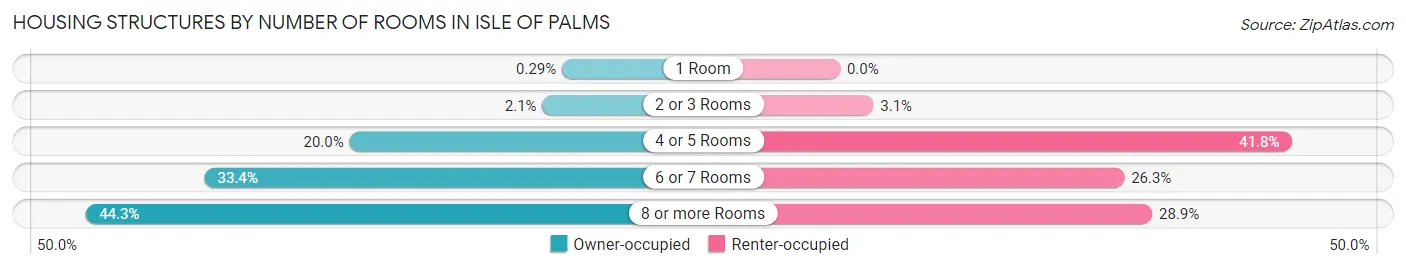
| Number of Rooms | Owner-occupied | Renter-occupied |
| 1 Room | 5 (0.3%) | 0 (0.0%) |
| 2 or 3 Rooms | 37 (2.1%) | 6 (3.1%) |
| 4 or 5 Rooms | 350 (20.0%) | 81 (41.7%) |
| 6 or 7 Rooms | 585 (33.4%) | 51 (26.3%) |
| 8 or more Rooms | 777 (44.3%) | 56 (28.9%) |
| Total | 1,754 (100.0%) | 194 (100.0%) |
Housing Structure by Heating Type in Isle Of Palms
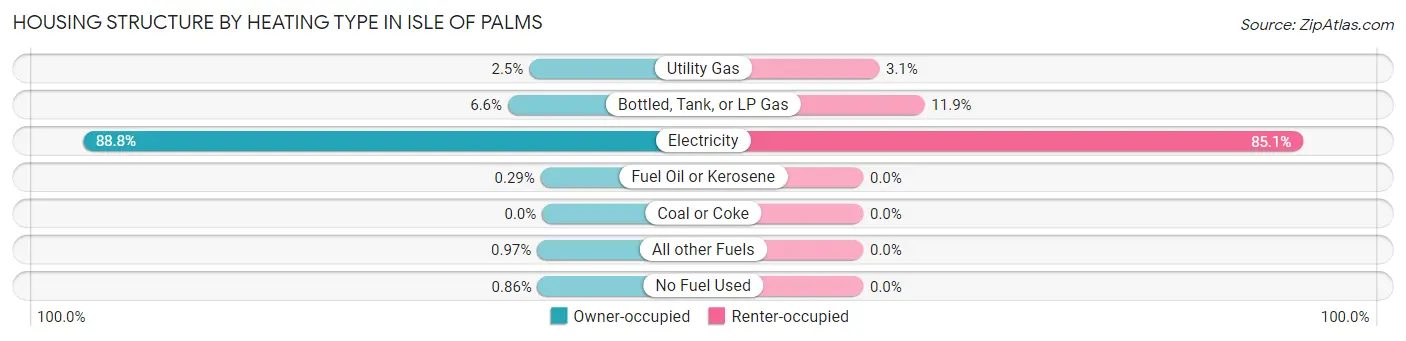
| Heating Type | Owner-occupied | Renter-occupied |
| Utility Gas | 44 (2.5%) | 6 (3.1%) |
| Bottled, Tank, or LP Gas | 116 (6.6%) | 23 (11.9%) |
| Electricity | 1,557 (88.8%) | 165 (85.1%) |
| Fuel Oil or Kerosene | 5 (0.3%) | 0 (0.0%) |
| Coal or Coke | 0 (0.0%) | 0 (0.0%) |
| All other Fuels | 17 (1.0%) | 0 (0.0%) |
| No Fuel Used | 15 (0.9%) | 0 (0.0%) |
| Total | 1,754 (100.0%) | 194 (100.0%) |
Household Vehicle Usage in Isle Of Palms
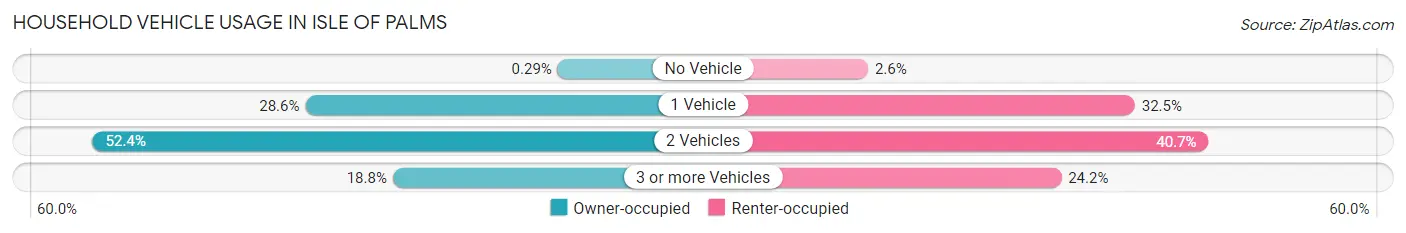
| Vehicles per Household | Owner-occupied | Renter-occupied |
| No Vehicle | 5 (0.3%) | 5 (2.6%) |
| 1 Vehicle | 501 (28.6%) | 63 (32.5%) |
| 2 Vehicles | 919 (52.4%) | 79 (40.7%) |
| 3 or more Vehicles | 329 (18.8%) | 47 (24.2%) |
| Total | 1,754 (100.0%) | 194 (100.0%) |
Real Estate & Mortgages in Isle Of Palms
Real Estate and Mortgage Overview in Isle Of Palms
| Characteristic | Without Mortgage | With Mortgage |
| Housing Units | 641 | 1,113 |
| Median Property Value | $1,440,800 | $930,700 |
| Median Household Income | $139,625 | $635 |
| Monthly Housing Costs | $1,194 | $670 |
| Real Estate Taxes | $4,207 | $18 |
Property Value by Mortgage Status in Isle Of Palms
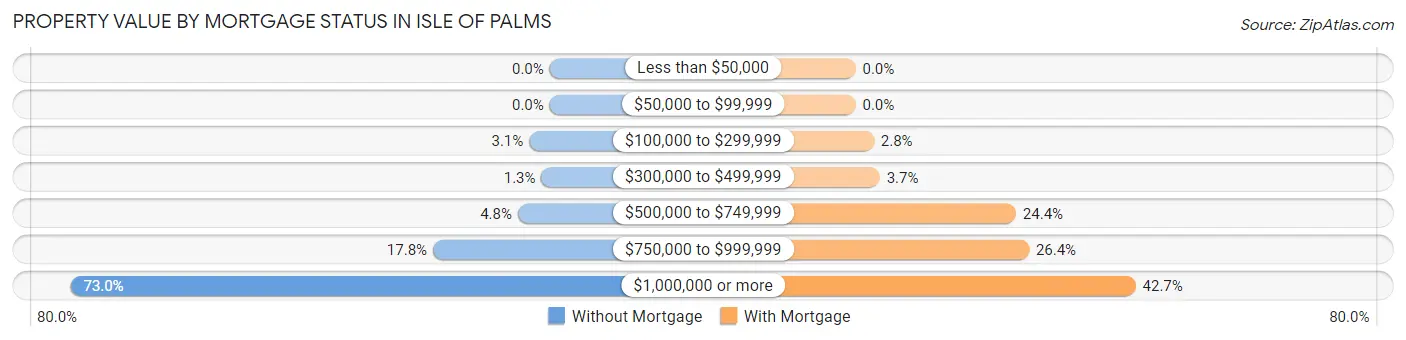
| Property Value | Without Mortgage | With Mortgage |
| Less than $50,000 | 0 (0.0%) | 0 (0.0%) |
| $50,000 to $99,999 | 0 (0.0%) | 0 (0.0%) |
| $100,000 to $299,999 | 20 (3.1%) | 31 (2.8%) |
| $300,000 to $499,999 | 8 (1.3%) | 41 (3.7%) |
| $500,000 to $749,999 | 31 (4.8%) | 272 (24.4%) |
| $750,000 to $999,999 | 114 (17.8%) | 294 (26.4%) |
| $1,000,000 or more | 468 (73.0%) | 475 (42.7%) |
| Total | 641 (100.0%) | 1,113 (100.0%) |
Household Income by Mortgage Status in Isle Of Palms
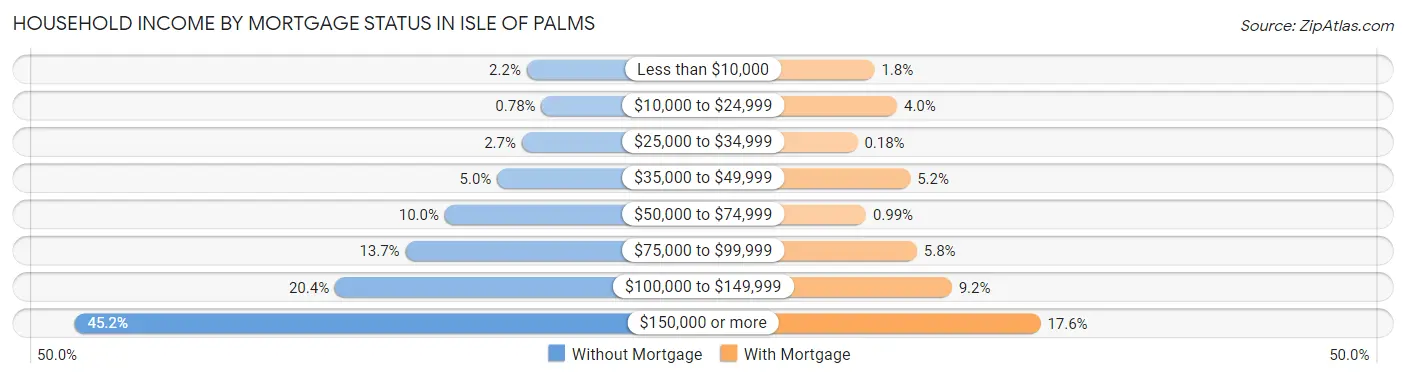
| Household Income | Without Mortgage | With Mortgage |
| Less than $10,000 | 14 (2.2%) | 20 (1.8%) |
| $10,000 to $24,999 | 5 (0.8%) | 44 (4.0%) |
| $25,000 to $34,999 | 17 (2.6%) | 2 (0.2%) |
| $35,000 to $49,999 | 32 (5.0%) | 58 (5.2%) |
| $50,000 to $74,999 | 64 (10.0%) | 11 (1.0%) |
| $75,000 to $99,999 | 88 (13.7%) | 65 (5.8%) |
| $100,000 to $149,999 | 131 (20.4%) | 102 (9.2%) |
| $150,000 or more | 290 (45.2%) | 196 (17.6%) |
| Total | 641 (100.0%) | 1,113 (100.0%) |
Property Value to Household Income Ratio in Isle Of Palms
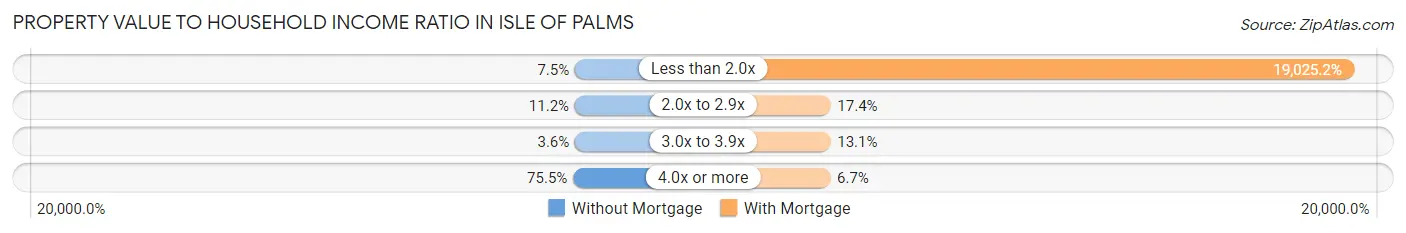
| Value-to-Income Ratio | Without Mortgage | With Mortgage |
| Less than 2.0x | 48 (7.5%) | 211,750 (19,025.2%) |
| 2.0x to 2.9x | 72 (11.2%) | 194 (17.4%) |
| 3.0x to 3.9x | 23 (3.6%) | 146 (13.1%) |
| 4.0x or more | 484 (75.5%) | 75 (6.7%) |
| Total | 641 (100.0%) | 1,113 (100.0%) |
Real Estate Taxes by Mortgage Status in Isle Of Palms
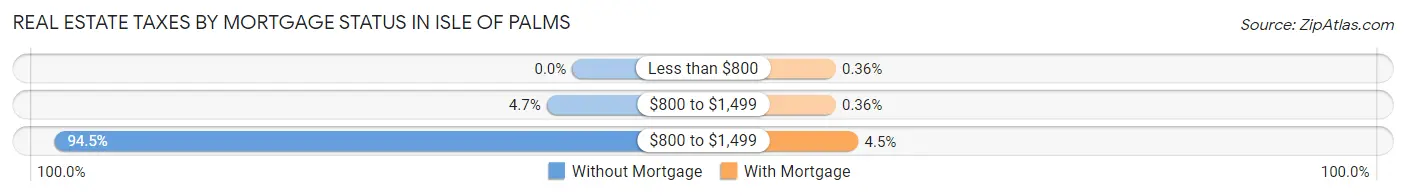
| Property Taxes | Without Mortgage | With Mortgage |
| Less than $800 | 0 (0.0%) | 4 (0.4%) |
| $800 to $1,499 | 30 (4.7%) | 4 (0.4%) |
| $800 to $1,499 | 606 (94.5%) | 50 (4.5%) |
| Total | 641 (100.0%) | 1,113 (100.0%) |
Health & Disability in Isle Of Palms
Health Insurance Coverage by Age in Isle Of Palms
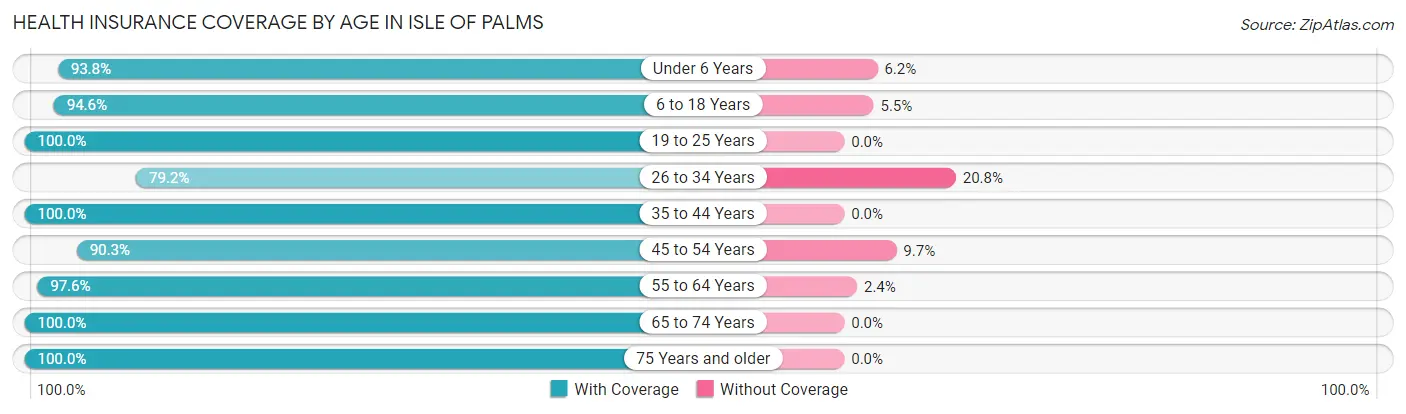
| Age Bracket | With Coverage | Without Coverage |
| Under 6 Years | 197 (93.8%) | 13 (6.2%) |
| 6 to 18 Years | 503 (94.6%) | 29 (5.4%) |
| 19 to 25 Years | 103 (100.0%) | 0 (0.0%) |
| 26 to 34 Years | 198 (79.2%) | 52 (20.8%) |
| 35 to 44 Years | 546 (100.0%) | 0 (0.0%) |
| 45 to 54 Years | 650 (90.3%) | 70 (9.7%) |
| 55 to 64 Years | 655 (97.6%) | 16 (2.4%) |
| 65 to 74 Years | 847 (100.0%) | 0 (0.0%) |
| 75 Years and older | 468 (100.0%) | 0 (0.0%) |
| Total | 4,167 (95.9%) | 180 (4.1%) |
Health Insurance Coverage by Citizenship Status in Isle Of Palms
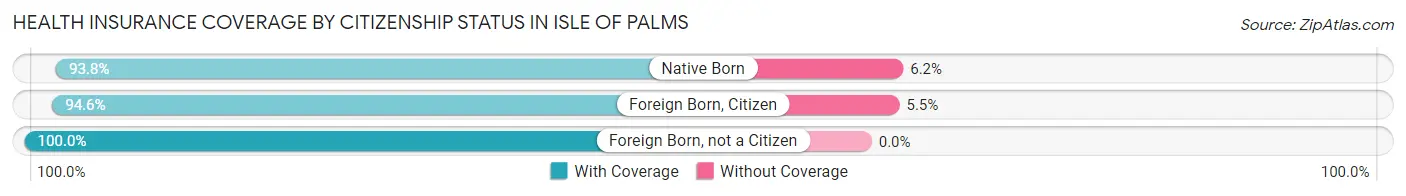
| Citizenship Status | With Coverage | Without Coverage |
| Native Born | 197 (93.8%) | 13 (6.2%) |
| Foreign Born, Citizen | 503 (94.6%) | 29 (5.4%) |
| Foreign Born, not a Citizen | 103 (100.0%) | 0 (0.0%) |
Health Insurance Coverage by Household Income in Isle Of Palms
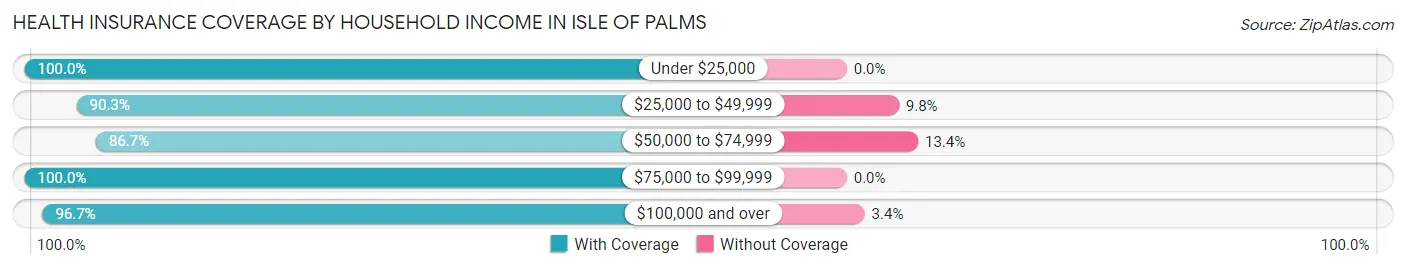
| Household Income | With Coverage | Without Coverage |
| Under $25,000 | 107 (100.0%) | 0 (0.0%) |
| $25,000 to $49,999 | 213 (90.2%) | 23 (9.8%) |
| $50,000 to $74,999 | 318 (86.7%) | 49 (13.4%) |
| $75,000 to $99,999 | 414 (100.0%) | 0 (0.0%) |
| $100,000 and over | 3,115 (96.7%) | 108 (3.4%) |
Public vs Private Health Insurance Coverage by Age in Isle Of Palms
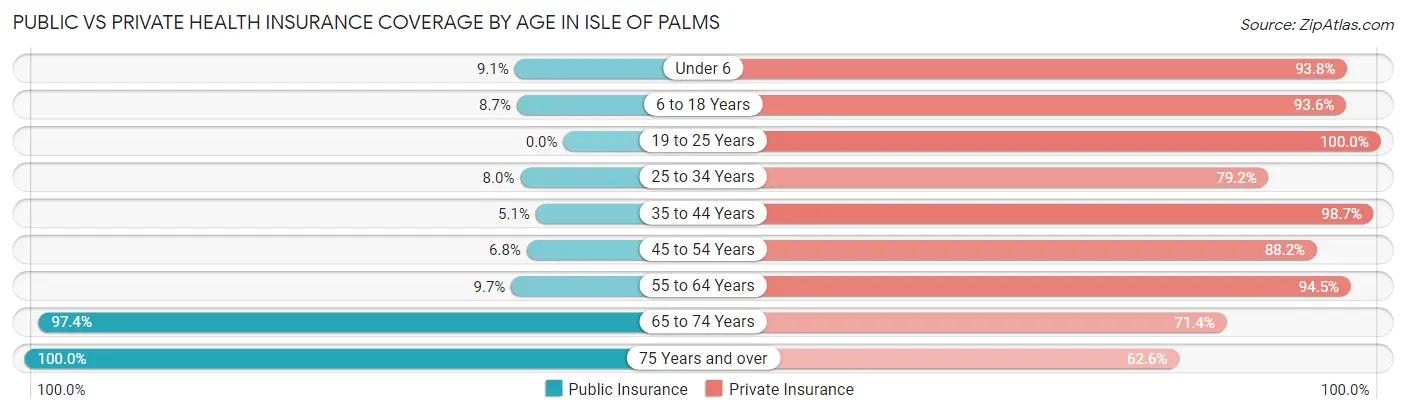
| Age Bracket | Public Insurance | Private Insurance |
| Under 6 | 19 (9.0%) | 197 (93.8%) |
| 6 to 18 Years | 46 (8.6%) | 498 (93.6%) |
| 19 to 25 Years | 0 (0.0%) | 103 (100.0%) |
| 25 to 34 Years | 20 (8.0%) | 198 (79.2%) |
| 35 to 44 Years | 28 (5.1%) | 539 (98.7%) |
| 45 to 54 Years | 49 (6.8%) | 635 (88.2%) |
| 55 to 64 Years | 65 (9.7%) | 634 (94.5%) |
| 65 to 74 Years | 825 (97.4%) | 605 (71.4%) |
| 75 Years and over | 468 (100.0%) | 293 (62.6%) |
| Total | 1,520 (35.0%) | 3,702 (85.2%) |
Disability Status by Sex by Age in Isle Of Palms
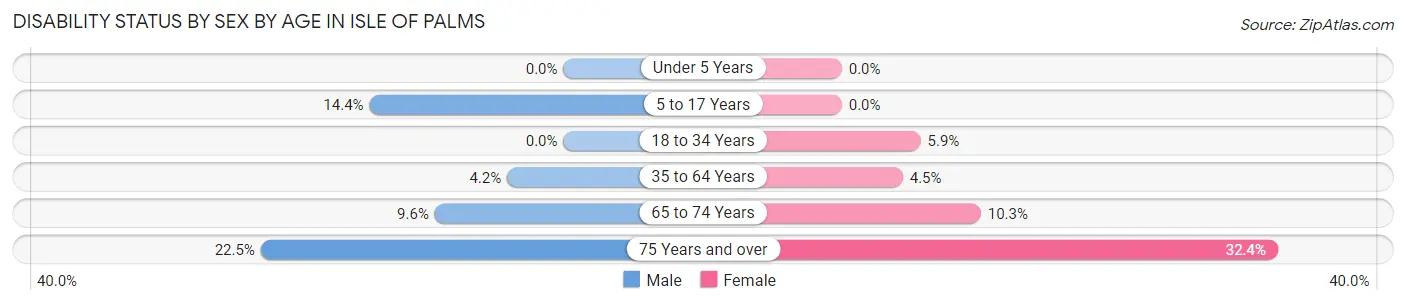
| Age Bracket | Male | Female |
| Under 5 Years | 0 (0.0%) | 0 (0.0%) |
| 5 to 17 Years | 37 (14.4%) | 0 (0.0%) |
| 18 to 34 Years | 0 (0.0%) | 11 (5.9%) |
| 35 to 64 Years | 45 (4.2%) | 39 (4.5%) |
| 65 to 74 Years | 42 (9.6%) | 42 (10.3%) |
| 75 Years and over | 51 (22.5%) | 78 (32.4%) |
Disability Class by Sex by Age in Isle Of Palms
Disability Class: Hearing Difficulty
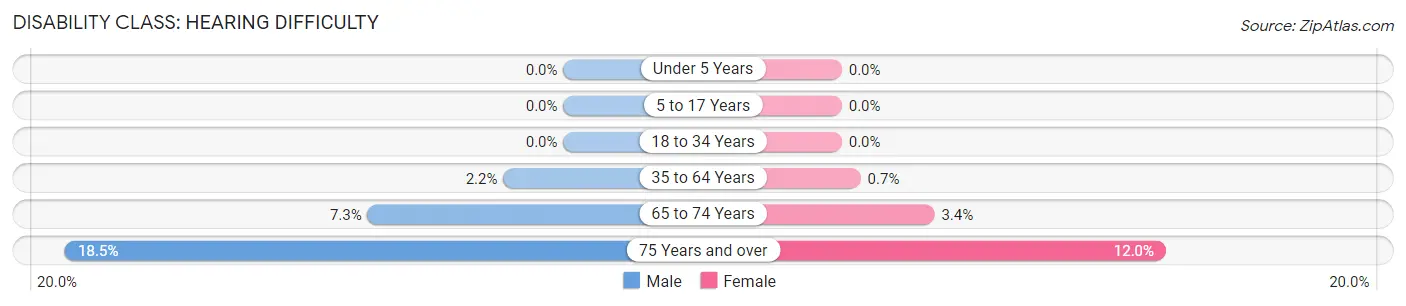
| Age Bracket | Male | Female |
| Under 5 Years | 0 (0.0%) | 0 (0.0%) |
| 5 to 17 Years | 0 (0.0%) | 0 (0.0%) |
| 18 to 34 Years | 0 (0.0%) | 0 (0.0%) |
| 35 to 64 Years | 24 (2.2%) | 6 (0.7%) |
| 65 to 74 Years | 32 (7.3%) | 14 (3.4%) |
| 75 Years and over | 42 (18.5%) | 29 (12.0%) |
Disability Class: Vision Difficulty
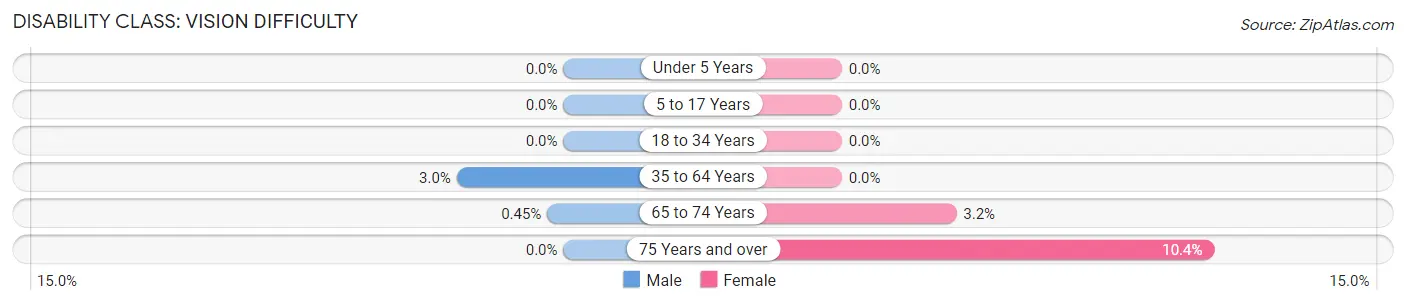
| Age Bracket | Male | Female |
| Under 5 Years | 0 (0.0%) | 0 (0.0%) |
| 5 to 17 Years | 0 (0.0%) | 0 (0.0%) |
| 18 to 34 Years | 0 (0.0%) | 0 (0.0%) |
| 35 to 64 Years | 32 (3.0%) | 0 (0.0%) |
| 65 to 74 Years | 2 (0.4%) | 13 (3.2%) |
| 75 Years and over | 0 (0.0%) | 25 (10.4%) |
Disability Class: Cognitive Difficulty
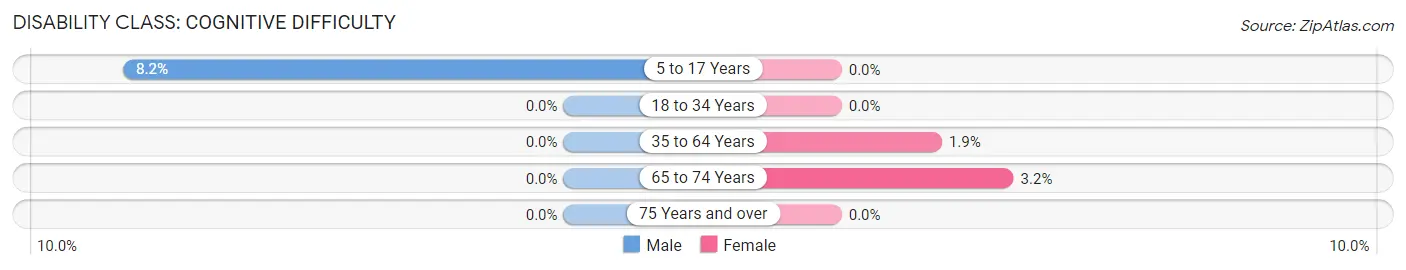
| Age Bracket | Male | Female |
| 5 to 17 Years | 21 (8.2%) | 0 (0.0%) |
| 18 to 34 Years | 0 (0.0%) | 0 (0.0%) |
| 35 to 64 Years | 0 (0.0%) | 16 (1.9%) |
| 65 to 74 Years | 0 (0.0%) | 13 (3.2%) |
| 75 Years and over | 0 (0.0%) | 0 (0.0%) |
Disability Class: Ambulatory Difficulty
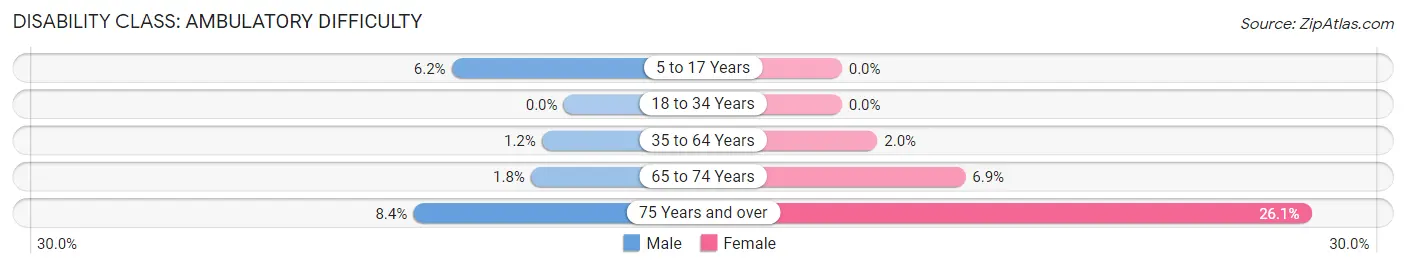
| Age Bracket | Male | Female |
| 5 to 17 Years | 16 (6.2%) | 0 (0.0%) |
| 18 to 34 Years | 0 (0.0%) | 0 (0.0%) |
| 35 to 64 Years | 13 (1.2%) | 17 (2.0%) |
| 65 to 74 Years | 8 (1.8%) | 28 (6.9%) |
| 75 Years and over | 19 (8.4%) | 63 (26.1%) |
Disability Class: Self-Care Difficulty
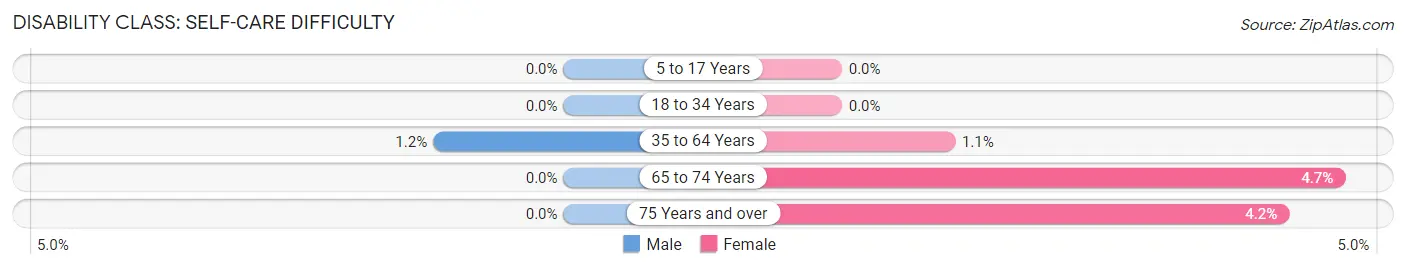
| Age Bracket | Male | Female |
| 5 to 17 Years | 0 (0.0%) | 0 (0.0%) |
| 18 to 34 Years | 0 (0.0%) | 0 (0.0%) |
| 35 to 64 Years | 13 (1.2%) | 9 (1.1%) |
| 65 to 74 Years | 0 (0.0%) | 19 (4.7%) |
| 75 Years and over | 0 (0.0%) | 10 (4.2%) |
Technology Access in Isle Of Palms
Computing Device Access in Isle Of Palms
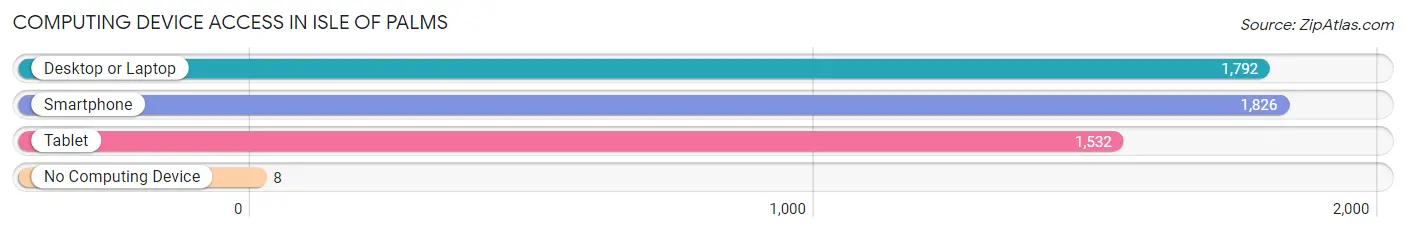
| Device Type | # Households | % Households |
| Desktop or Laptop | 1,792 | 92.0% |
| Smartphone | 1,826 | 93.7% |
| Tablet | 1,532 | 78.6% |
| No Computing Device | 8 | 0.4% |
| Total | 1,948 | 100.0% |
Internet Access in Isle Of Palms
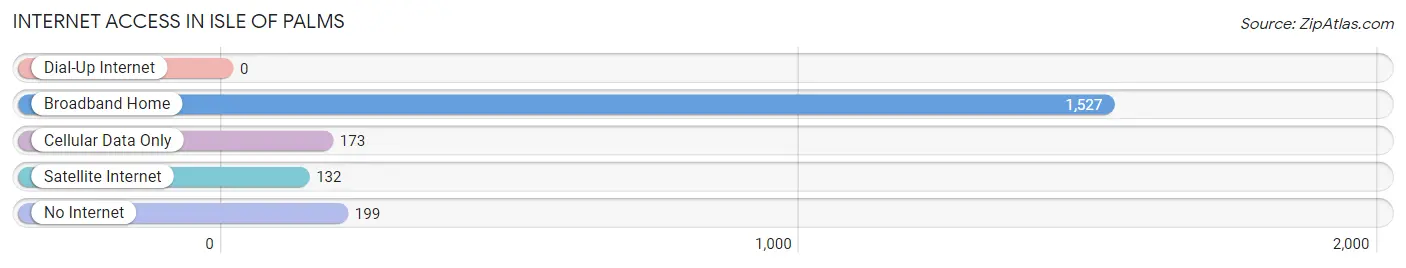
| Internet Type | # Households | % Households |
| Dial-Up Internet | 0 | 0.0% |
| Broadband Home | 1,527 | 78.4% |
| Cellular Data Only | 173 | 8.9% |
| Satellite Internet | 132 | 6.8% |
| No Internet | 199 | 10.2% |
| Total | 1,948 | 100.0% |
Isle Of Palms Summary
Isle of Palms is a city located in Charleston County, South Carolina, United States. It is a barrier island on the Atlantic Ocean, separated from the mainland by the Intracoastal Waterway. The city is part of the Charleston-North Charleston-Summerville metropolitan area. As of the 2010 census, the population of Isle of Palms was 4,133.
History
The Isle of Palms was originally inhabited by the Sewee Indians, who were part of the larger Cusabo tribe. The first European settlers arrived in the area in the late 1600s, and the island was granted to Captain John Gibbes in 1696. The island was used primarily for farming and fishing until the early 1900s, when it began to be developed as a resort destination. The first hotel was built in 1901, and the island was incorporated as a town in 1945.
Geography
Isle of Palms is located at 32°45'25" North, 79°45'25" West (32.756944, -79.756944). The city is situated on a barrier island, separated from the mainland by the Intracoastal Waterway. The island is approximately 8 miles long and 1 mile wide, and is bordered by the Atlantic Ocean to the east and the Intracoastal Waterway to the west.
The city has a total area of 4.2 square miles, of which 3.9 square miles is land and 0.3 square miles is water. The terrain is mostly flat, with some areas of marshland.
Economy
The economy of Isle of Palms is largely based on tourism. The city is a popular destination for beachgoers, and is home to several resorts and hotels. The city also has a number of restaurants, bars, and shops catering to tourists.
The city is also home to a number of businesses, including a marina, a golf course, and a number of real estate and construction companies.
Demographics
As of the 2010 census, there were 4,133 people, 1,945 households, and 1,093 families residing in the city. The population density was 1,062.2 people per square mile. The racial makeup of the city was 94.2% White, 2.7% African American, 0.3% Native American, 0.9% Asian, 0.1% Pacific Islander, 0.7% from other races, and 1.1% from two or more races. Hispanic or Latino of any race were 2.3% of the population.
The median income for a household in the city was $68,958, and the median income for a family was $87,813. The per capita income for the city was $45,945. About 4.2% of families and 6.3% of the population were below the poverty line, including 8.2% of those under age 18 and 4.2% of those age 65 or over.
Common Questions
What is Per Capita Income in Isle Of Palms?
Per Capita income in Isle Of Palms is $119,429.
What is the Median Family Income in Isle Of Palms?
Median Family Income in Isle Of Palms is $215,882.
What is the Median Household income in Isle Of Palms?
Median Household Income in Isle Of Palms is $160,417.
What is Income or Wage Gap in Isle Of Palms?
Income or Wage Gap in Isle Of Palms is 56.5%.
Women in Isle Of Palms earn 43.5 cents for every dollar earned by a man.
What is Family Income Deficit in Isle Of Palms?
Family Income Deficit in Isle Of Palms is $12,944.
Families that are below poverty line in Isle Of Palms earn $12,944 less on average than the poverty threshold level.
What is Inequality or Gini Index in Isle Of Palms?
Inequality or Gini Index in Isle Of Palms is 0.50.
What is the Total Population of Isle Of Palms?
Total Population of Isle Of Palms is 4,347.
What is the Total Male Population of Isle Of Palms?
Total Male Population of Isle Of Palms is 2,262.
What is the Total Female Population of Isle Of Palms?
Total Female Population of Isle Of Palms is 2,085.
What is the Ratio of Males per 100 Females in Isle Of Palms?
There are 108.49 Males per 100 Females in Isle Of Palms.
What is the Ratio of Females per 100 Males in Isle Of Palms?
There are 92.18 Females per 100 Males in Isle Of Palms.
What is the Median Population Age in Isle Of Palms?
Median Population Age in Isle Of Palms is 51.7 Years.
What is the Average Family Size in Isle Of Palms
Average Family Size in Isle Of Palms is 2.7 People.
What is the Average Household Size in Isle Of Palms
Average Household Size in Isle Of Palms is 2.2 People.
How Large is the Labor Force in Isle Of Palms?
There are 1,917 People in the Labor Forcein in Isle Of Palms.
What is the Percentage of People in the Labor Force in Isle Of Palms?
52.1% of People are in the Labor Force in Isle Of Palms.
What is the Unemployment Rate in Isle Of Palms?
Unemployment Rate in Isle Of Palms is 0.7%.