Stateline, NV Map & Demographics
Stateline Map
Stateline Overview
$22,640
PER CAPITA INCOME
$51,696
AVG FAMILY INCOME
$41,830
AVG HOUSEHOLD INCOME
17.6%
WAGE / INCOME GAP [ % ]
82.4¢/ $1
WAGE / INCOME GAP [ $ ]
0.39
INEQUALITY / GINI INDEX
938
TOTAL POPULATION
627
MALE POPULATION
311
FEMALE POPULATION
201.61
MALES / 100 FEMALES
49.60
FEMALES / 100 MALES
33.3
MEDIAN AGE
3.2
AVG FAMILY SIZE
2.3
AVG HOUSEHOLD SIZE
550
LABOR FORCE [ PEOPLE ]
75.2%
PERCENT IN LABOR FORCE
2.0%
UNEMPLOYMENT RATE
Stateline Zip Codes
Income in Stateline
Income Overview in Stateline
Per Capita Income in Stateline is $22,640, while median incomes of families and households are $51,696 and $41,830 respectively.
| Characteristic | Number | Measure |
| Per Capita Income | 938 | $22,640 |
| Median Family Income | 204 | $51,696 |
| Mean Family Income | 204 | $62,547 |
| Median Household Income | 405 | $41,830 |
| Mean Household Income | 405 | $47,947 |
| Income Deficit | 204 | $0 |
| Wage / Income Gap (%) | 938 | 17.56% |
| Wage / Income Gap ($) | 938 | 82.44¢ per $1 |
| Gini / Inequality Index | 938 | 0.39 |
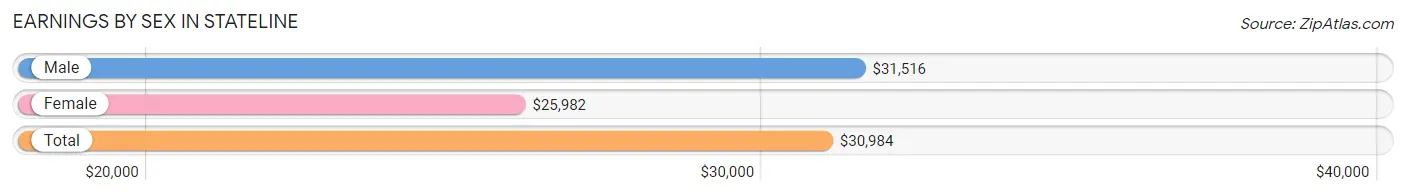
Earnings by Sex in Stateline
Average Earnings in Stateline are $30,984, $31,516 for men and $25,982 for women, a difference of 17.6%.
| Sex | Number | Average Earnings |
| Male | 445 (79.0%) | $31,516 |
| Female | 118 (21.0%) | $25,982 |
| Total | 563 (100.0%) | $30,984 |
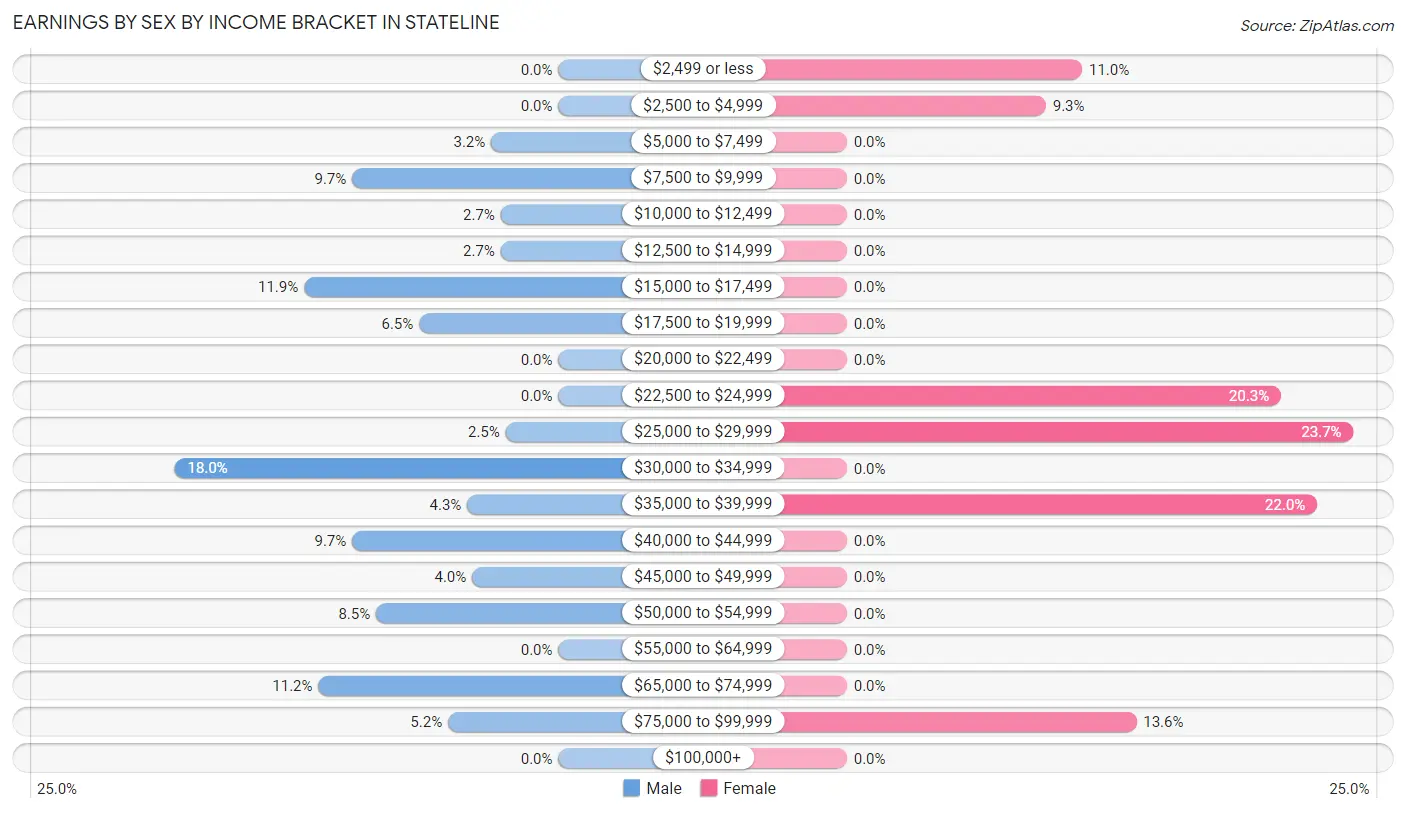
Earnings by Sex by Income Bracket in Stateline
The most common earnings brackets in Stateline are $30,000 to $34,999 for men (80 | 18.0%) and $25,000 to $29,999 for women (28 | 23.7%).
| Income | Male | Female |
| $2,499 or less | 0 (0.0%) | 13 (11.0%) |
| $2,500 to $4,999 | 0 (0.0%) | 11 (9.3%) |
| $5,000 to $7,499 | 14 (3.2%) | 0 (0.0%) |
| $7,500 to $9,999 | 43 (9.7%) | 0 (0.0%) |
| $10,000 to $12,499 | 12 (2.7%) | 0 (0.0%) |
| $12,500 to $14,999 | 12 (2.7%) | 0 (0.0%) |
| $15,000 to $17,499 | 53 (11.9%) | 0 (0.0%) |
| $17,500 to $19,999 | 29 (6.5%) | 0 (0.0%) |
| $20,000 to $22,499 | 0 (0.0%) | 0 (0.0%) |
| $22,500 to $24,999 | 0 (0.0%) | 24 (20.3%) |
| $25,000 to $29,999 | 11 (2.5%) | 28 (23.7%) |
| $30,000 to $34,999 | 80 (18.0%) | 0 (0.0%) |
| $35,000 to $39,999 | 19 (4.3%) | 26 (22.0%) |
| $40,000 to $44,999 | 43 (9.7%) | 0 (0.0%) |
| $45,000 to $49,999 | 18 (4.0%) | 0 (0.0%) |
| $50,000 to $54,999 | 38 (8.5%) | 0 (0.0%) |
| $55,000 to $64,999 | 0 (0.0%) | 0 (0.0%) |
| $65,000 to $74,999 | 50 (11.2%) | 0 (0.0%) |
| $75,000 to $99,999 | 23 (5.2%) | 16 (13.6%) |
| $100,000+ | 0 (0.0%) | 0 (0.0%) |
| Total | 445 (100.0%) | 118 (100.0%) |
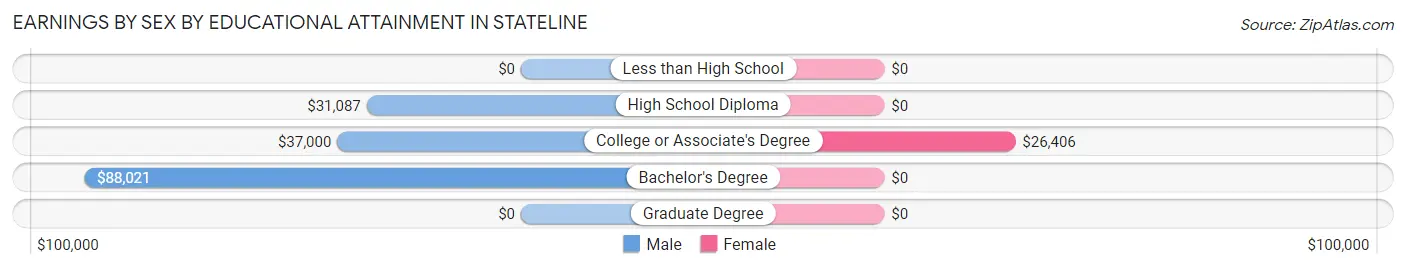
Earnings by Sex by Educational Attainment in Stateline
Average earnings in Stateline are $31,688 for men and $25,982 for women, a difference of 18.0%. Men with an educational attainment of bachelor's degree enjoy the highest average annual earnings of $88,021, while those with high school diploma education earn the least with $31,087. Women with an educational attainment of college or associate's degree earn the most with the average annual earnings of $26,406, while those with college or associate's degree education have the smallest earnings of $26,406.
| Educational Attainment | Male Income | Female Income |
| Less than High School | - | - |
| High School Diploma | $31,087 | $0 |
| College or Associate's Degree | $37,000 | $26,406 |
| Bachelor's Degree | $88,021 | $0 |
| Graduate Degree | - | - |
| Total | $31,688 | $25,982 |
Family Income in Stateline
Family Income Brackets in Stateline
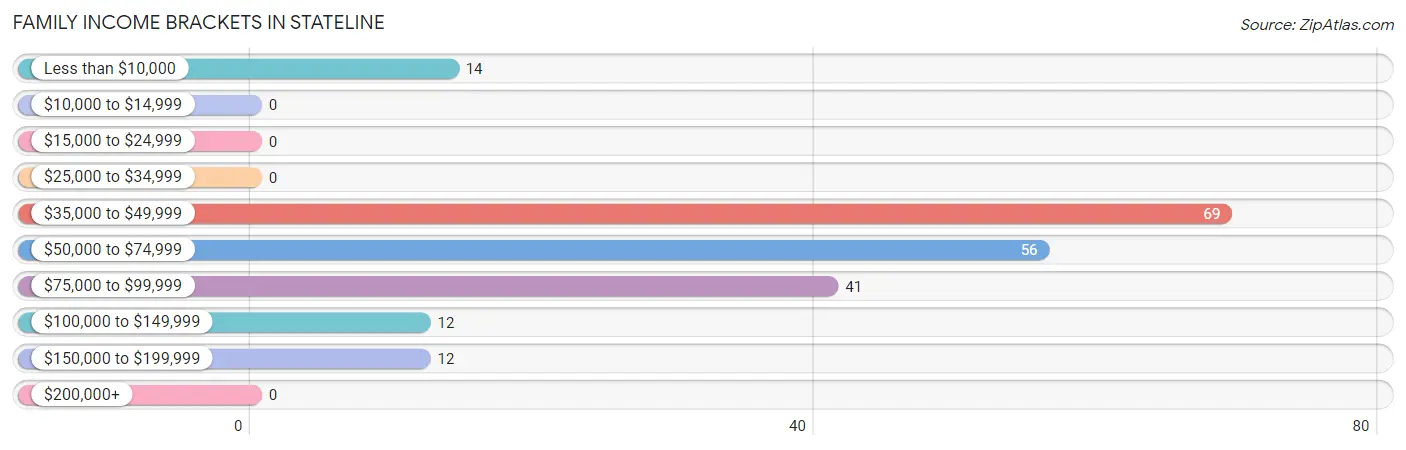
According to the Stateline family income data, there are 69 families falling into the $35,000 to $49,999 income range, which is the most common income bracket and makes up 33.8% of all families.
| Income Bracket | # Families | % Families |
| Less than $10,000 | 14 | 6.9% |
| $10,000 to $14,999 | 0 | 0.0% |
| $15,000 to $24,999 | 0 | 0.0% |
| $25,000 to $34,999 | 0 | 0.0% |
| $35,000 to $49,999 | 69 | 33.8% |
| $50,000 to $74,999 | 56 | 27.5% |
| $75,000 to $99,999 | 41 | 20.1% |
| $100,000 to $149,999 | 12 | 5.9% |
| $150,000 to $199,999 | 12 | 5.9% |
| $200,000+ | 0 | 0.0% |
Family Income by Famaliy Size in Stateline
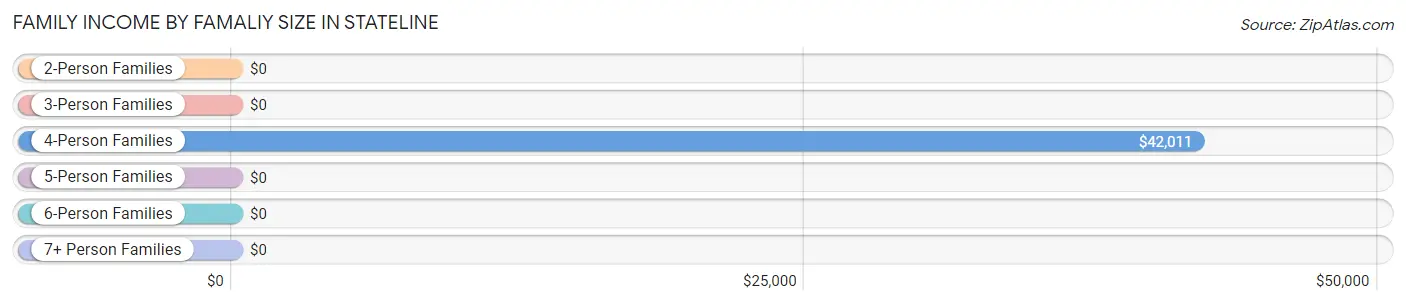
4-person families (111 | 54.4%) account for the highest median family income in Stateline with $42,011 per family, while 4-person families (111 | 54.4%) have the highest median income of $10,503 per family member.
| Income Bracket | # Families | Median Income |
| 2-Person Families | 40 (19.6%) | $0 |
| 3-Person Families | 41 (20.1%) | $0 |
| 4-Person Families | 111 (54.4%) | $42,011 |
| 5-Person Families | 0 (0.0%) | $0 |
| 6-Person Families | 12 (5.9%) | $0 |
| 7+ Person Families | 0 (0.0%) | $0 |
| Total | 204 (100.0%) | $51,696 |
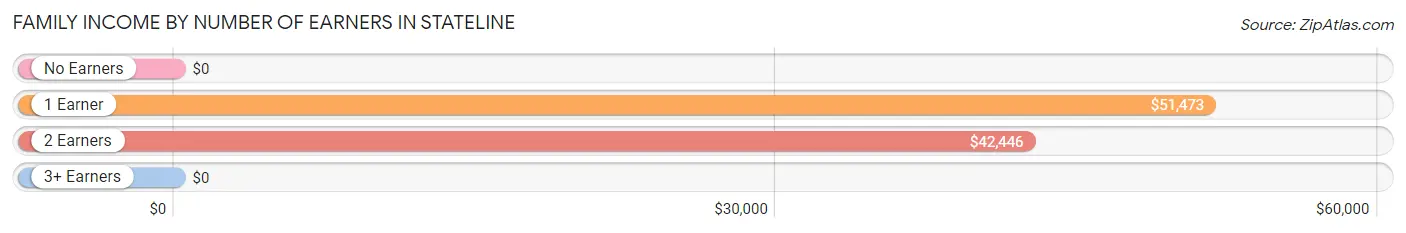
Family Income by Number of Earners in Stateline
| Number of Earners | # Families | Median Income |
| No Earners | 0 (0.0%) | $0 |
| 1 Earner | 61 (29.9%) | $51,473 |
| 2 Earners | 135 (66.2%) | $42,446 |
| 3+ Earners | 8 (3.9%) | $0 |
| Total | 204 (100.0%) | $51,696 |
Household Income in Stateline
Household Income Brackets in Stateline
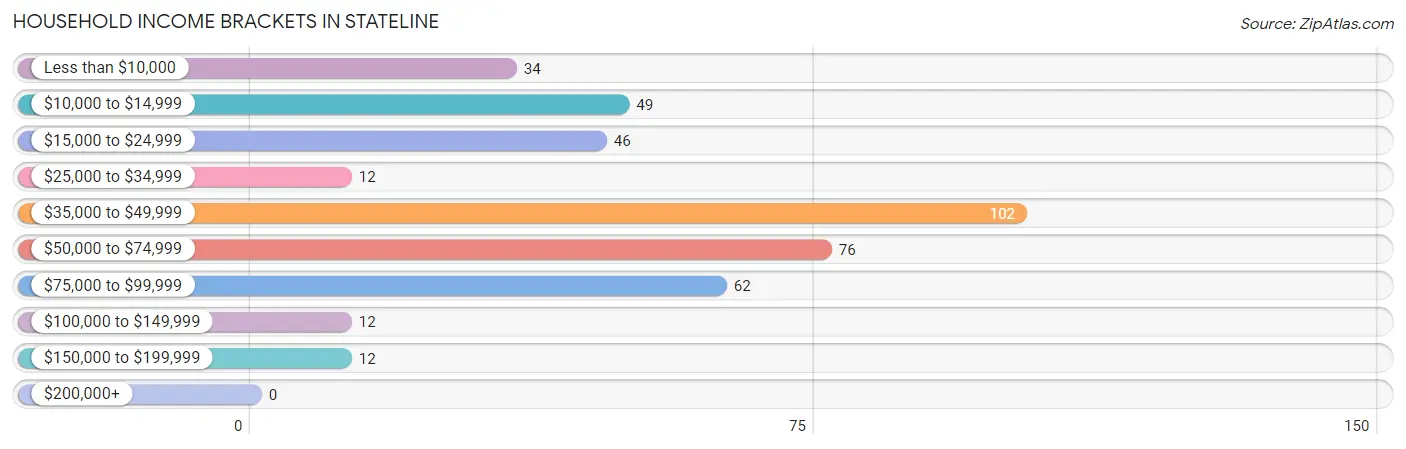
With 102 households falling in the category, the $35,000 to $49,999 income range is the most frequent in Stateline, accounting for 25.2% of all households.
| Income Bracket | # Households | % Households |
| Less than $10,000 | 34 | 8.4% |
| $10,000 to $14,999 | 49 | 12.1% |
| $15,000 to $24,999 | 46 | 11.4% |
| $25,000 to $34,999 | 12 | 3.0% |
| $35,000 to $49,999 | 102 | 25.2% |
| $50,000 to $74,999 | 76 | 18.8% |
| $75,000 to $99,999 | 62 | 15.3% |
| $100,000 to $149,999 | 12 | 3.0% |
| $150,000 to $199,999 | 12 | 3.0% |
| $200,000+ | 0 | 0.0% |
Household Income by Householder Age in Stateline
The median household income in Stateline is $41,830, with the highest median household income of $56,250 found in the 25 to 44 years age bracket for the primary householder. A total of 172 households (42.5%) fall into this category.
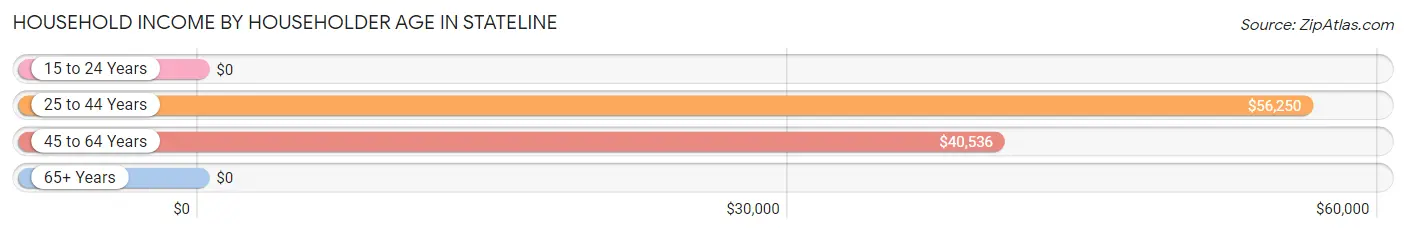
| Income Bracket | # Households | Median Income |
| 15 to 24 Years | 0 (0.0%) | $0 |
| 25 to 44 Years | 172 (42.5%) | $56,250 |
| 45 to 64 Years | 200 (49.4%) | $40,536 |
| 65+ Years | 33 (8.2%) | $0 |
| Total | 405 (100.0%) | $41,830 |
Poverty in Stateline
Income Below Poverty by Sex and Age in Stateline
With 12.9% poverty level for males and 14.8% for females among the residents of Stateline, 65 to 74 year old males and 6 to 11 year old females are the most vulnerable to poverty, with 20 males (100.0%) and 10 females (37.0%) in their respective age groups living below the poverty level.
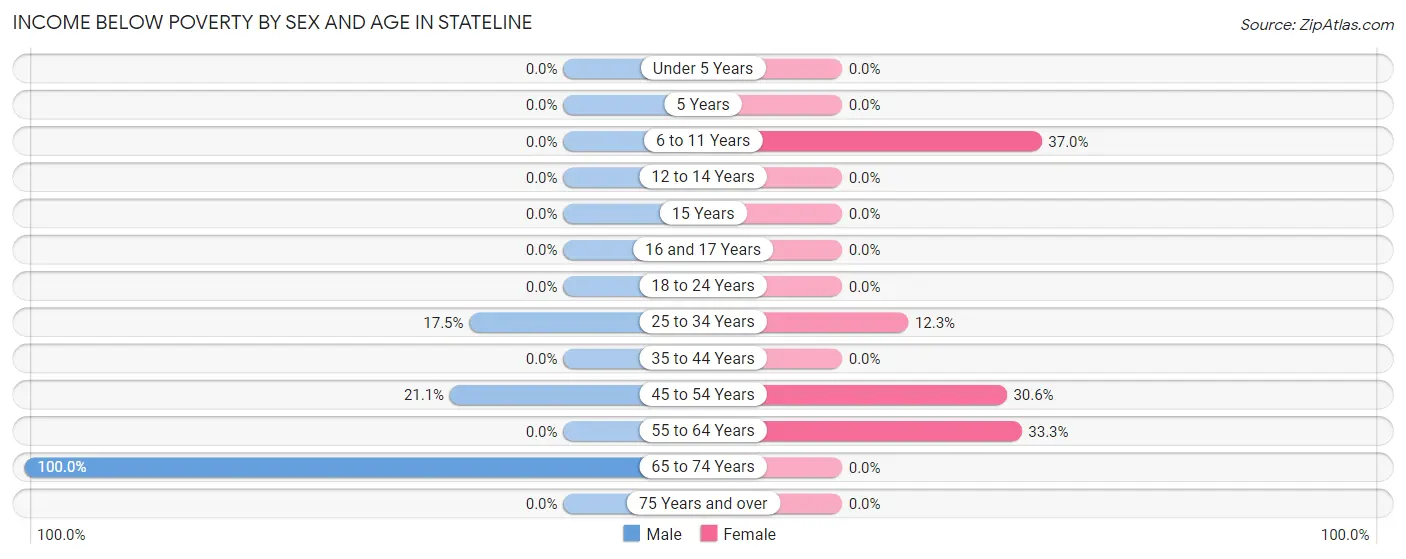
| Age Bracket | Male | Female |
| Under 5 Years | 0 (0.0%) | 0 (0.0%) |
| 5 Years | 0 (0.0%) | 0 (0.0%) |
| 6 to 11 Years | 0 (0.0%) | 10 (37.0%) |
| 12 to 14 Years | 0 (0.0%) | 0 (0.0%) |
| 15 Years | 0 (0.0%) | 0 (0.0%) |
| 16 and 17 Years | 0 (0.0%) | 0 (0.0%) |
| 18 to 24 Years | 0 (0.0%) | 0 (0.0%) |
| 25 to 34 Years | 37 (17.4%) | 7 (12.3%) |
| 35 to 44 Years | 0 (0.0%) | 0 (0.0%) |
| 45 to 54 Years | 24 (21.0%) | 11 (30.6%) |
| 55 to 64 Years | 0 (0.0%) | 14 (33.3%) |
| 65 to 74 Years | 20 (100.0%) | 0 (0.0%) |
| 75 Years and over | 0 (0.0%) | 0 (0.0%) |
| Total | 81 (12.9%) | 42 (14.8%) |
Income Above Poverty by Sex and Age in Stateline
According to the poverty statistics in Stateline, males aged under 5 years and females aged under 5 years are the age groups that are most secure financially, with 100.0% of males and 100.0% of females in these age groups living above the poverty line.
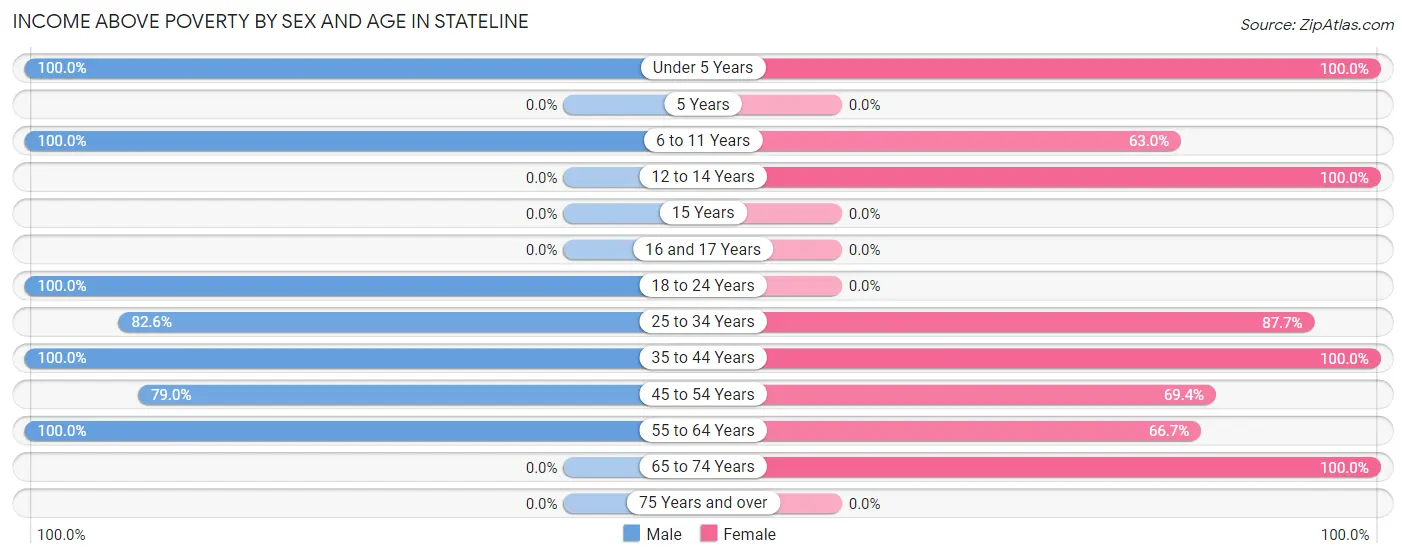
| Age Bracket | Male | Female |
| Under 5 Years | 84 (100.0%) | 40 (100.0%) |
| 5 Years | 0 (0.0%) | 0 (0.0%) |
| 6 to 11 Years | 13 (100.0%) | 17 (63.0%) |
| 12 to 14 Years | 0 (0.0%) | 16 (100.0%) |
| 15 Years | 0 (0.0%) | 0 (0.0%) |
| 16 and 17 Years | 0 (0.0%) | 0 (0.0%) |
| 18 to 24 Years | 79 (100.0%) | 0 (0.0%) |
| 25 to 34 Years | 175 (82.6%) | 50 (87.7%) |
| 35 to 44 Years | 51 (100.0%) | 53 (100.0%) |
| 45 to 54 Years | 90 (78.9%) | 25 (69.4%) |
| 55 to 64 Years | 54 (100.0%) | 28 (66.7%) |
| 65 to 74 Years | 0 (0.0%) | 13 (100.0%) |
| 75 Years and over | 0 (0.0%) | 0 (0.0%) |
| Total | 546 (87.1%) | 242 (85.2%) |
Income Below Poverty Among Married-Couple Families in Stateline
The poverty statistics for married-couple families in Stateline show that 9.9% or 14 of the total 142 families live below the poverty line. Families with 1 or 2 children have the highest poverty rate of 23.0%, comprising of 14 families. On the other hand, families with no children have the lowest poverty rate of 0.0%, which includes 0 families.
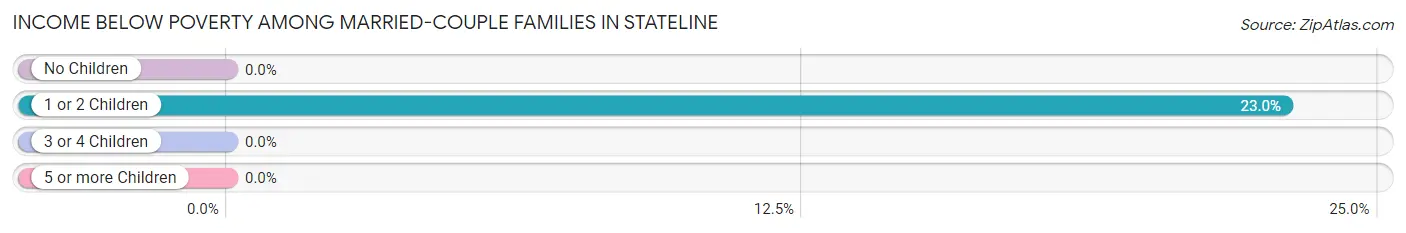
| Children | Above Poverty | Below Poverty |
| No Children | 81 (100.0%) | 0 (0.0%) |
| 1 or 2 Children | 47 (77.0%) | 14 (23.0%) |
| 3 or 4 Children | 0 (0.0%) | 0 (0.0%) |
| 5 or more Children | 0 (0.0%) | 0 (0.0%) |
| Total | 128 (90.1%) | 14 (9.9%) |
Income Below Poverty Among Single-Parent Households in Stateline
| Children | Single Father | Single Mother |
| No Children | 0 (0.0%) | 0 (0.0%) |
| 1 or 2 Children | 0 (0.0%) | 0 (0.0%) |
| 3 or 4 Children | 0 (0.0%) | 0 (0.0%) |
| 5 or more Children | 0 (0.0%) | 0 (0.0%) |
| Total | 0 (0.0%) | 0 (0.0%) |
Income Below Poverty Among Married-Couple vs Single-Parent Households in Stateline
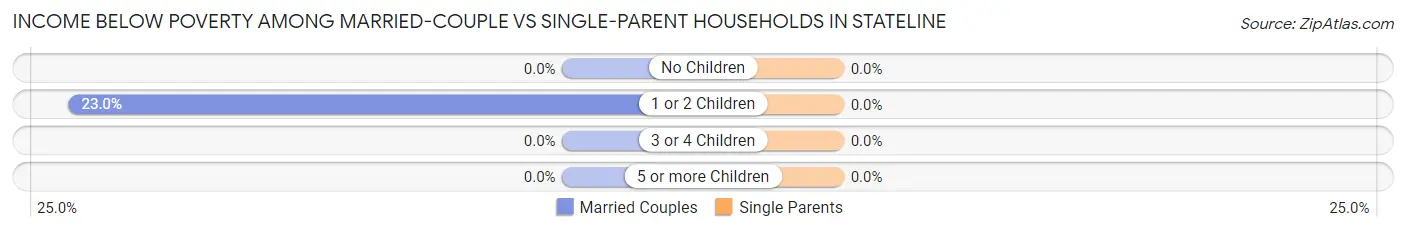
| Children | Married-Couple Families | Single-Parent Households |
| No Children | 0 (0.0%) | 0 (0.0%) |
| 1 or 2 Children | 14 (23.0%) | 0 (0.0%) |
| 3 or 4 Children | 0 (0.0%) | 0 (0.0%) |
| 5 or more Children | 0 (0.0%) | 0 (0.0%) |
| Total | 14 (9.9%) | 0 (0.0%) |
Race in Stateline
The most populous races in Stateline are Hispanic or Latino (543 | 57.9%), White / Caucasian (466 | 49.7%), and Some other Race (373 | 39.8%).
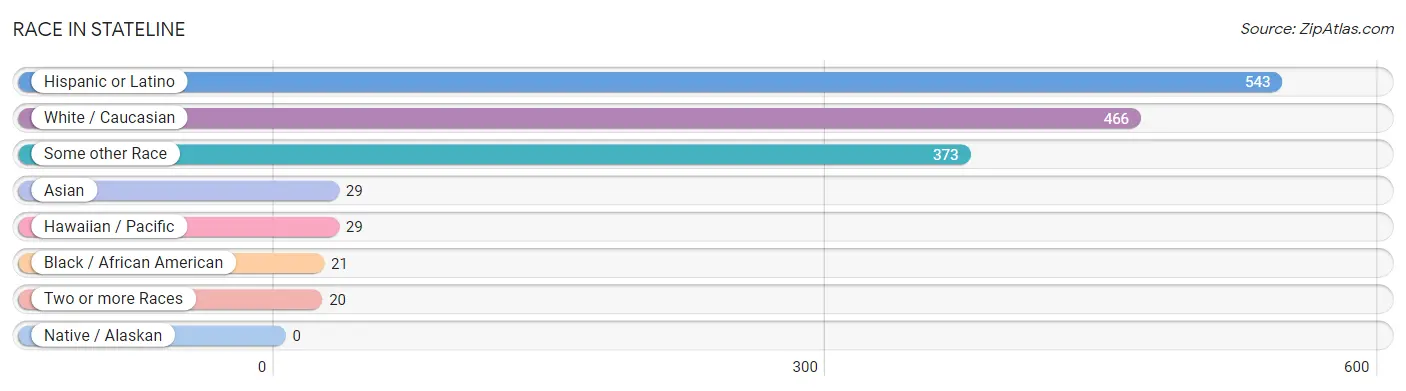
| Race | # Population | % Population |
| Asian | 29 | 3.1% |
| Black / African American | 21 | 2.2% |
| Hawaiian / Pacific | 29 | 3.1% |
| Hispanic or Latino | 543 | 57.9% |
| Native / Alaskan | 0 | 0.0% |
| White / Caucasian | 466 | 49.7% |
| Two or more Races | 20 | 2.1% |
| Some other Race | 373 | 39.8% |
| Total | 938 | 100.0% |
Ancestry in Stateline
The most populous ancestries reported in Stateline are Mexican (515 | 54.9%), Irish (56 | 6.0%), Portuguese (56 | 6.0%), German (49 | 5.2%), and Korean (29 | 3.1%), together accounting for 75.2% of all Stateline residents.
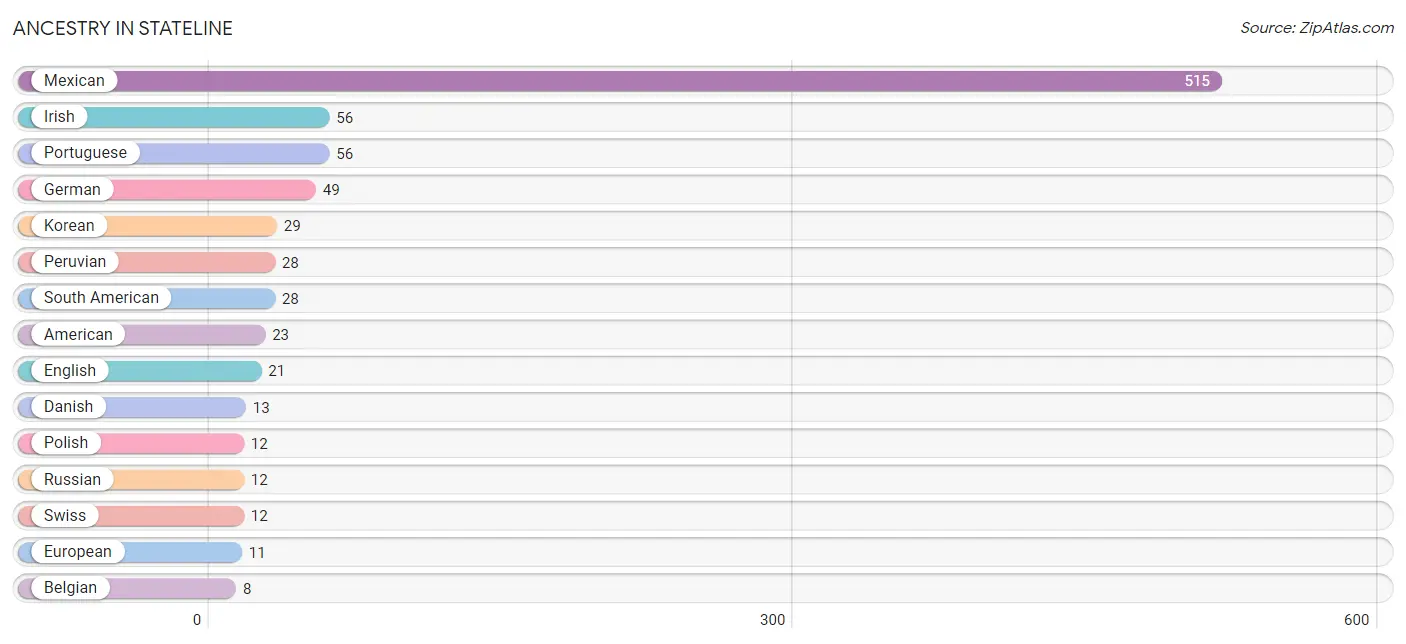
| Ancestry | # Population | % Population |
| American | 23 | 2.5% |
| Belgian | 8 | 0.9% |
| Danish | 13 | 1.4% |
| English | 21 | 2.2% |
| European | 11 | 1.2% |
| German | 49 | 5.2% |
| Irish | 56 | 6.0% |
| Korean | 29 | 3.1% |
| Mexican | 515 | 54.9% |
| Peruvian | 28 | 3.0% |
| Polish | 12 | 1.3% |
| Portuguese | 56 | 6.0% |
| Russian | 12 | 1.3% |
| Scottish | 5 | 0.5% |
| South American | 28 | 3.0% |
| Swiss | 12 | 1.3% | View All 16 Rows |
Immigrants in Stateline
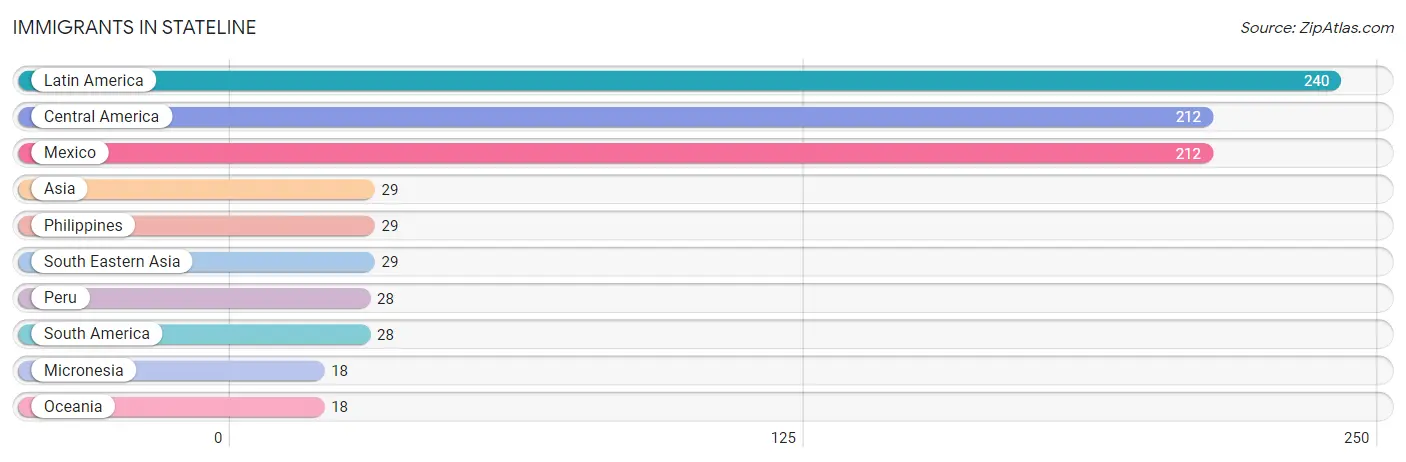
The most numerous immigrant groups reported in Stateline came from Latin America (240 | 25.6%), Central America (212 | 22.6%), Mexico (212 | 22.6%), Asia (29 | 3.1%), and Philippines (29 | 3.1%), together accounting for 77.0% of all Stateline residents.
| Immigration Origin | # Population | % Population |
| Asia | 29 | 3.1% |
| Central America | 212 | 22.6% |
| Latin America | 240 | 25.6% |
| Mexico | 212 | 22.6% |
| Micronesia | 18 | 1.9% |
| Oceania | 18 | 1.9% |
| Peru | 28 | 3.0% |
| Philippines | 29 | 3.1% |
| South America | 28 | 3.0% |
| South Eastern Asia | 29 | 3.1% | View All 10 Rows |
Sex and Age in Stateline
Sex and Age in Stateline
The most populous age groups in Stateline are 30 to 34 Years (149 | 23.8%) for men and 10 to 14 Years (43 | 13.8%) for women.
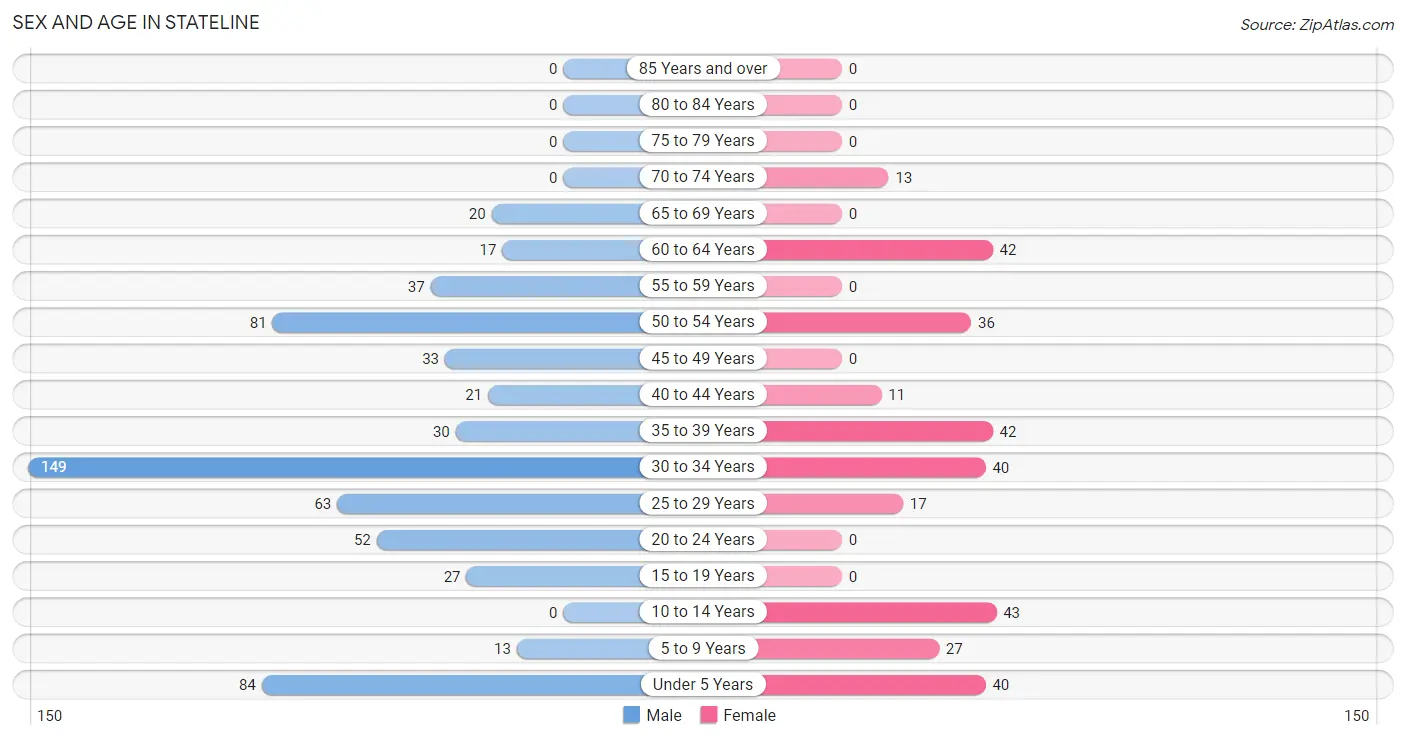
| Age Bracket | Male | Female |
| Under 5 Years | 84 (13.4%) | 40 (12.9%) |
| 5 to 9 Years | 13 (2.1%) | 27 (8.7%) |
| 10 to 14 Years | 0 (0.0%) | 43 (13.8%) |
| 15 to 19 Years | 27 (4.3%) | 0 (0.0%) |
| 20 to 24 Years | 52 (8.3%) | 0 (0.0%) |
| 25 to 29 Years | 63 (10.1%) | 17 (5.5%) |
| 30 to 34 Years | 149 (23.8%) | 40 (12.9%) |
| 35 to 39 Years | 30 (4.8%) | 42 (13.5%) |
| 40 to 44 Years | 21 (3.4%) | 11 (3.5%) |
| 45 to 49 Years | 33 (5.3%) | 0 (0.0%) |
| 50 to 54 Years | 81 (12.9%) | 36 (11.6%) |
| 55 to 59 Years | 37 (5.9%) | 0 (0.0%) |
| 60 to 64 Years | 17 (2.7%) | 42 (13.5%) |
| 65 to 69 Years | 20 (3.2%) | 0 (0.0%) |
| 70 to 74 Years | 0 (0.0%) | 13 (4.2%) |
| 75 to 79 Years | 0 (0.0%) | 0 (0.0%) |
| 80 to 84 Years | 0 (0.0%) | 0 (0.0%) |
| 85 Years and over | 0 (0.0%) | 0 (0.0%) |
| Total | 627 (100.0%) | 311 (100.0%) |
Families and Households in Stateline
Median Family Size in Stateline
The median family size in Stateline is 3.21 persons per family, with single female/mother families (26 | 12.8%) accounting for the largest median family size of 7.38 persons per family. On the other hand, single male/father families (36 | 17.6%) represent the smallest median family size with 2.47 persons per family.
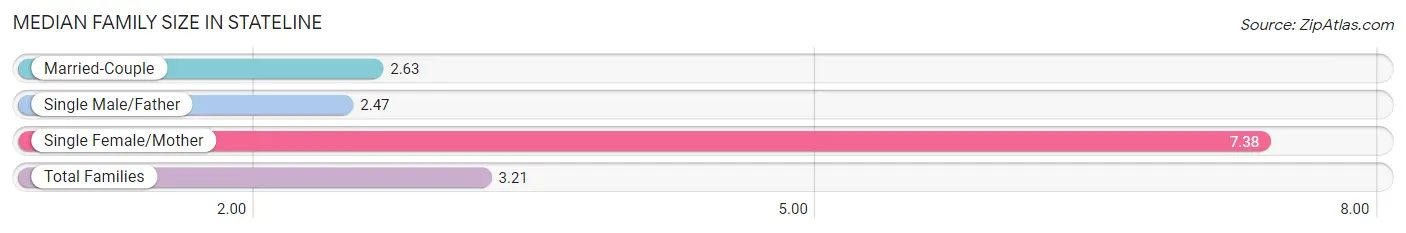
| Family Type | # Families | Family Size |
| Married-Couple | 142 (69.6%) | 2.63 |
| Single Male/Father | 36 (17.6%) | 2.47 |
| Single Female/Mother | 26 (12.8%) | 7.38 |
| Total Families | 204 (100.0%) | 3.21 |
Median Household Size in Stateline
The median household size in Stateline is 2.32 persons per household, with single female/mother households (26 | 6.4%) accounting for the largest median household size of 7.38 persons per household. non-family households (201 | 49.6%) represent the smallest median household size with 1.41 persons per household.
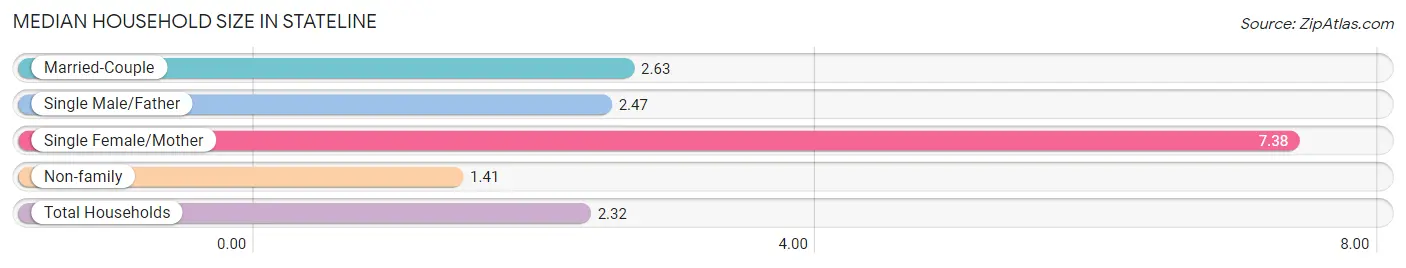
| Household Type | # Households | Household Size |
| Married-Couple | 142 (35.1%) | 2.63 |
| Single Male/Father | 36 (8.9%) | 2.47 |
| Single Female/Mother | 26 (6.4%) | 7.38 |
| Non-family | 201 (49.6%) | 1.41 |
| Total Households | 405 (100.0%) | 2.32 |
Household Size by Marriage Status in Stateline
Out of a total of 405 households in Stateline, 204 (50.4%) are family households, while 201 (49.6%) are nonfamily households. The most numerous type of family households are 4-person households, comprising 111, and the most common type of nonfamily households are 1-person households, comprising 171.
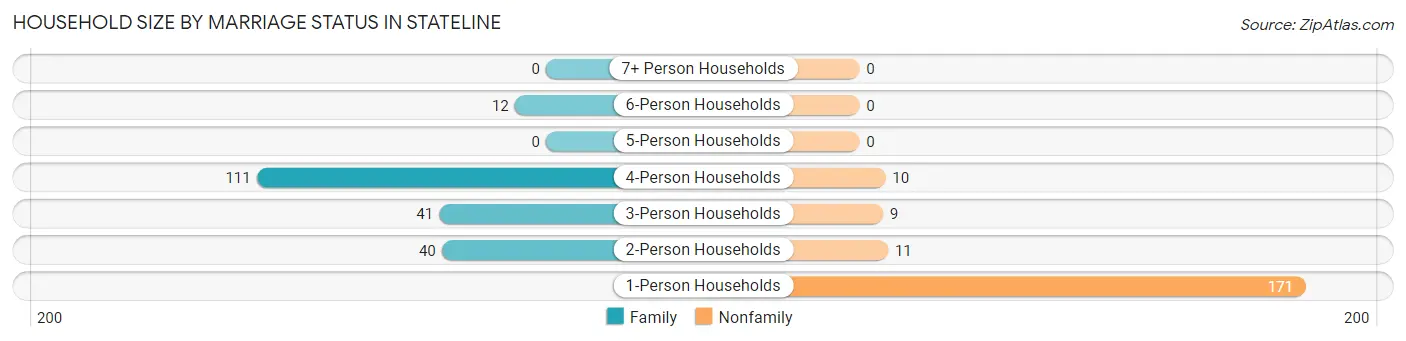
| Household Size | Family Households | Nonfamily Households |
| 1-Person Households | - | 171 (42.2%) |
| 2-Person Households | 40 (9.9%) | 11 (2.7%) |
| 3-Person Households | 41 (10.1%) | 9 (2.2%) |
| 4-Person Households | 111 (27.4%) | 10 (2.5%) |
| 5-Person Households | 0 (0.0%) | 0 (0.0%) |
| 6-Person Households | 12 (3.0%) | 0 (0.0%) |
| 7+ Person Households | 0 (0.0%) | 0 (0.0%) |
| Total | 204 (50.4%) | 201 (49.6%) |
Female Fertility in Stateline
Fertility by Age in Stateline
Average fertility rate in Stateline is 126.0 births per 1,000 women. Women in the age bracket of 35 to 50 years have the highest fertility rate with 154.0 births per 1,000 women. Women in the age bracket of 35 to 50 years acount for 70.6% of all women with births.
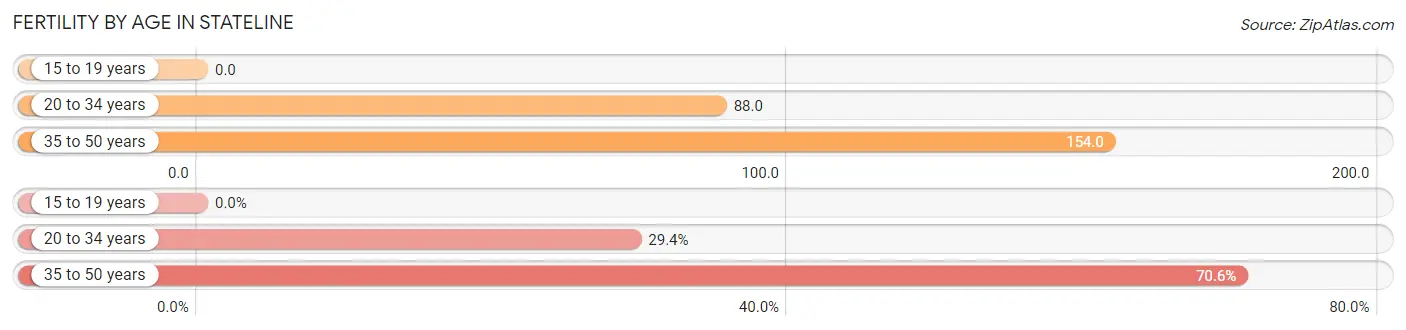
| Age Bracket | Women with Births | Births / 1,000 Women |
| 15 to 19 years | 0 (0.0%) | 0.0 |
| 20 to 34 years | 5 (29.4%) | 88.0 |
| 35 to 50 years | 12 (70.6%) | 154.0 |
| Total | 17 (100.0%) | 126.0 |
Fertility by Age by Marriage Status in Stateline
29.4% of women with births (17) in Stateline are married. The highest percentage of unmarried women with births falls into 35 to 50 years age bracket with 100.0% of them unmarried at the time of birth, while the lowest percentage of unmarried women with births belong to 20 to 34 years age bracket with 0.0% of them unmarried.
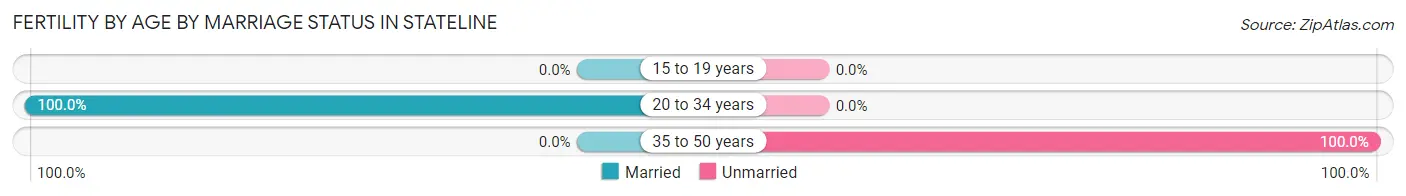
| Age Bracket | Married | Unmarried |
| 15 to 19 years | 0 (0.0%) | 0 (0.0%) |
| 20 to 34 years | 5 (100.0%) | 0 (0.0%) |
| 35 to 50 years | 0 (0.0%) | 12 (100.0%) |
| Total | 5 (29.4%) | 12 (70.6%) |
Fertility by Education in Stateline
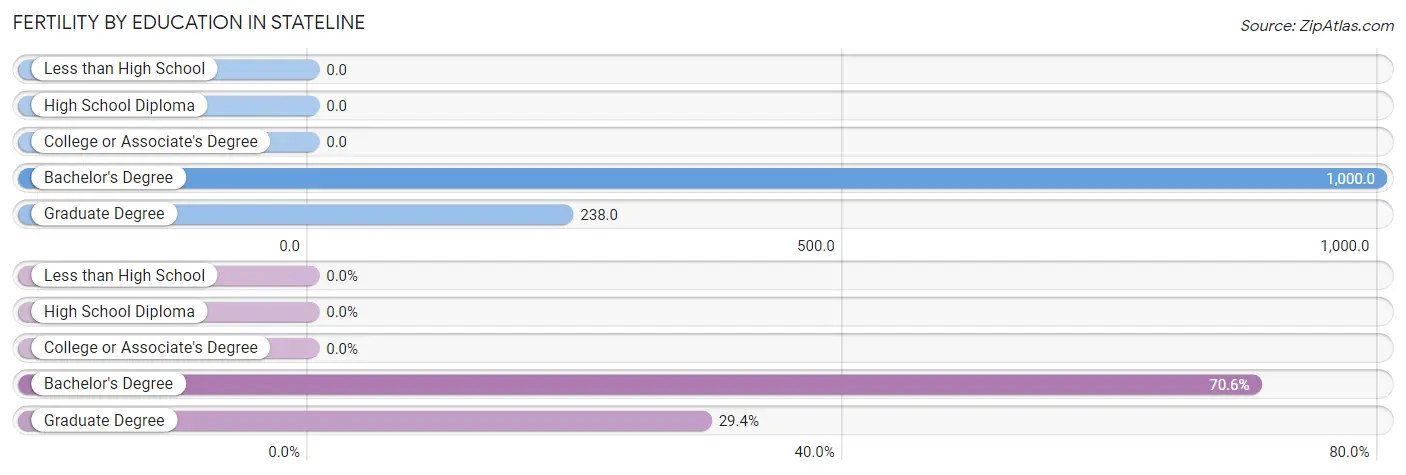
| Educational Attainment | Women with Births | Births / 1,000 Women |
| Less than High School | 0 (0.0%) | 0.0 |
| High School Diploma | 0 (0.0%) | 0.0 |
| College or Associate's Degree | 0 (0.0%) | 0.0 |
| Bachelor's Degree | 12 (70.6%) | 1,000.0 |
| Graduate Degree | 5 (29.4%) | 238.0 |
| Total | 17 (100.0%) | 126.0 |
Fertility by Education by Marriage Status in Stateline
70.6% of women with births in Stateline are unmarried. Women with the educational attainment of graduate degree are most likely to be married with 100.0% of them married at childbirth, while women with the educational attainment of bachelor's degree are least likely to be married with 100.0% of them unmarried at childbirth.
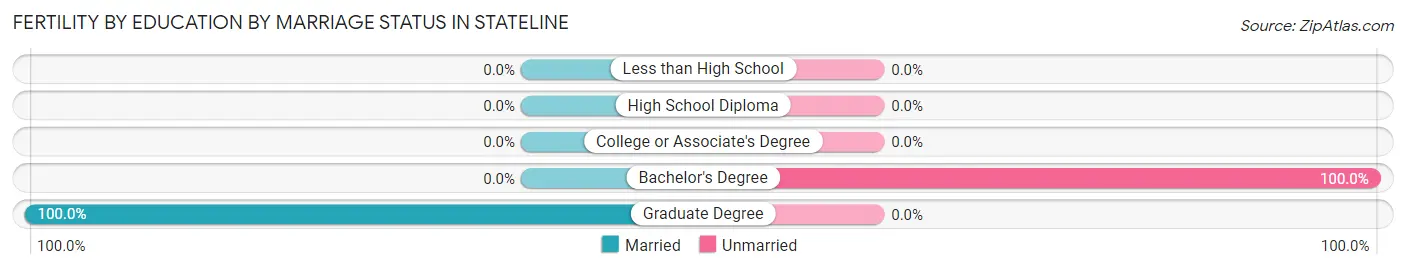
| Educational Attainment | Married | Unmarried |
| Less than High School | 0 (0.0%) | 0 (0.0%) |
| High School Diploma | 0 (0.0%) | 0 (0.0%) |
| College or Associate's Degree | 0 (0.0%) | 0 (0.0%) |
| Bachelor's Degree | 0 (0.0%) | 12 (100.0%) |
| Graduate Degree | 5 (100.0%) | 0 (0.0%) |
| Total | 5 (29.4%) | 12 (70.6%) |
Employment Characteristics in Stateline
Employment by Class of Employer in Stateline
Among the 539 employed individuals in Stateline, private company employees (313 | 58.1%), state government employees (69 | 12.8%), and not-for-profit organizations (56 | 10.4%) make up the most common classes of employment.
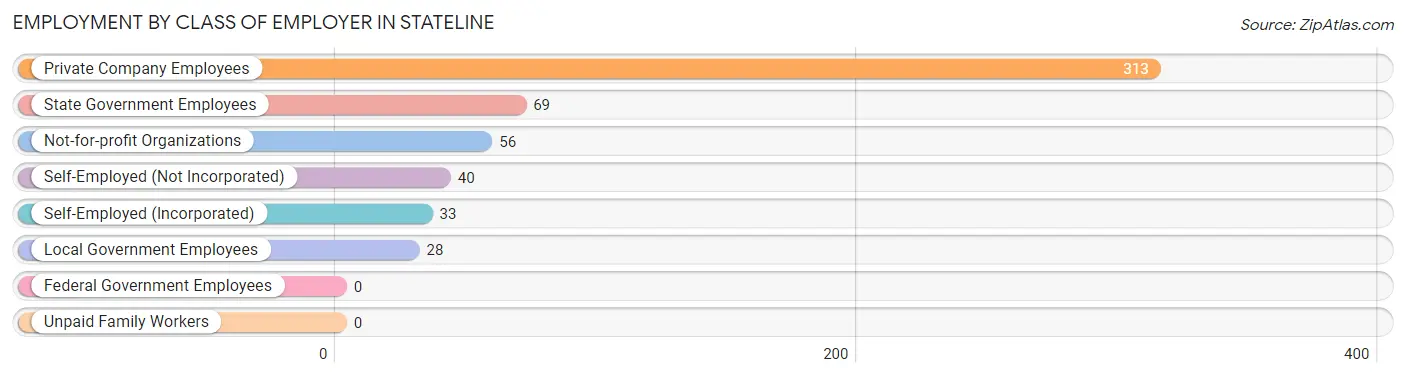
| Employer Class | # Employees | % Employees |
| Private Company Employees | 313 | 58.1% |
| Self-Employed (Incorporated) | 33 | 6.1% |
| Self-Employed (Not Incorporated) | 40 | 7.4% |
| Not-for-profit Organizations | 56 | 10.4% |
| Local Government Employees | 28 | 5.2% |
| State Government Employees | 69 | 12.8% |
| Federal Government Employees | 0 | 0.0% |
| Unpaid Family Workers | 0 | 0.0% |
| Total | 539 | 100.0% |
Employment Status by Age in Stateline
According to the labor force statistics for Stateline, out of the total population over 16 years of age (731), 75.2% or 550 individuals are in the labor force, with 2.0% or 11 of them unemployed. The age group with the highest labor force participation rate is 55 to 59 years, with 100.0% or 37 individuals in the labor force. Within the labor force, the 45 to 54 years age range has the highest percentage of unemployed individuals, with 8.0% or 11 of them being unemployed.
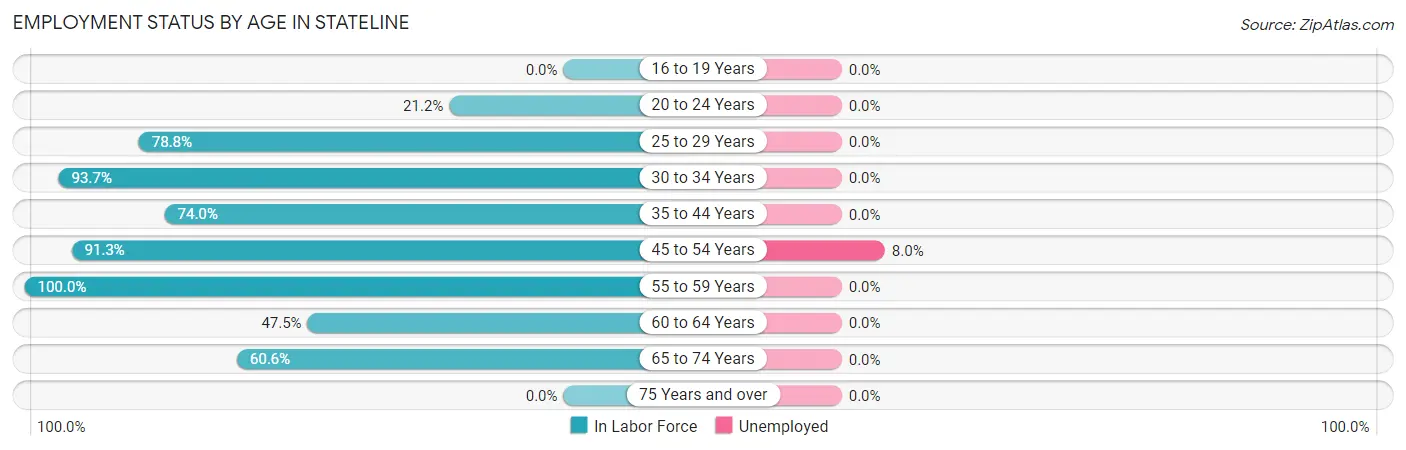
| Age Bracket | In Labor Force | Unemployed |
| 16 to 19 Years | 0 (0.0%) | 0 (0.0%) |
| 20 to 24 Years | 11 (21.2%) | 0 (0.0%) |
| 25 to 29 Years | 63 (78.8%) | 0 (0.0%) |
| 30 to 34 Years | 177 (93.7%) | 0 (0.0%) |
| 35 to 44 Years | 77 (74.0%) | 0 (0.0%) |
| 45 to 54 Years | 137 (91.3%) | 11 (8.0%) |
| 55 to 59 Years | 37 (100.0%) | 0 (0.0%) |
| 60 to 64 Years | 28 (47.5%) | 0 (0.0%) |
| 65 to 74 Years | 20 (60.6%) | 0 (0.0%) |
| 75 Years and over | 0 (0.0%) | 0 (0.0%) |
| Total | 550 (75.2%) | 11 (2.0%) |
Employment Status by Educational Attainment in Stateline
According to labor force statistics for Stateline, 83.8% of individuals (519) out of the total population between 25 and 64 years of age (619) are in the labor force, with 2.1% or 11 of them being unemployed. The group with the highest labor force participation rate are those with the educational attainment of bachelor's degree or higher, with 94.1% or 80 individuals in the labor force. Within the labor force, individuals with less than high school education have the highest percentage of unemployment, with 47.8% or 11 of them being unemployed.
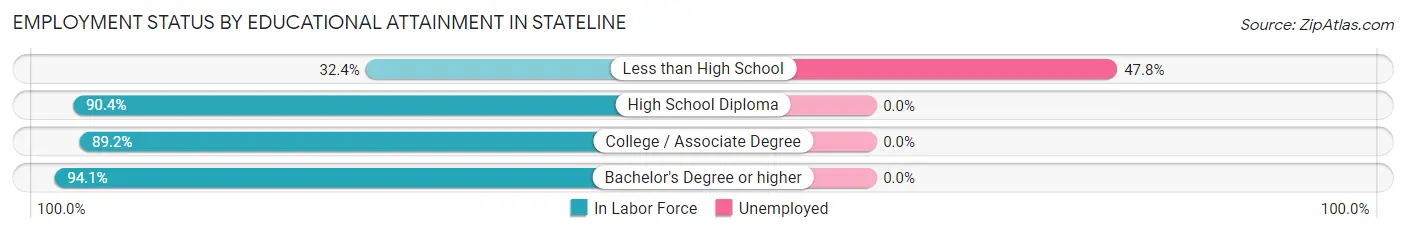
| Educational Attainment | In Labor Force | Unemployed |
| Less than High School | 23 (32.4%) | 34 (47.8%) |
| High School Diploma | 226 (90.4%) | 0 (0.0%) |
| College / Associate Degree | 190 (89.2%) | 0 (0.0%) |
| Bachelor's Degree or higher | 80 (94.1%) | 0 (0.0%) |
| Total | 519 (83.8%) | 13 (2.1%) |
Employment Occupations by Sex in Stateline
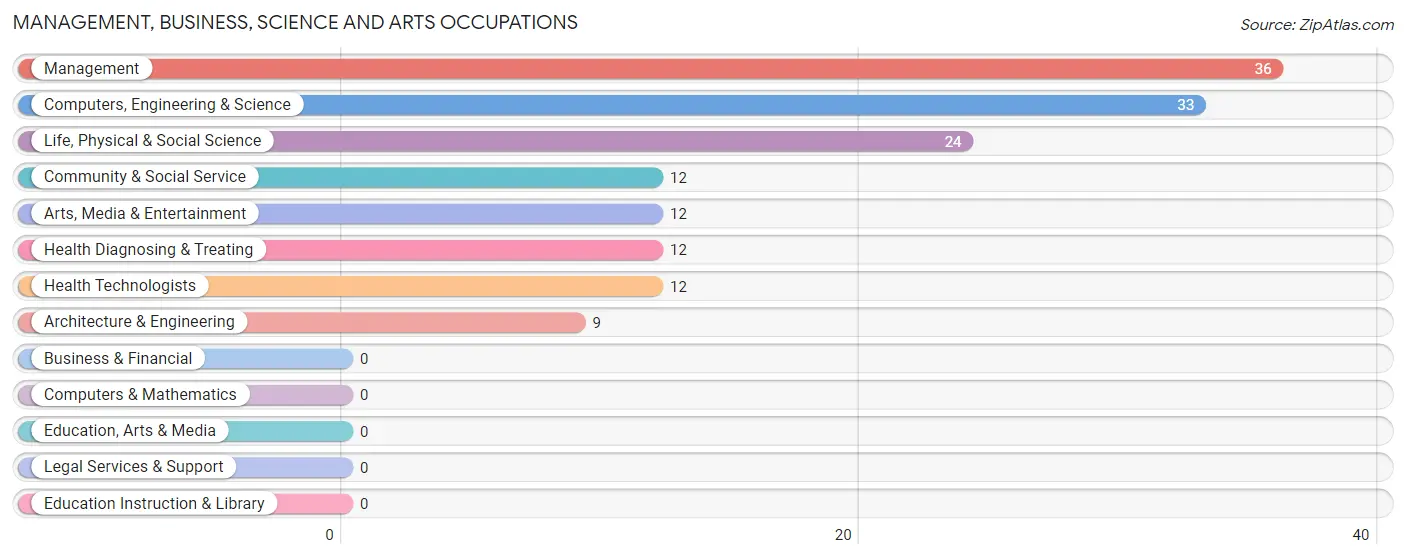
Management, Business, Science and Arts Occupations
The most common Management, Business, Science and Arts occupations in Stateline are Management (36 | 6.7%), Computers, Engineering & Science (33 | 6.1%), Life, Physical & Social Science (24 | 4.4%), Community & Social Service (12 | 2.2%), and Arts, Media & Entertainment (12 | 2.2%).
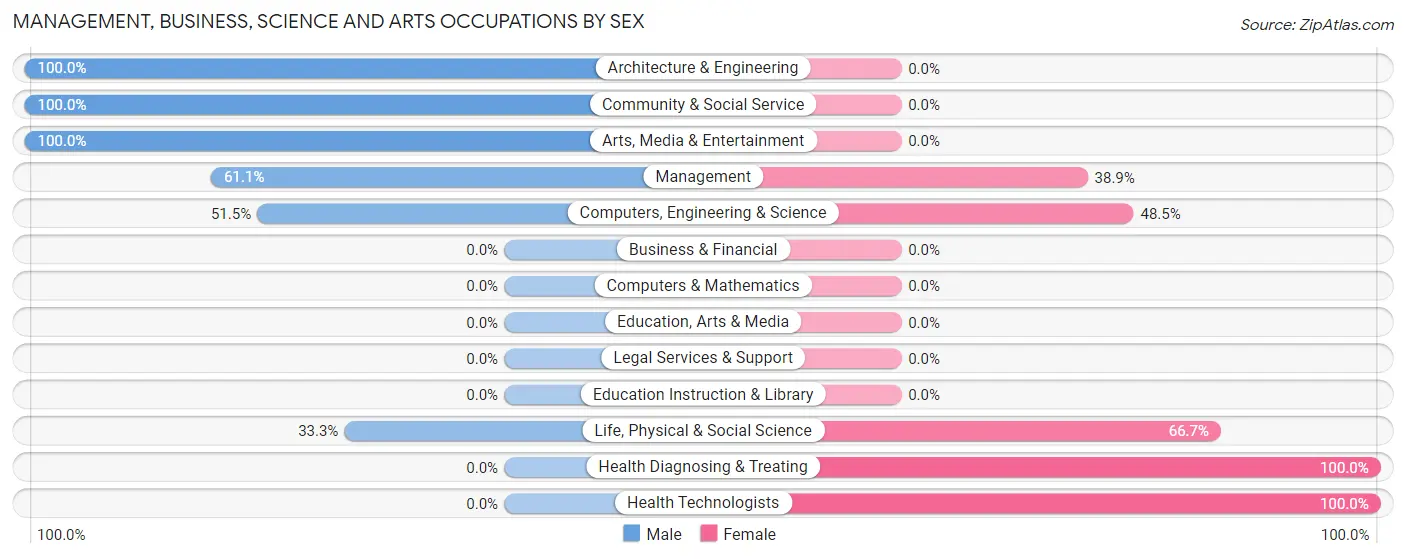
Management, Business, Science and Arts Occupations by Sex
Within the Management, Business, Science and Arts occupations in Stateline, the most male-oriented occupations are Architecture & Engineering (100.0%), Community & Social Service (100.0%), and Arts, Media & Entertainment (100.0%), while the most female-oriented occupations are Health Diagnosing & Treating (100.0%), Health Technologists (100.0%), and Life, Physical & Social Science (66.7%).
| Occupation | Male | Female |
| Management | 22 (61.1%) | 14 (38.9%) |
| Business & Financial | 0 (0.0%) | 0 (0.0%) |
| Computers, Engineering & Science | 17 (51.5%) | 16 (48.5%) |
| Computers & Mathematics | 0 (0.0%) | 0 (0.0%) |
| Architecture & Engineering | 9 (100.0%) | 0 (0.0%) |
| Life, Physical & Social Science | 8 (33.3%) | 16 (66.7%) |
| Community & Social Service | 12 (100.0%) | 0 (0.0%) |
| Education, Arts & Media | 0 (0.0%) | 0 (0.0%) |
| Legal Services & Support | 0 (0.0%) | 0 (0.0%) |
| Education Instruction & Library | 0 (0.0%) | 0 (0.0%) |
| Arts, Media & Entertainment | 12 (100.0%) | 0 (0.0%) |
| Health Diagnosing & Treating | 0 (0.0%) | 12 (100.0%) |
| Health Technologists | 0 (0.0%) | 12 (100.0%) |
| Total (Category) | 51 (54.8%) | 42 (45.2%) |
| Total (Overall) | 445 (82.6%) | 94 (17.4%) |
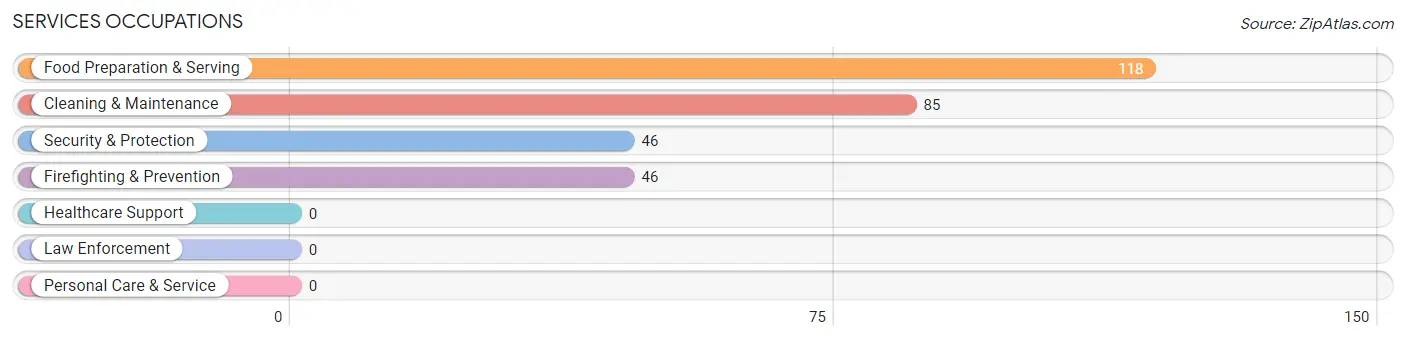
Services Occupations
The most common Services occupations in Stateline are Food Preparation & Serving (118 | 21.9%), Cleaning & Maintenance (85 | 15.8%), Security & Protection (46 | 8.5%), and Firefighting & Prevention (46 | 8.5%).
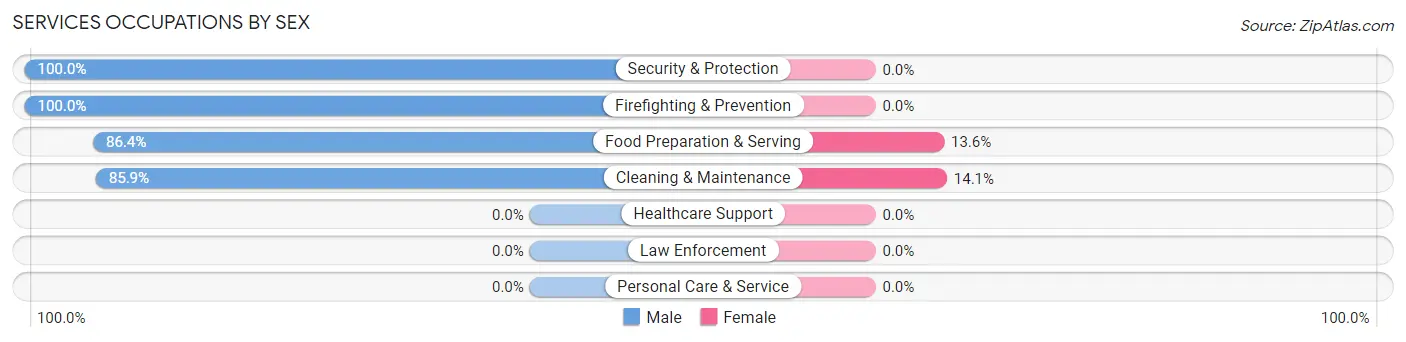
Services Occupations by Sex
Within the Services occupations in Stateline, the most male-oriented occupations are Security & Protection (100.0%), Firefighting & Prevention (100.0%), and Food Preparation & Serving (86.4%), while the most female-oriented occupations are Cleaning & Maintenance (14.1%), and Food Preparation & Serving (13.6%).
| Occupation | Male | Female |
| Healthcare Support | 0 (0.0%) | 0 (0.0%) |
| Security & Protection | 46 (100.0%) | 0 (0.0%) |
| Firefighting & Prevention | 46 (100.0%) | 0 (0.0%) |
| Law Enforcement | 0 (0.0%) | 0 (0.0%) |
| Food Preparation & Serving | 102 (86.4%) | 16 (13.6%) |
| Cleaning & Maintenance | 73 (85.9%) | 12 (14.1%) |
| Personal Care & Service | 0 (0.0%) | 0 (0.0%) |
| Total (Category) | 221 (88.8%) | 28 (11.2%) |
| Total (Overall) | 445 (82.6%) | 94 (17.4%) |
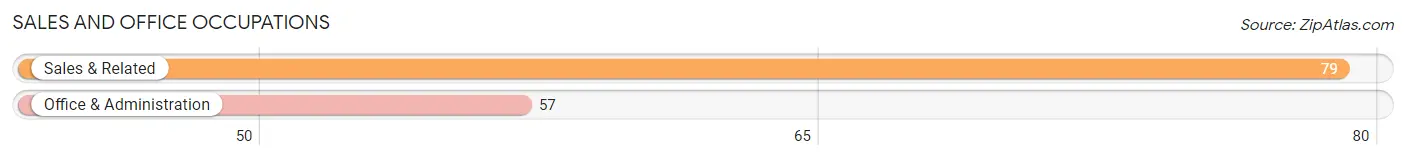
Sales and Office Occupations
The most common Sales and Office occupations in Stateline are Sales & Related (79 | 14.7%), and Office & Administration (57 | 10.6%).
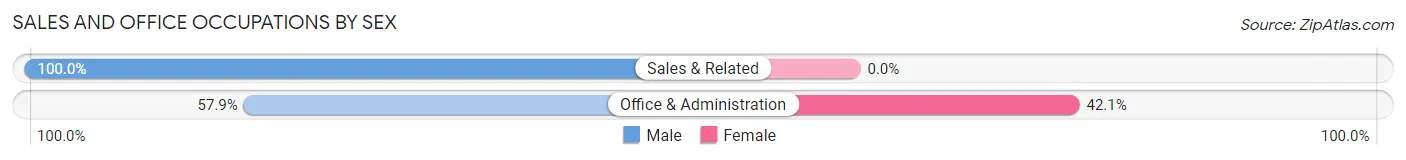
Sales and Office Occupations by Sex
| Occupation | Male | Female |
| Sales & Related | 79 (100.0%) | 0 (0.0%) |
| Office & Administration | 33 (57.9%) | 24 (42.1%) |
| Total (Category) | 112 (82.4%) | 24 (17.6%) |
| Total (Overall) | 445 (82.6%) | 94 (17.4%) |
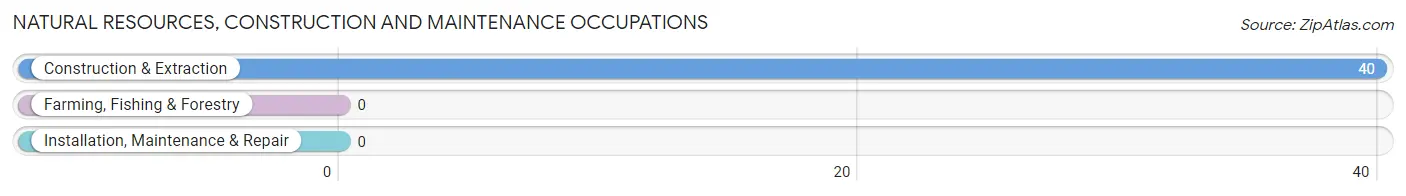
Natural Resources, Construction and Maintenance Occupations
The most common Natural Resources, Construction and Maintenance occupations in Stateline are , and Construction & Extraction (40 | 7.4%).
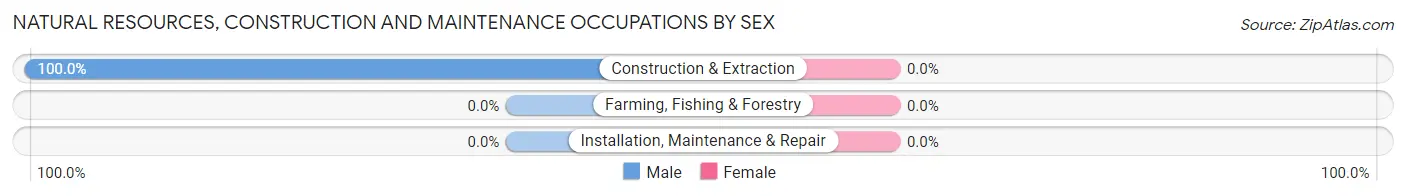
Natural Resources, Construction and Maintenance Occupations by Sex
| Occupation | Male | Female |
| Farming, Fishing & Forestry | 0 (0.0%) | 0 (0.0%) |
| Construction & Extraction | 40 (100.0%) | 0 (0.0%) |
| Installation, Maintenance & Repair | 0 (0.0%) | 0 (0.0%) |
| Total (Category) | 40 (100.0%) | 0 (0.0%) |
| Total (Overall) | 445 (82.6%) | 94 (17.4%) |
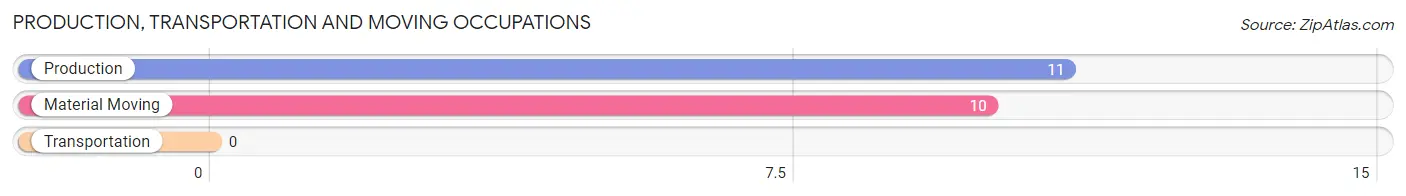
Production, Transportation and Moving Occupations
The most common Production, Transportation and Moving occupations in Stateline are Production (11 | 2.0%), and Material Moving (10 | 1.9%).
Production, Transportation and Moving Occupations by Sex
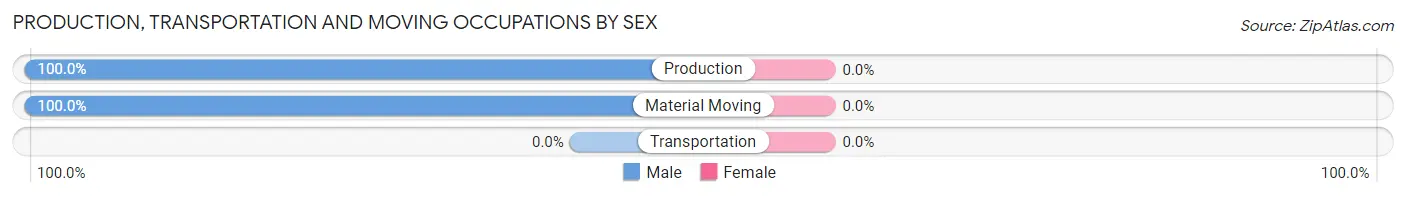
| Occupation | Male | Female |
| Production | 11 (100.0%) | 0 (0.0%) |
| Transportation | 0 (0.0%) | 0 (0.0%) |
| Material Moving | 10 (100.0%) | 0 (0.0%) |
| Total (Category) | 21 (100.0%) | 0 (0.0%) |
| Total (Overall) | 445 (82.6%) | 94 (17.4%) |
Employment Industries by Sex in Stateline
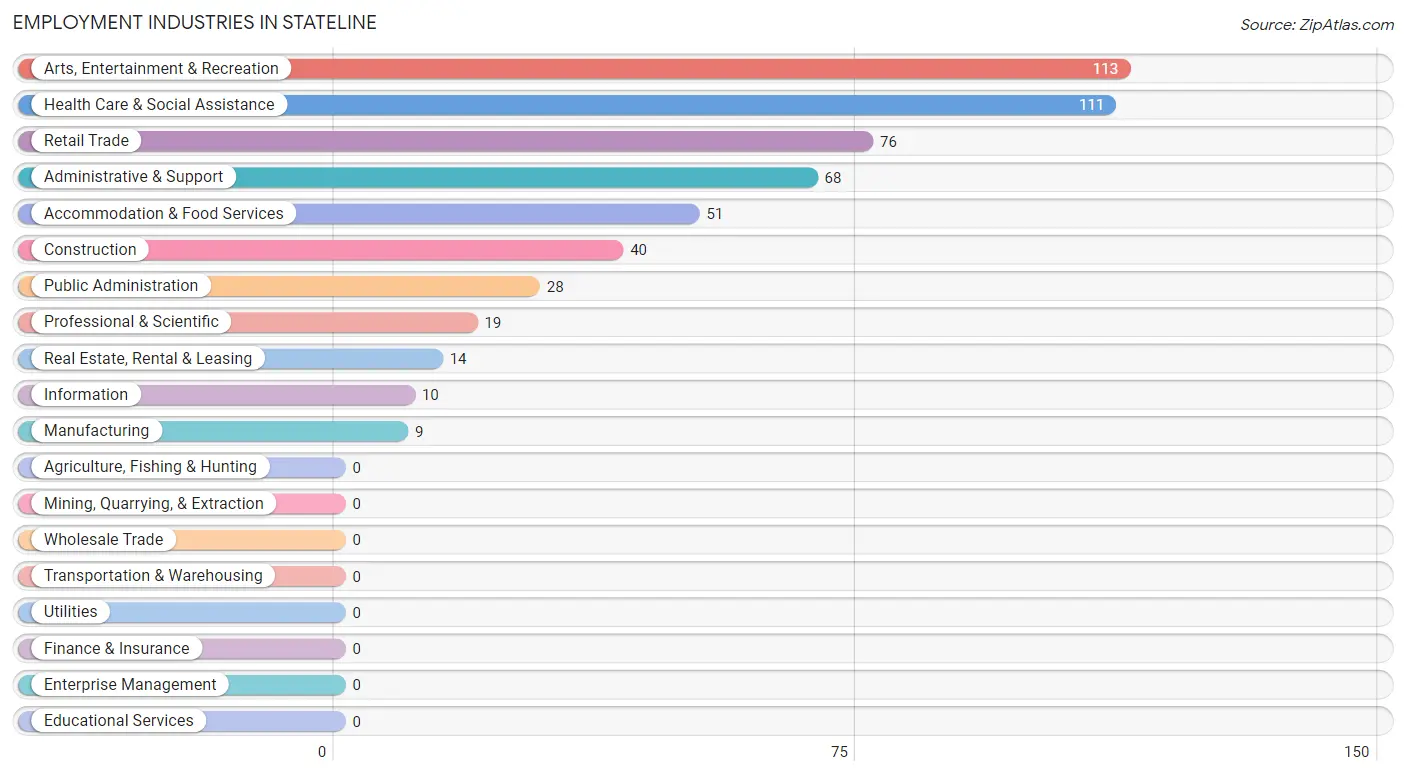
Employment Industries in Stateline
The major employment industries in Stateline include Arts, Entertainment & Recreation (113 | 21.0%), Health Care & Social Assistance (111 | 20.6%), Retail Trade (76 | 14.1%), Administrative & Support (68 | 12.6%), and Accommodation & Food Services (51 | 9.5%).
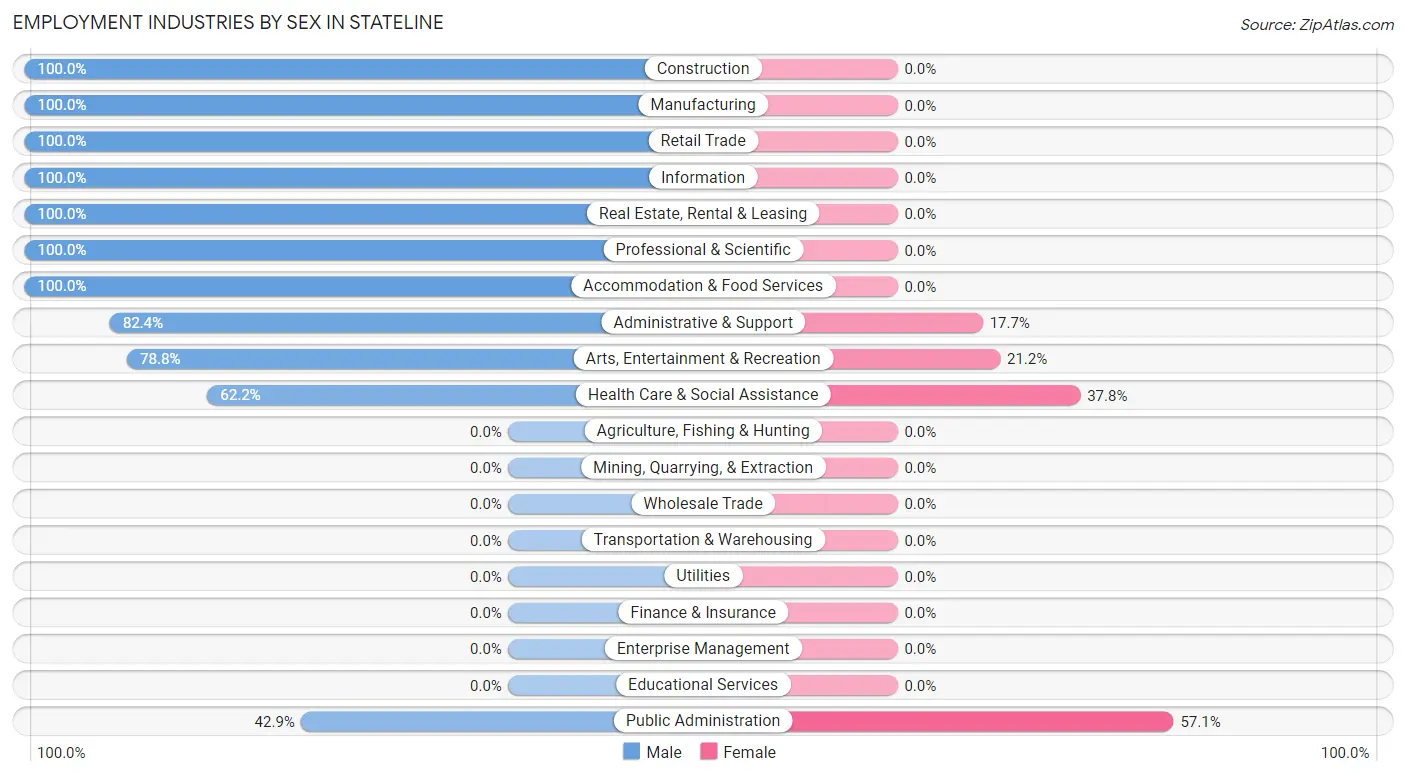
Employment Industries by Sex in Stateline
The Stateline industries that see more men than women are Construction (100.0%), Manufacturing (100.0%), and Retail Trade (100.0%), whereas the industries that tend to have a higher number of women are Public Administration (57.1%), Health Care & Social Assistance (37.8%), and Arts, Entertainment & Recreation (21.2%).
| Industry | Male | Female |
| Agriculture, Fishing & Hunting | 0 (0.0%) | 0 (0.0%) |
| Mining, Quarrying, & Extraction | 0 (0.0%) | 0 (0.0%) |
| Construction | 40 (100.0%) | 0 (0.0%) |
| Manufacturing | 9 (100.0%) | 0 (0.0%) |
| Wholesale Trade | 0 (0.0%) | 0 (0.0%) |
| Retail Trade | 76 (100.0%) | 0 (0.0%) |
| Transportation & Warehousing | 0 (0.0%) | 0 (0.0%) |
| Utilities | 0 (0.0%) | 0 (0.0%) |
| Information | 10 (100.0%) | 0 (0.0%) |
| Finance & Insurance | 0 (0.0%) | 0 (0.0%) |
| Real Estate, Rental & Leasing | 14 (100.0%) | 0 (0.0%) |
| Professional & Scientific | 19 (100.0%) | 0 (0.0%) |
| Enterprise Management | 0 (0.0%) | 0 (0.0%) |
| Administrative & Support | 56 (82.4%) | 12 (17.6%) |
| Educational Services | 0 (0.0%) | 0 (0.0%) |
| Health Care & Social Assistance | 69 (62.2%) | 42 (37.8%) |
| Arts, Entertainment & Recreation | 89 (78.8%) | 24 (21.2%) |
| Accommodation & Food Services | 51 (100.0%) | 0 (0.0%) |
| Public Administration | 12 (42.9%) | 16 (57.1%) |
| Total | 445 (82.6%) | 94 (17.4%) |
Education in Stateline
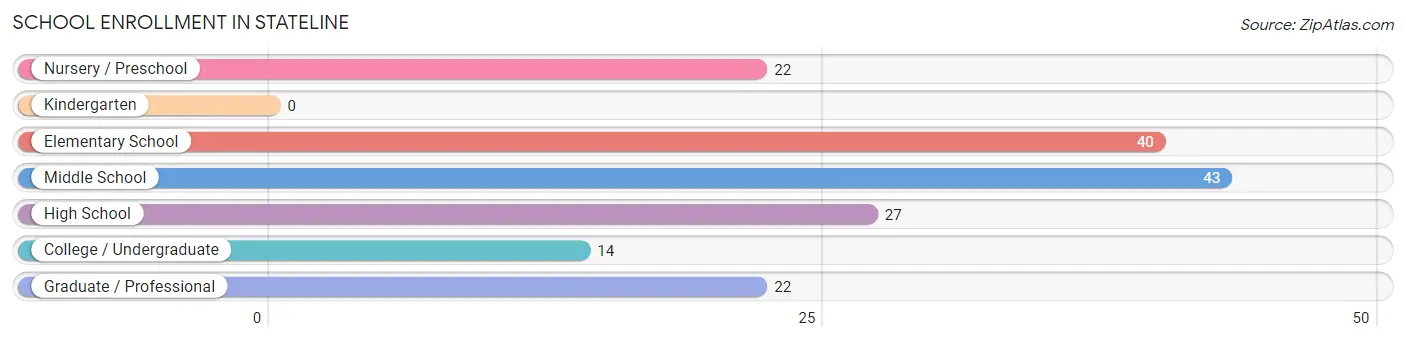
School Enrollment in Stateline
The most common levels of schooling among the 168 students in Stateline are middle school (43 | 25.6%), elementary school (40 | 23.8%), and high school (27 | 16.1%).
| School Level | # Students | % Students |
| Nursery / Preschool | 22 | 13.1% |
| Kindergarten | 0 | 0.0% |
| Elementary School | 40 | 23.8% |
| Middle School | 43 | 25.6% |
| High School | 27 | 16.1% |
| College / Undergraduate | 14 | 8.3% |
| Graduate / Professional | 22 | 13.1% |
| Total | 168 | 100.0% |
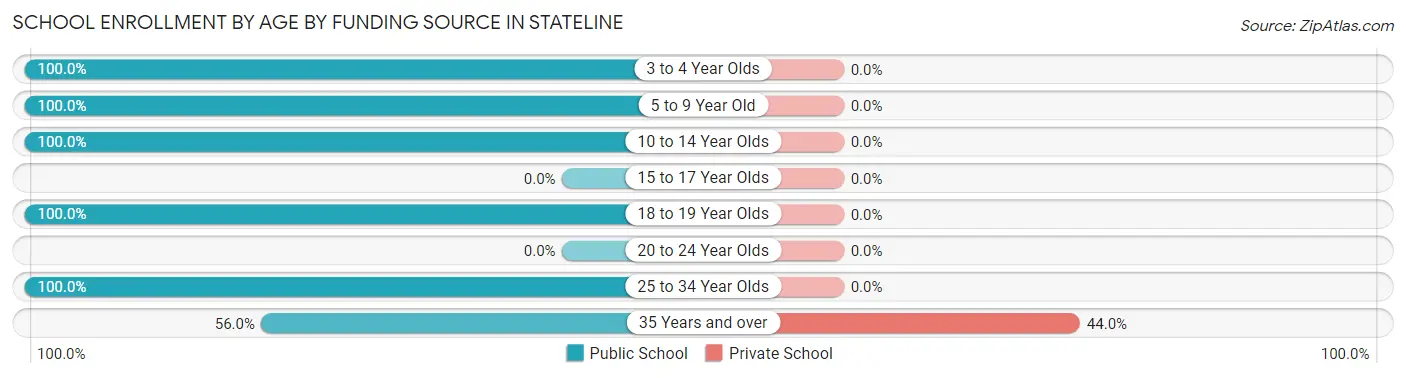
School Enrollment by Age by Funding Source in Stateline
Out of a total of 168 students who are enrolled in schools in Stateline, 11 (6.5%) attend a private institution, while the remaining 157 (93.5%) are enrolled in public schools. The age group of 35 years and over has the highest likelihood of being enrolled in private schools, with 11 (44.0% in the age bracket) enrolled. Conversely, the age group of 3 to 4 year olds has the lowest likelihood of being enrolled in a private school, with 22 (100.0% in the age bracket) attending a public institution.
| Age Bracket | Public School | Private School |
| 3 to 4 Year Olds | 22 (100.0%) | 0 (0.0%) |
| 5 to 9 Year Old | 40 (100.0%) | 0 (0.0%) |
| 10 to 14 Year Olds | 43 (100.0%) | 0 (0.0%) |
| 15 to 17 Year Olds | 0 (0.0%) | 0 (0.0%) |
| 18 to 19 Year Olds | 27 (100.0%) | 0 (0.0%) |
| 20 to 24 Year Olds | 0 (0.0%) | 0 (0.0%) |
| 25 to 34 Year Olds | 11 (100.0%) | 0 (0.0%) |
| 35 Years and over | 14 (56.0%) | 11 (44.0%) |
| Total | 157 (93.5%) | 11 (6.5%) |
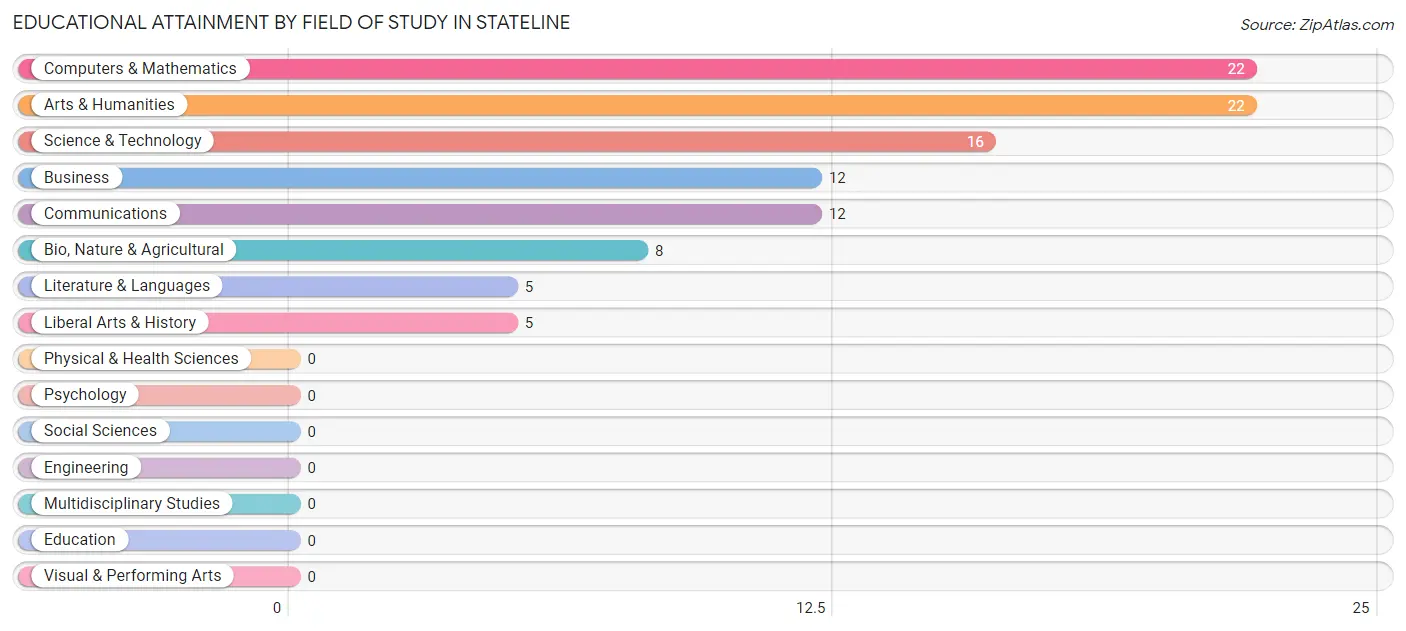
Educational Attainment by Field of Study in Stateline
Computers & mathematics (22 | 21.6%), arts & humanities (22 | 21.6%), science & technology (16 | 15.7%), business (12 | 11.8%), and communications (12 | 11.8%) are the most common fields of study among 102 individuals in Stateline who have obtained a bachelor's degree or higher.
| Field of Study | # Graduates | % Graduates |
| Computers & Mathematics | 22 | 21.6% |
| Bio, Nature & Agricultural | 8 | 7.8% |
| Physical & Health Sciences | 0 | 0.0% |
| Psychology | 0 | 0.0% |
| Social Sciences | 0 | 0.0% |
| Engineering | 0 | 0.0% |
| Multidisciplinary Studies | 0 | 0.0% |
| Science & Technology | 16 | 15.7% |
| Business | 12 | 11.8% |
| Education | 0 | 0.0% |
| Literature & Languages | 5 | 4.9% |
| Liberal Arts & History | 5 | 4.9% |
| Visual & Performing Arts | 0 | 0.0% |
| Communications | 12 | 11.8% |
| Arts & Humanities | 22 | 21.6% |
| Total | 102 | 100.0% |
Transportation & Commute in Stateline
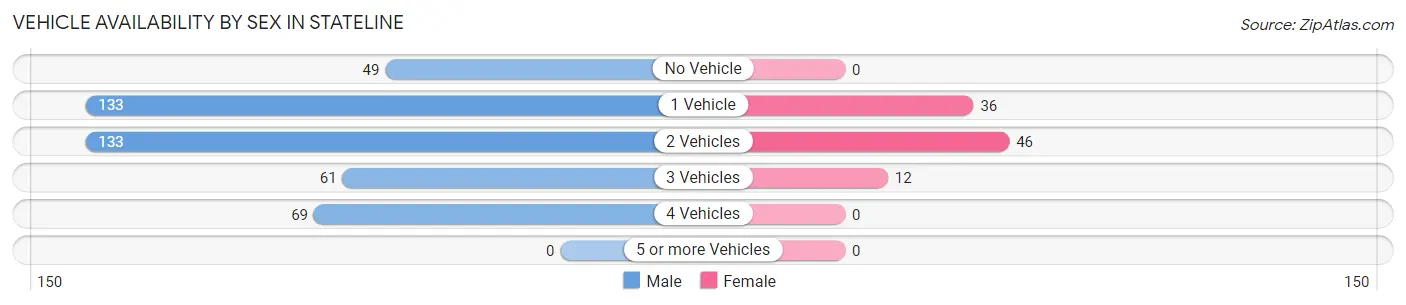
Vehicle Availability by Sex in Stateline
The most prevalent vehicle ownership categories in Stateline are males with 1 vehicle (133, accounting for 29.9%) and females with 1 vehicle (36, making up 141.5%).
| Vehicles Available | Male | Female |
| No Vehicle | 49 (11.0%) | 0 (0.0%) |
| 1 Vehicle | 133 (29.9%) | 36 (38.3%) |
| 2 Vehicles | 133 (29.9%) | 46 (48.9%) |
| 3 Vehicles | 61 (13.7%) | 12 (12.8%) |
| 4 Vehicles | 69 (15.5%) | 0 (0.0%) |
| 5 or more Vehicles | 0 (0.0%) | 0 (0.0%) |
| Total | 445 (100.0%) | 94 (100.0%) |
Commute Time in Stateline
The most frequently occuring commute durations in Stateline are 10 to 14 minutes (173 commuters, 33.7%), less than 5 minutes (137 commuters, 26.7%), and 60 to 89 minutes (82 commuters, 16.0%).
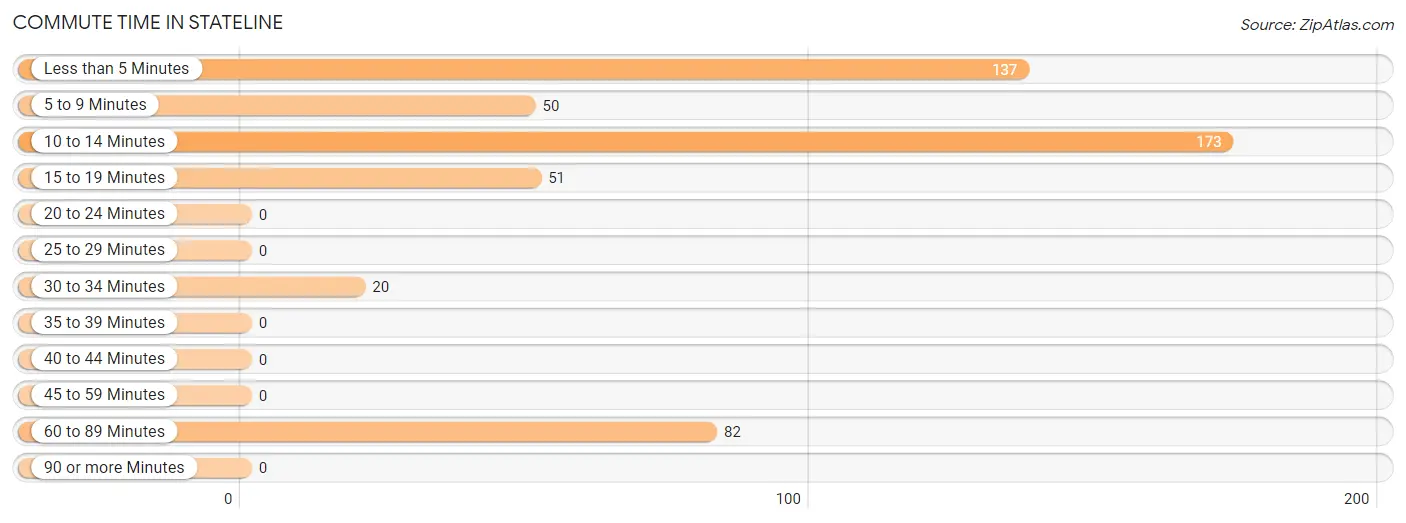
| Commute Time | # Commuters | % Commuters |
| Less than 5 Minutes | 137 | 26.7% |
| 5 to 9 Minutes | 50 | 9.8% |
| 10 to 14 Minutes | 173 | 33.7% |
| 15 to 19 Minutes | 51 | 9.9% |
| 20 to 24 Minutes | 0 | 0.0% |
| 25 to 29 Minutes | 0 | 0.0% |
| 30 to 34 Minutes | 20 | 3.9% |
| 35 to 39 Minutes | 0 | 0.0% |
| 40 to 44 Minutes | 0 | 0.0% |
| 45 to 59 Minutes | 0 | 0.0% |
| 60 to 89 Minutes | 82 | 16.0% |
| 90 or more Minutes | 0 | 0.0% |
Commute Time by Sex in Stateline
The most common commute times in Stateline are 10 to 14 minutes (173 commuters, 40.1%) for males and 60 to 89 minutes (30 commuters, 36.6%) for females.
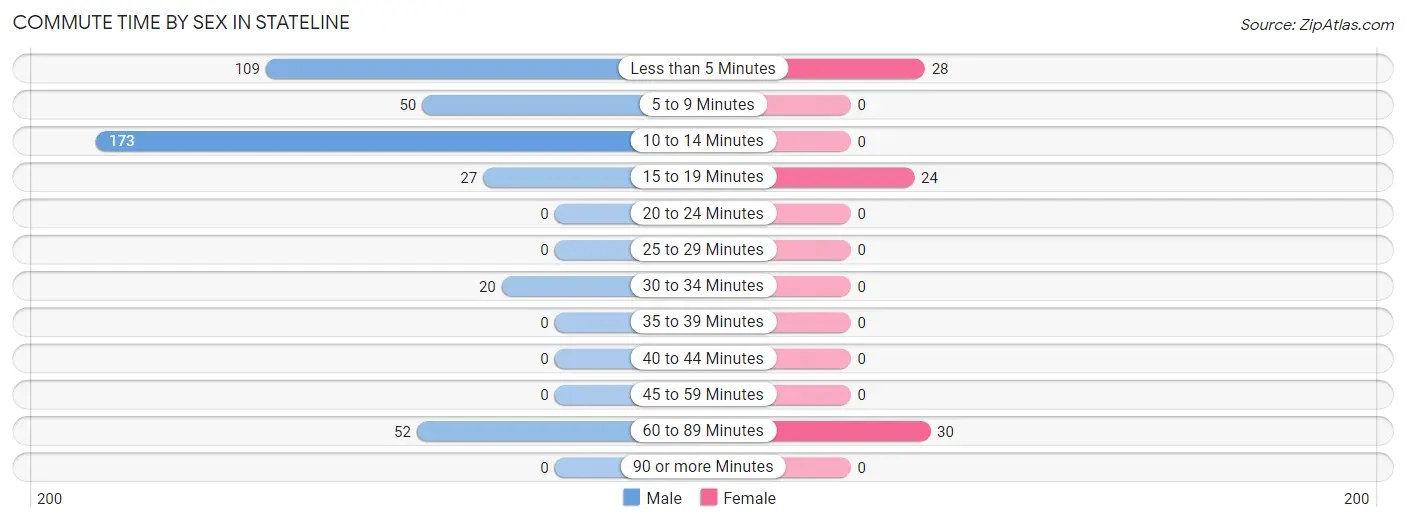
| Commute Time | Male | Female |
| Less than 5 Minutes | 109 (25.3%) | 28 (34.2%) |
| 5 to 9 Minutes | 50 (11.6%) | 0 (0.0%) |
| 10 to 14 Minutes | 173 (40.1%) | 0 (0.0%) |
| 15 to 19 Minutes | 27 (6.3%) | 24 (29.3%) |
| 20 to 24 Minutes | 0 (0.0%) | 0 (0.0%) |
| 25 to 29 Minutes | 0 (0.0%) | 0 (0.0%) |
| 30 to 34 Minutes | 20 (4.6%) | 0 (0.0%) |
| 35 to 39 Minutes | 0 (0.0%) | 0 (0.0%) |
| 40 to 44 Minutes | 0 (0.0%) | 0 (0.0%) |
| 45 to 59 Minutes | 0 (0.0%) | 0 (0.0%) |
| 60 to 89 Minutes | 52 (12.1%) | 30 (36.6%) |
| 90 or more Minutes | 0 (0.0%) | 0 (0.0%) |
Time of Departure to Work by Sex in Stateline
The most frequent times of departure to work in Stateline are 12:00 AM to 4:59 AM (132, 30.6%) for males and 8:00 AM to 8:29 AM (40, 48.8%) for females.
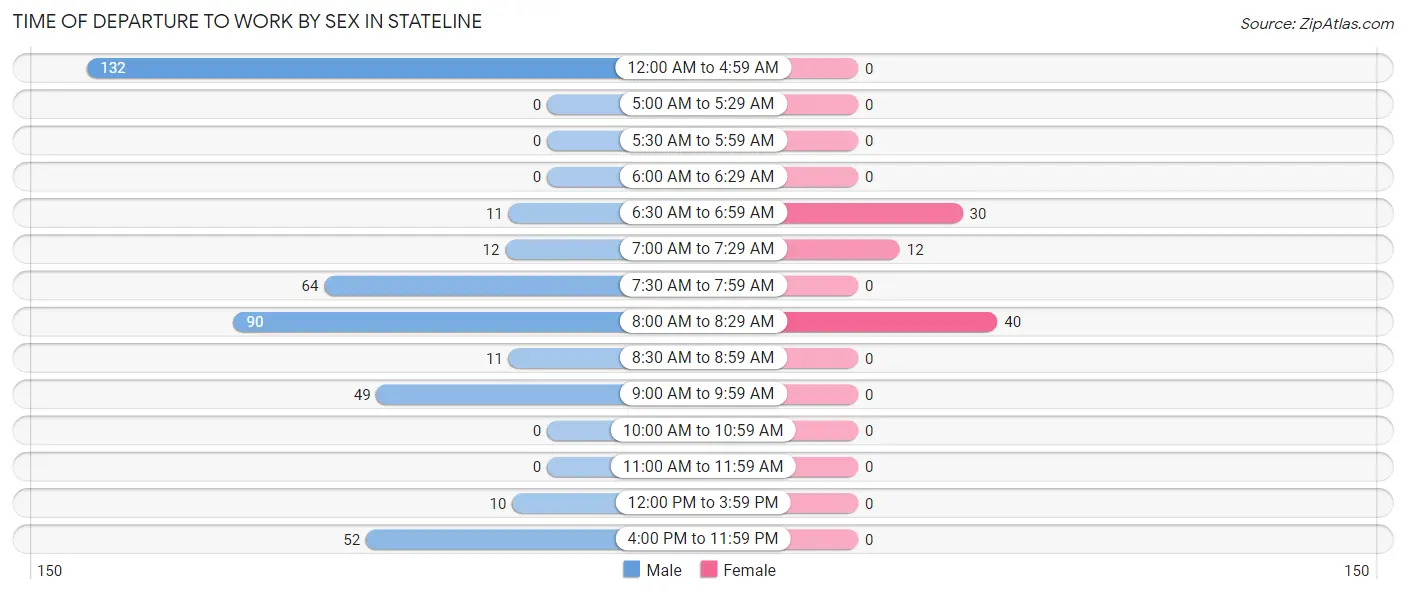
| Time of Departure | Male | Female |
| 12:00 AM to 4:59 AM | 132 (30.6%) | 0 (0.0%) |
| 5:00 AM to 5:29 AM | 0 (0.0%) | 0 (0.0%) |
| 5:30 AM to 5:59 AM | 0 (0.0%) | 0 (0.0%) |
| 6:00 AM to 6:29 AM | 0 (0.0%) | 0 (0.0%) |
| 6:30 AM to 6:59 AM | 11 (2.5%) | 30 (36.6%) |
| 7:00 AM to 7:29 AM | 12 (2.8%) | 12 (14.6%) |
| 7:30 AM to 7:59 AM | 64 (14.8%) | 0 (0.0%) |
| 8:00 AM to 8:29 AM | 90 (20.9%) | 40 (48.8%) |
| 8:30 AM to 8:59 AM | 11 (2.5%) | 0 (0.0%) |
| 9:00 AM to 9:59 AM | 49 (11.4%) | 0 (0.0%) |
| 10:00 AM to 10:59 AM | 0 (0.0%) | 0 (0.0%) |
| 11:00 AM to 11:59 AM | 0 (0.0%) | 0 (0.0%) |
| 12:00 PM to 3:59 PM | 10 (2.3%) | 0 (0.0%) |
| 4:00 PM to 11:59 PM | 52 (12.1%) | 0 (0.0%) |
| Total | 431 (100.0%) | 82 (100.0%) |
Housing Occupancy in Stateline
Occupancy by Ownership in Stateline
Of the total 405 dwellings in Stateline, owner-occupied units account for 33 (8.2%), while renter-occupied units make up 372 (91.8%).
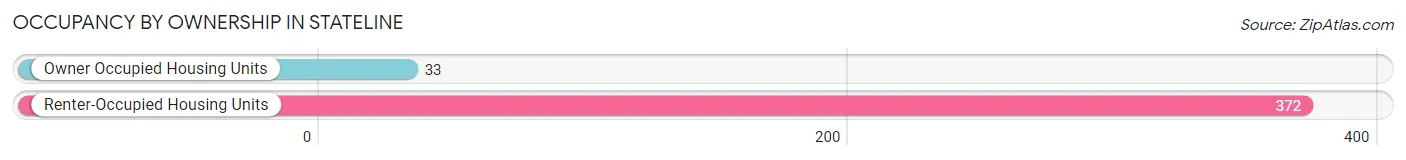
| Occupancy | # Housing Units | % Housing Units |
| Owner Occupied Housing Units | 33 | 8.2% |
| Renter-Occupied Housing Units | 372 | 91.8% |
| Total Occupied Housing Units | 405 | 100.0% |
Occupancy by Household Size in Stateline
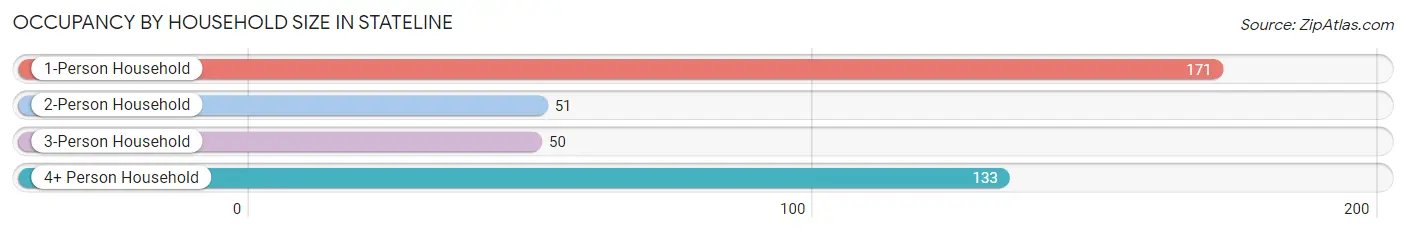
| Household Size | # Housing Units | % Housing Units |
| 1-Person Household | 171 | 42.2% |
| 2-Person Household | 51 | 12.6% |
| 3-Person Household | 50 | 12.3% |
| 4+ Person Household | 133 | 32.8% |
| Total Housing Units | 405 | 100.0% |
Occupancy by Ownership by Household Size in Stateline
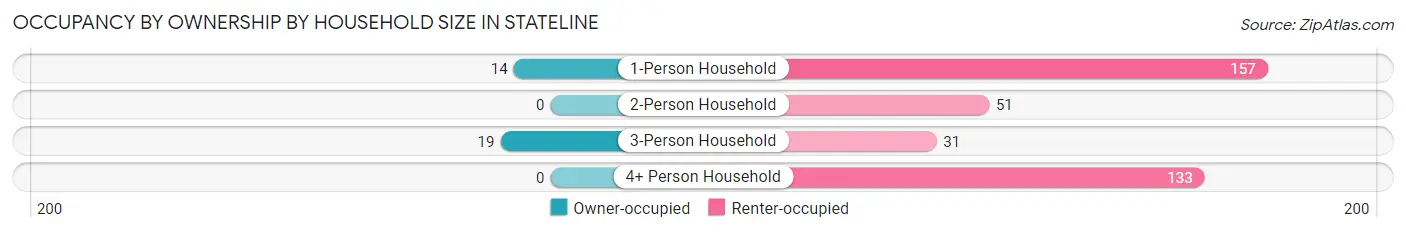
| Household Size | Owner-occupied | Renter-occupied |
| 1-Person Household | 14 (8.2%) | 157 (91.8%) |
| 2-Person Household | 0 (0.0%) | 51 (100.0%) |
| 3-Person Household | 19 (38.0%) | 31 (62.0%) |
| 4+ Person Household | 0 (0.0%) | 133 (100.0%) |
| Total Housing Units | 33 (8.2%) | 372 (91.8%) |
Occupancy by Educational Attainment in Stateline
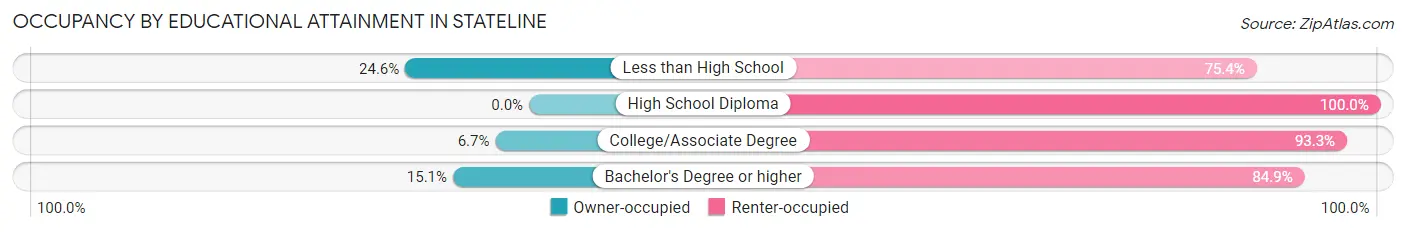
| Household Size | Owner-occupied | Renter-occupied |
| Less than High School | 14 (24.6%) | 43 (75.4%) |
| High School Diploma | 0 (0.0%) | 130 (100.0%) |
| College/Associate Degree | 11 (6.7%) | 154 (93.3%) |
| Bachelor's Degree or higher | 8 (15.1%) | 45 (84.9%) |
Occupancy by Age of Householder in Stateline
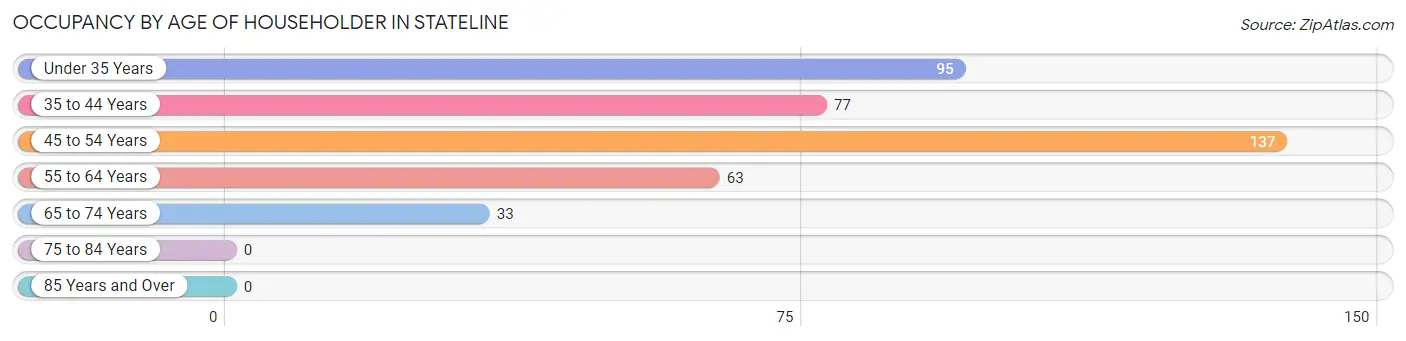
| Age Bracket | # Households | % Households |
| Under 35 Years | 95 | 23.5% |
| 35 to 44 Years | 77 | 19.0% |
| 45 to 54 Years | 137 | 33.8% |
| 55 to 64 Years | 63 | 15.6% |
| 65 to 74 Years | 33 | 8.2% |
| 75 to 84 Years | 0 | 0.0% |
| 85 Years and Over | 0 | 0.0% |
| Total | 405 | 100.0% |
Housing Finances in Stateline
Median Income by Occupancy in Stateline
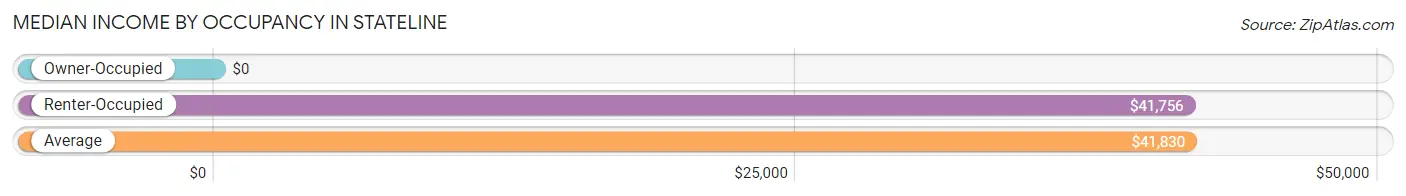
| Occupancy Type | # Households | Median Income |
| Owner-Occupied | 33 (8.2%) | $0 |
| Renter-Occupied | 372 (91.8%) | $41,756 |
| Average | 405 (100.0%) | $41,830 |
Occupancy by Householder Income Bracket in Stateline
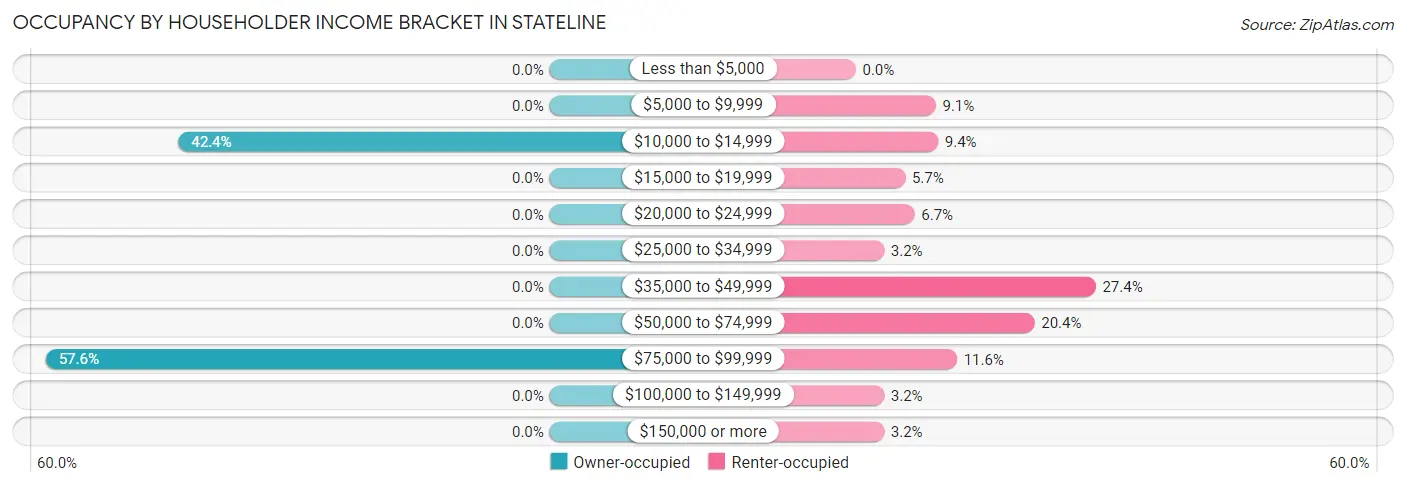
| Income Bracket | Owner-occupied | Renter-occupied |
| Less than $5,000 | 0 (0.0%) | 0 (0.0%) |
| $5,000 to $9,999 | 0 (0.0%) | 34 (9.1%) |
| $10,000 to $14,999 | 14 (42.4%) | 35 (9.4%) |
| $15,000 to $19,999 | 0 (0.0%) | 21 (5.7%) |
| $20,000 to $24,999 | 0 (0.0%) | 25 (6.7%) |
| $25,000 to $34,999 | 0 (0.0%) | 12 (3.2%) |
| $35,000 to $49,999 | 0 (0.0%) | 102 (27.4%) |
| $50,000 to $74,999 | 0 (0.0%) | 76 (20.4%) |
| $75,000 to $99,999 | 19 (57.6%) | 43 (11.6%) |
| $100,000 to $149,999 | 0 (0.0%) | 12 (3.2%) |
| $150,000 or more | 0 (0.0%) | 12 (3.2%) |
| Total | 33 (100.0%) | 372 (100.0%) |
Monthly Housing Cost Tiers in Stateline
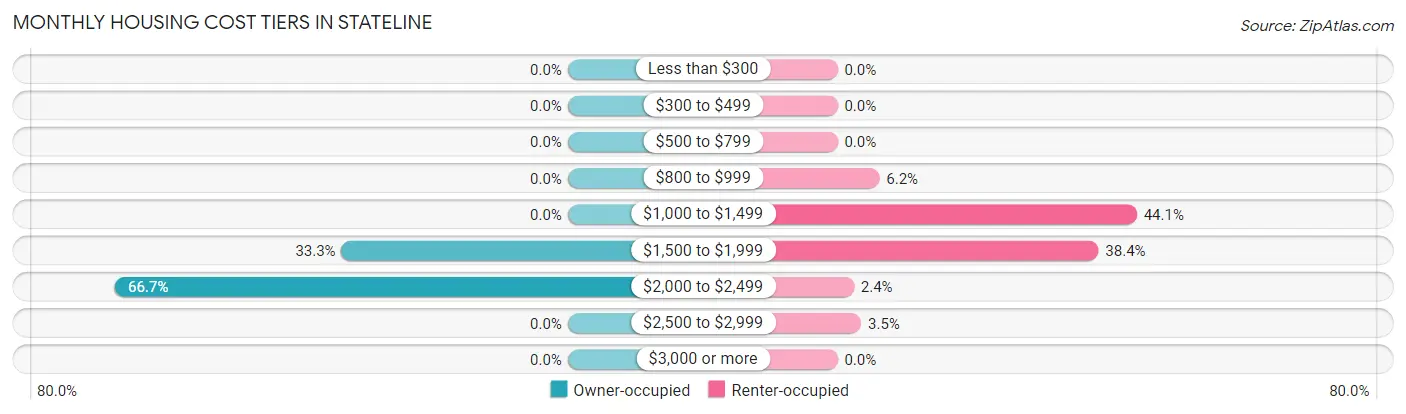
| Monthly Cost | Owner-occupied | Renter-occupied |
| Less than $300 | 0 (0.0%) | 0 (0.0%) |
| $300 to $499 | 0 (0.0%) | 0 (0.0%) |
| $500 to $799 | 0 (0.0%) | 0 (0.0%) |
| $800 to $999 | 0 (0.0%) | 23 (6.2%) |
| $1,000 to $1,499 | 0 (0.0%) | 164 (44.1%) |
| $1,500 to $1,999 | 11 (33.3%) | 143 (38.4%) |
| $2,000 to $2,499 | 22 (66.7%) | 9 (2.4%) |
| $2,500 to $2,999 | 0 (0.0%) | 13 (3.5%) |
| $3,000 or more | 0 (0.0%) | 0 (0.0%) |
| Total | 33 (100.0%) | 372 (100.0%) |
Physical Housing Characteristics in Stateline
Housing Structures in Stateline
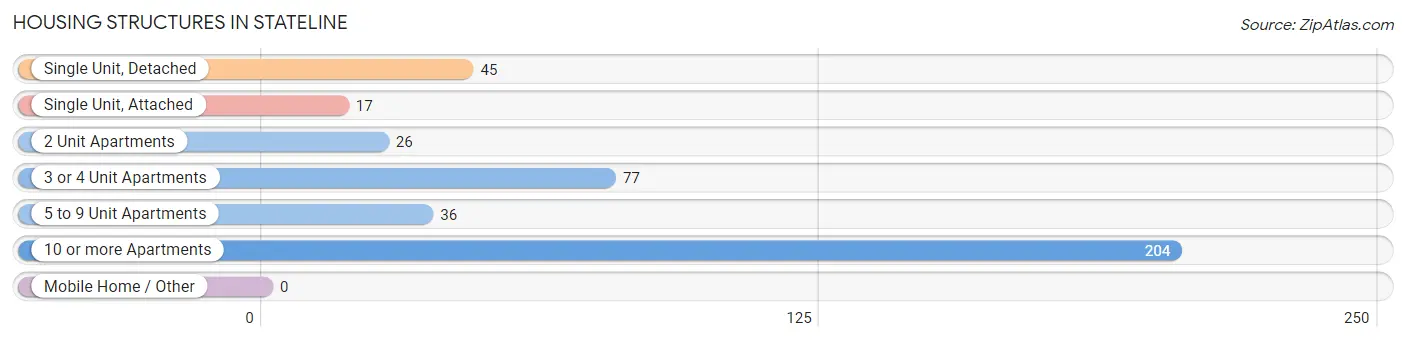
| Structure Type | # Housing Units | % Housing Units |
| Single Unit, Detached | 45 | 11.1% |
| Single Unit, Attached | 17 | 4.2% |
| 2 Unit Apartments | 26 | 6.4% |
| 3 or 4 Unit Apartments | 77 | 19.0% |
| 5 to 9 Unit Apartments | 36 | 8.9% |
| 10 or more Apartments | 204 | 50.4% |
| Mobile Home / Other | 0 | 0.0% |
| Total | 405 | 100.0% |
Housing Structures by Occupancy in Stateline

| Structure Type | Owner-occupied | Renter-occupied |
| Single Unit, Detached | 11 (24.4%) | 34 (75.6%) |
| Single Unit, Attached | 8 (47.1%) | 9 (52.9%) |
| 2 Unit Apartments | 14 (53.8%) | 12 (46.2%) |
| 3 or 4 Unit Apartments | 0 (0.0%) | 77 (100.0%) |
| 5 to 9 Unit Apartments | 0 (0.0%) | 36 (100.0%) |
| 10 or more Apartments | 0 (0.0%) | 204 (100.0%) |
| Mobile Home / Other | 0 (0.0%) | 0 (0.0%) |
| Total | 33 (8.2%) | 372 (91.8%) |
Housing Structures by Number of Rooms in Stateline
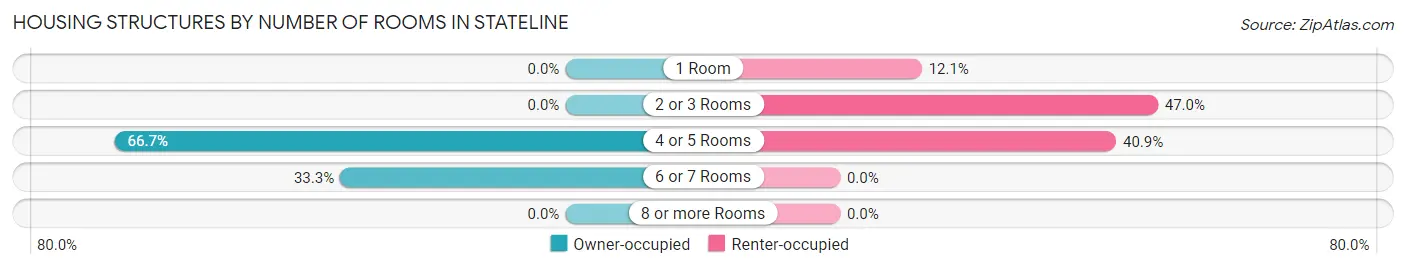
| Number of Rooms | Owner-occupied | Renter-occupied |
| 1 Room | 0 (0.0%) | 45 (12.1%) |
| 2 or 3 Rooms | 0 (0.0%) | 175 (47.0%) |
| 4 or 5 Rooms | 22 (66.7%) | 152 (40.9%) |
| 6 or 7 Rooms | 11 (33.3%) | 0 (0.0%) |
| 8 or more Rooms | 0 (0.0%) | 0 (0.0%) |
| Total | 33 (100.0%) | 372 (100.0%) |
Housing Structure by Heating Type in Stateline
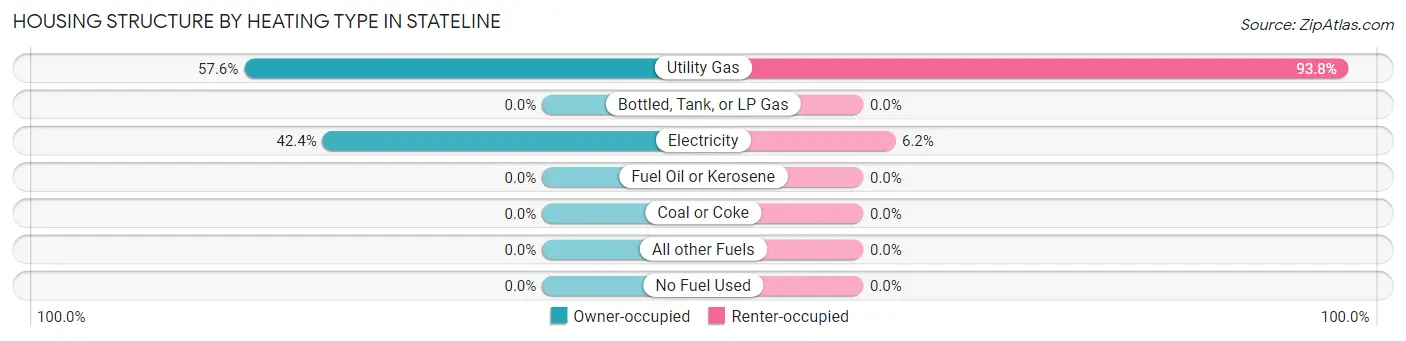
| Heating Type | Owner-occupied | Renter-occupied |
| Utility Gas | 19 (57.6%) | 349 (93.8%) |
| Bottled, Tank, or LP Gas | 0 (0.0%) | 0 (0.0%) |
| Electricity | 14 (42.4%) | 23 (6.2%) |
| Fuel Oil or Kerosene | 0 (0.0%) | 0 (0.0%) |
| Coal or Coke | 0 (0.0%) | 0 (0.0%) |
| All other Fuels | 0 (0.0%) | 0 (0.0%) |
| No Fuel Used | 0 (0.0%) | 0 (0.0%) |
| Total | 33 (100.0%) | 372 (100.0%) |
Household Vehicle Usage in Stateline
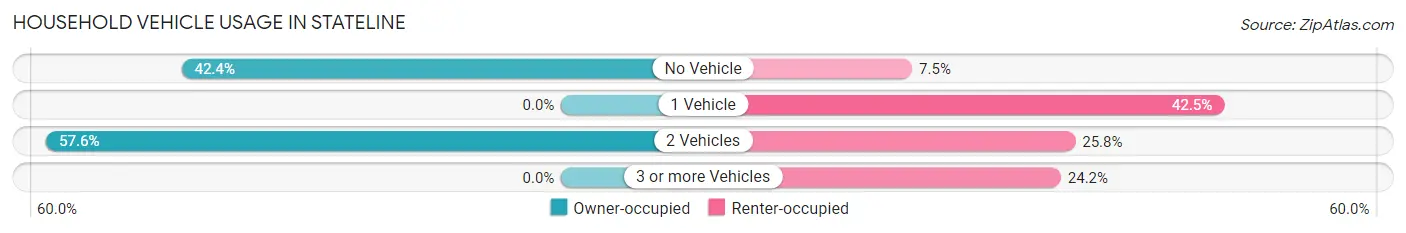
| Vehicles per Household | Owner-occupied | Renter-occupied |
| No Vehicle | 14 (42.4%) | 28 (7.5%) |
| 1 Vehicle | 0 (0.0%) | 158 (42.5%) |
| 2 Vehicles | 19 (57.6%) | 96 (25.8%) |
| 3 or more Vehicles | 0 (0.0%) | 90 (24.2%) |
| Total | 33 (100.0%) | 372 (100.0%) |
Real Estate & Mortgages in Stateline
Real Estate and Mortgage Overview in Stateline
| Characteristic | Without Mortgage | With Mortgage |
| Housing Units | 14 | 19 |
| Median Property Value | - | - |
| Median Household Income | - | - |
| Monthly Housing Costs | - | - |
| Real Estate Taxes | - | - |
Property Value by Mortgage Status in Stateline
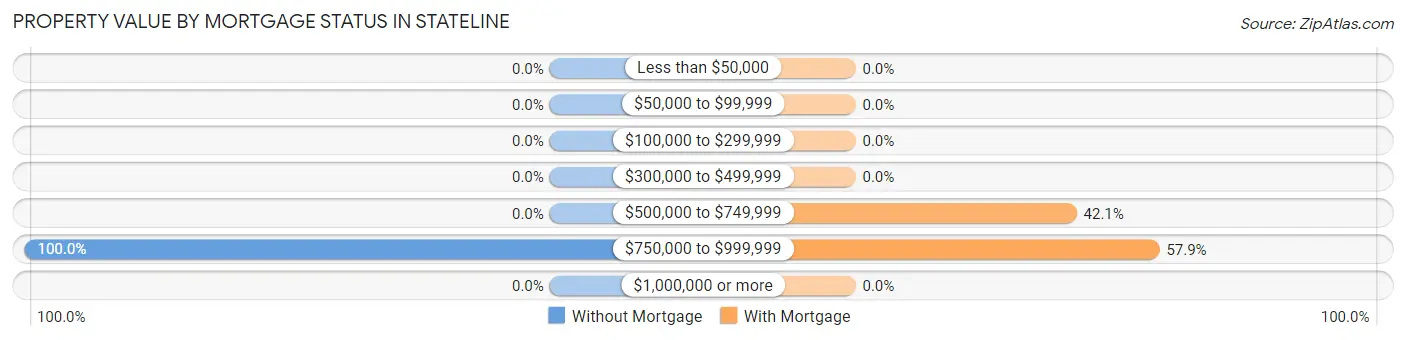
| Property Value | Without Mortgage | With Mortgage |
| Less than $50,000 | 0 (0.0%) | 0 (0.0%) |
| $50,000 to $99,999 | 0 (0.0%) | 0 (0.0%) |
| $100,000 to $299,999 | 0 (0.0%) | 0 (0.0%) |
| $300,000 to $499,999 | 0 (0.0%) | 0 (0.0%) |
| $500,000 to $749,999 | 0 (0.0%) | 8 (42.1%) |
| $750,000 to $999,999 | 14 (100.0%) | 11 (57.9%) |
| $1,000,000 or more | 0 (0.0%) | 0 (0.0%) |
| Total | 14 (100.0%) | 19 (100.0%) |
Household Income by Mortgage Status in Stateline
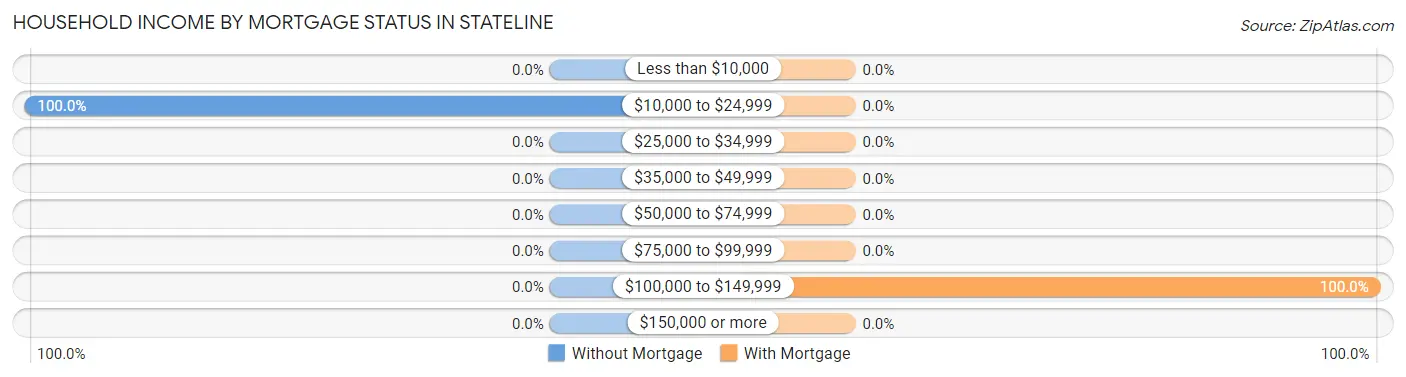
| Household Income | Without Mortgage | With Mortgage |
| Less than $10,000 | 0 (0.0%) | 0 (0.0%) |
| $10,000 to $24,999 | 14 (100.0%) | 0 (0.0%) |
| $25,000 to $34,999 | 0 (0.0%) | 0 (0.0%) |
| $35,000 to $49,999 | 0 (0.0%) | 0 (0.0%) |
| $50,000 to $74,999 | 0 (0.0%) | 0 (0.0%) |
| $75,000 to $99,999 | 0 (0.0%) | 0 (0.0%) |
| $100,000 to $149,999 | 0 (0.0%) | 19 (100.0%) |
| $150,000 or more | 0 (0.0%) | 0 (0.0%) |
| Total | 14 (100.0%) | 19 (100.0%) |
Property Value to Household Income Ratio in Stateline
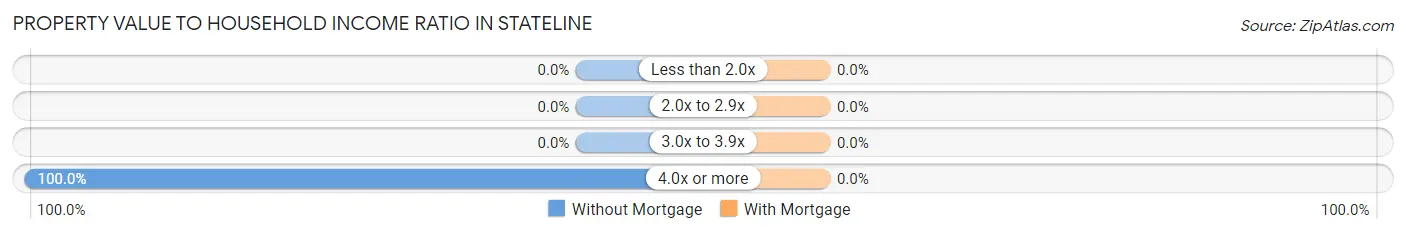
| Value-to-Income Ratio | Without Mortgage | With Mortgage |
| Less than 2.0x | 0 (0.0%) | 0 (0.0%) |
| 2.0x to 2.9x | 0 (0.0%) | 0 (0.0%) |
| 3.0x to 3.9x | 0 (0.0%) | 0 (0.0%) |
| 4.0x or more | 14 (100.0%) | 0 (0.0%) |
| Total | 14 (100.0%) | 19 (100.0%) |
Real Estate Taxes by Mortgage Status in Stateline
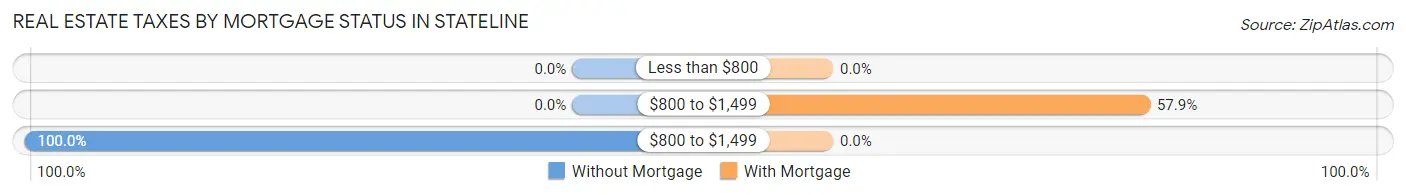
| Property Taxes | Without Mortgage | With Mortgage |
| Less than $800 | 0 (0.0%) | 0 (0.0%) |
| $800 to $1,499 | 0 (0.0%) | 11 (57.9%) |
| $800 to $1,499 | 14 (100.0%) | 0 (0.0%) |
| Total | 14 (100.0%) | 19 (100.0%) |
Health & Disability in Stateline
Health Insurance Coverage by Age in Stateline
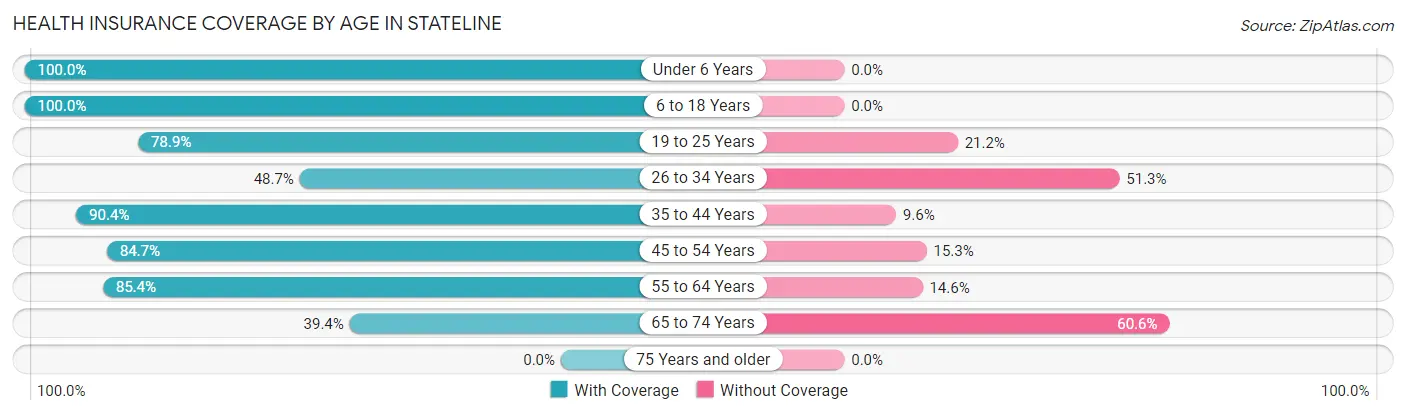
| Age Bracket | With Coverage | Without Coverage |
| Under 6 Years | 124 (100.0%) | 0 (0.0%) |
| 6 to 18 Years | 110 (100.0%) | 0 (0.0%) |
| 19 to 25 Years | 41 (78.8%) | 11 (21.1%) |
| 26 to 34 Years | 131 (48.7%) | 138 (51.3%) |
| 35 to 44 Years | 94 (90.4%) | 10 (9.6%) |
| 45 to 54 Years | 127 (84.7%) | 23 (15.3%) |
| 55 to 64 Years | 82 (85.4%) | 14 (14.6%) |
| 65 to 74 Years | 13 (39.4%) | 20 (60.6%) |
| 75 Years and older | 0 (0.0%) | 0 (0.0%) |
| Total | 722 (77.0%) | 216 (23.0%) |
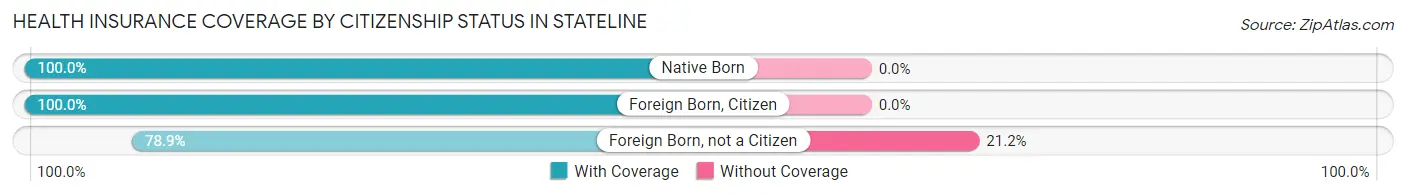
Health Insurance Coverage by Citizenship Status in Stateline
| Citizenship Status | With Coverage | Without Coverage |
| Native Born | 124 (100.0%) | 0 (0.0%) |
| Foreign Born, Citizen | 110 (100.0%) | 0 (0.0%) |
| Foreign Born, not a Citizen | 41 (78.8%) | 11 (21.1%) |
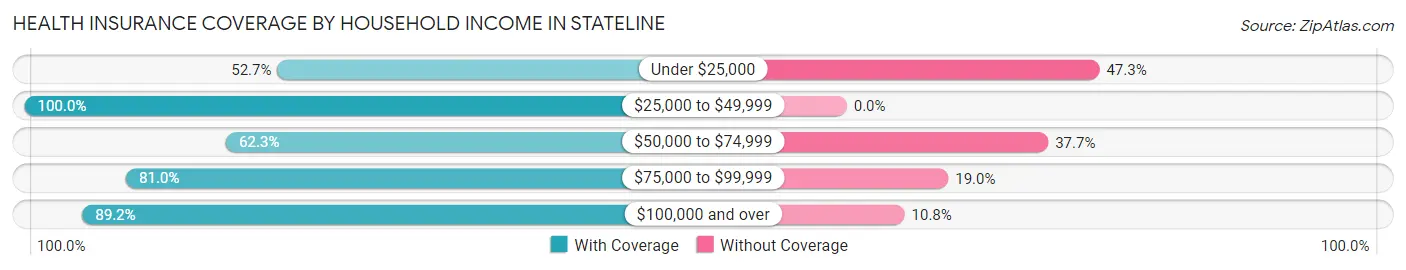
Health Insurance Coverage by Household Income in Stateline
| Household Income | With Coverage | Without Coverage |
| Under $25,000 | 89 (52.7%) | 80 (47.3%) |
| $25,000 to $49,999 | 195 (100.0%) | 0 (0.0%) |
| $50,000 to $74,999 | 132 (62.3%) | 80 (37.7%) |
| $75,000 to $99,999 | 166 (81.0%) | 39 (19.0%) |
| $100,000 and over | 140 (89.2%) | 17 (10.8%) |
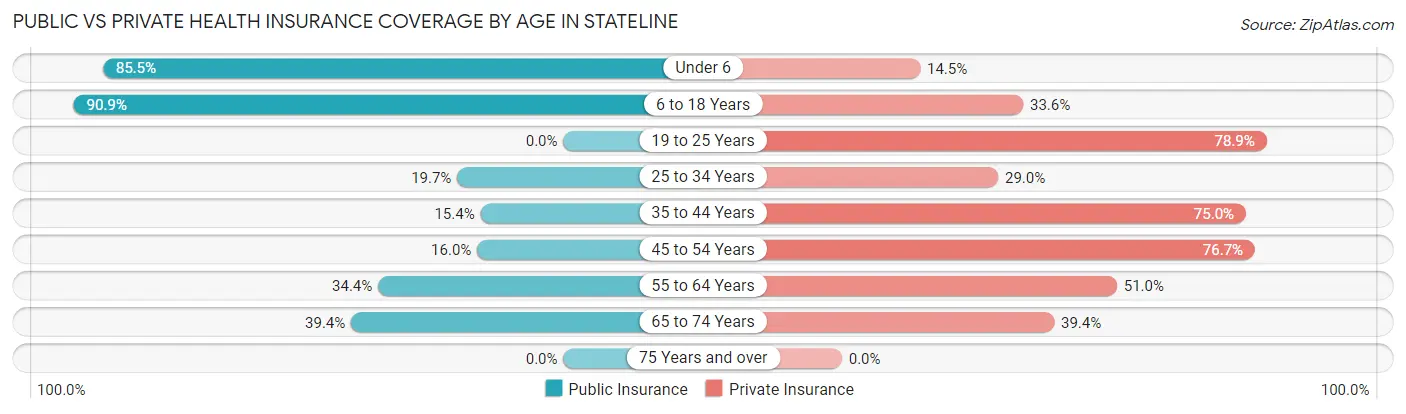
Public vs Private Health Insurance Coverage by Age in Stateline
| Age Bracket | Public Insurance | Private Insurance |
| Under 6 | 106 (85.5%) | 18 (14.5%) |
| 6 to 18 Years | 100 (90.9%) | 37 (33.6%) |
| 19 to 25 Years | 0 (0.0%) | 41 (78.8%) |
| 25 to 34 Years | 53 (19.7%) | 78 (29.0%) |
| 35 to 44 Years | 16 (15.4%) | 78 (75.0%) |
| 45 to 54 Years | 24 (16.0%) | 115 (76.7%) |
| 55 to 64 Years | 33 (34.4%) | 49 (51.0%) |
| 65 to 74 Years | 13 (39.4%) | 13 (39.4%) |
| 75 Years and over | 0 (0.0%) | 0 (0.0%) |
| Total | 345 (36.8%) | 429 (45.7%) |
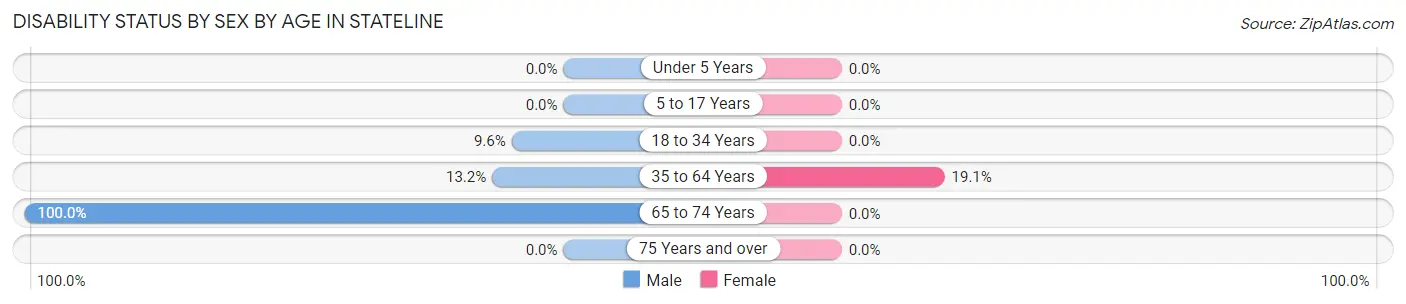
Disability Status by Sex by Age in Stateline
| Age Bracket | Male | Female |
| Under 5 Years | 0 (0.0%) | 0 (0.0%) |
| 5 to 17 Years | 0 (0.0%) | 0 (0.0%) |
| 18 to 34 Years | 28 (9.6%) | 0 (0.0%) |
| 35 to 64 Years | 29 (13.2%) | 25 (19.1%) |
| 65 to 74 Years | 20 (100.0%) | 0 (0.0%) |
| 75 Years and over | 0 (0.0%) | 0 (0.0%) |
Disability Class by Sex by Age in Stateline
Disability Class: Hearing Difficulty
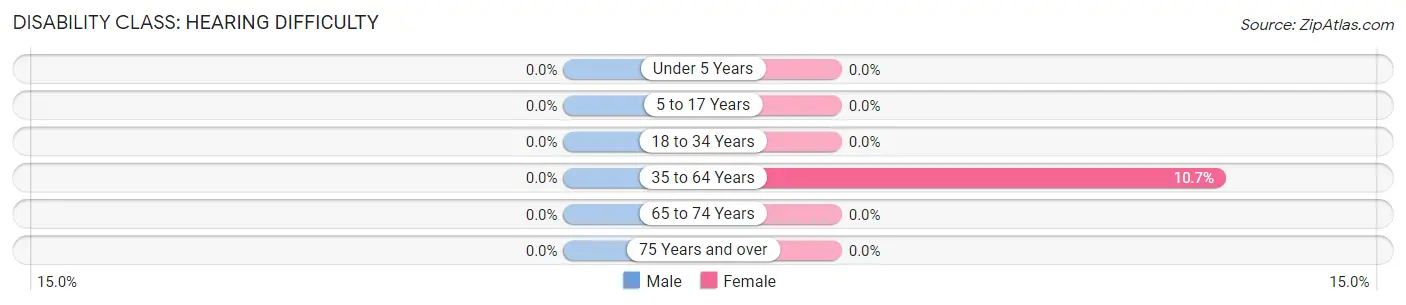
| Age Bracket | Male | Female |
| Under 5 Years | 0 (0.0%) | 0 (0.0%) |
| 5 to 17 Years | 0 (0.0%) | 0 (0.0%) |
| 18 to 34 Years | 0 (0.0%) | 0 (0.0%) |
| 35 to 64 Years | 0 (0.0%) | 14 (10.7%) |
| 65 to 74 Years | 0 (0.0%) | 0 (0.0%) |
| 75 Years and over | 0 (0.0%) | 0 (0.0%) |
Disability Class: Vision Difficulty
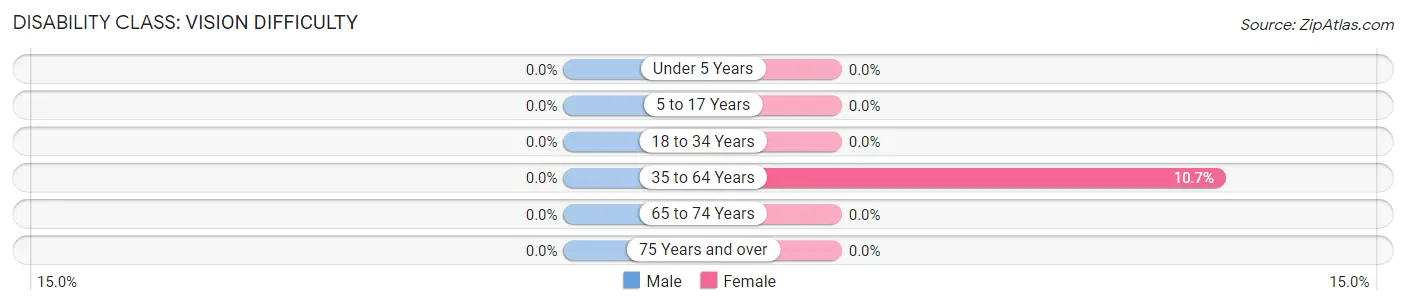
| Age Bracket | Male | Female |
| Under 5 Years | 0 (0.0%) | 0 (0.0%) |
| 5 to 17 Years | 0 (0.0%) | 0 (0.0%) |
| 18 to 34 Years | 0 (0.0%) | 0 (0.0%) |
| 35 to 64 Years | 0 (0.0%) | 14 (10.7%) |
| 65 to 74 Years | 0 (0.0%) | 0 (0.0%) |
| 75 Years and over | 0 (0.0%) | 0 (0.0%) |
Disability Class: Cognitive Difficulty
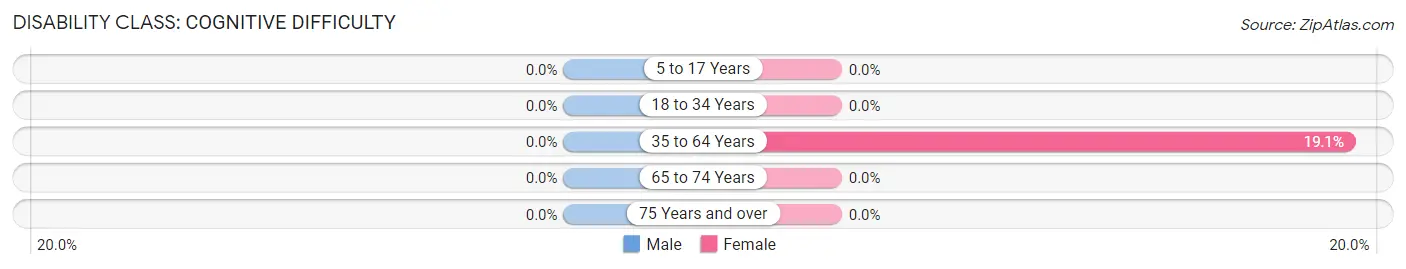
| Age Bracket | Male | Female |
| 5 to 17 Years | 0 (0.0%) | 0 (0.0%) |
| 18 to 34 Years | 0 (0.0%) | 0 (0.0%) |
| 35 to 64 Years | 0 (0.0%) | 25 (19.1%) |
| 65 to 74 Years | 0 (0.0%) | 0 (0.0%) |
| 75 Years and over | 0 (0.0%) | 0 (0.0%) |
Disability Class: Ambulatory Difficulty
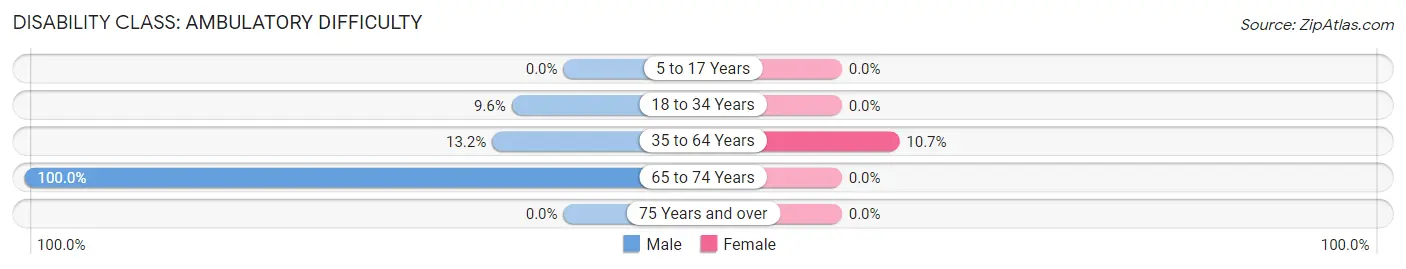
| Age Bracket | Male | Female |
| 5 to 17 Years | 0 (0.0%) | 0 (0.0%) |
| 18 to 34 Years | 28 (9.6%) | 0 (0.0%) |
| 35 to 64 Years | 29 (13.2%) | 14 (10.7%) |
| 65 to 74 Years | 20 (100.0%) | 0 (0.0%) |
| 75 Years and over | 0 (0.0%) | 0 (0.0%) |
Disability Class: Self-Care Difficulty
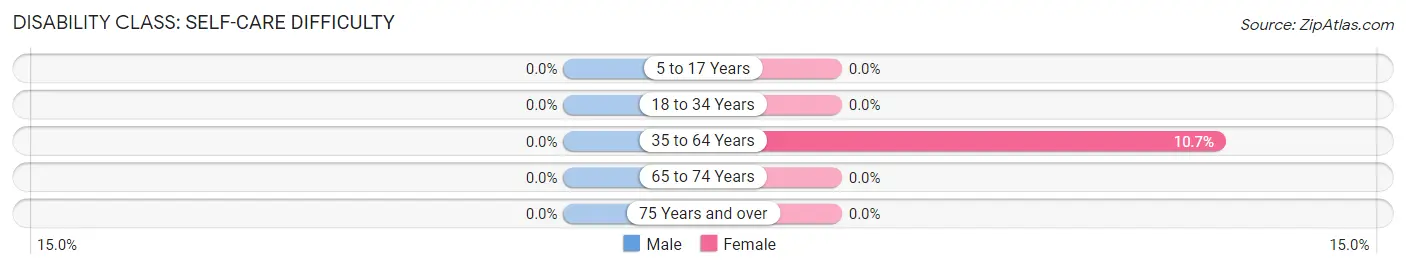
| Age Bracket | Male | Female |
| 5 to 17 Years | 0 (0.0%) | 0 (0.0%) |
| 18 to 34 Years | 0 (0.0%) | 0 (0.0%) |
| 35 to 64 Years | 0 (0.0%) | 14 (10.7%) |
| 65 to 74 Years | 0 (0.0%) | 0 (0.0%) |
| 75 Years and over | 0 (0.0%) | 0 (0.0%) |
Technology Access in Stateline
Computing Device Access in Stateline
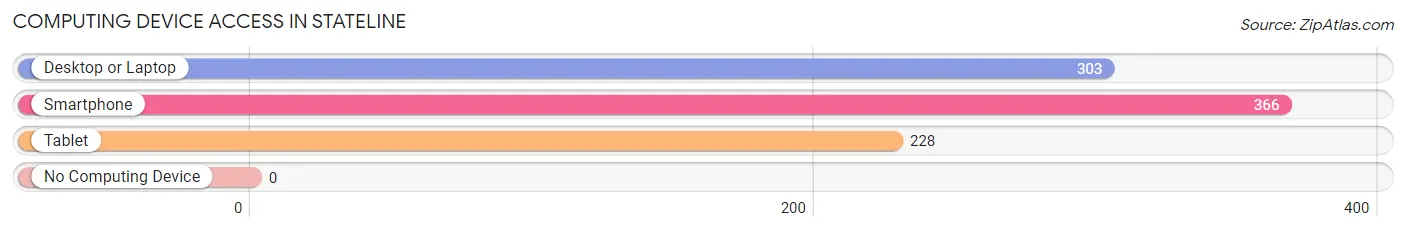
| Device Type | # Households | % Households |
| Desktop or Laptop | 303 | 74.8% |
| Smartphone | 366 | 90.4% |
| Tablet | 228 | 56.3% |
| No Computing Device | 0 | 0.0% |
| Total | 405 | 100.0% |
Internet Access in Stateline
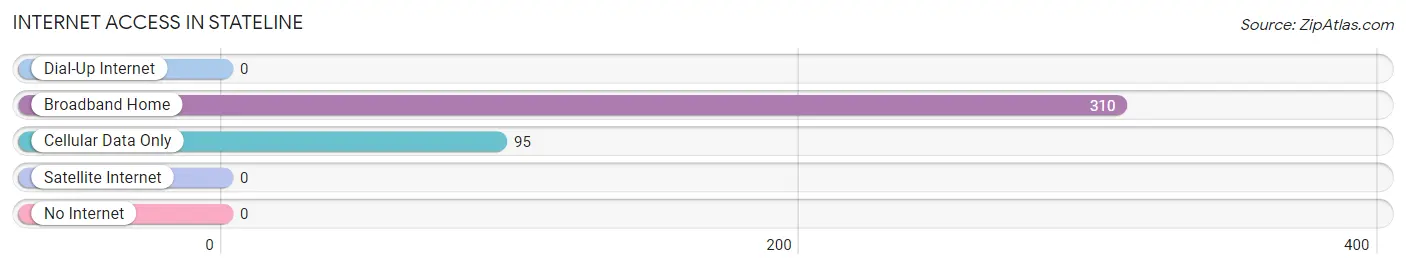
| Internet Type | # Households | % Households |
| Dial-Up Internet | 0 | 0.0% |
| Broadband Home | 310 | 76.5% |
| Cellular Data Only | 95 | 23.5% |
| Satellite Internet | 0 | 0.0% |
| No Internet | 0 | 0.0% |
| Total | 405 | 100.0% |
Stateline Summary
Stateline, Nevada is a small town located in Douglas County, Nevada, on the south shore of Lake Tahoe. It is the largest town in the county and is home to a population of approximately 8,000 people. The town is located on the Nevada-California border and is a popular tourist destination due to its proximity to the lake and its many ski resorts.
History
Stateline was first established in the late 1800s as a small mining town. The town was originally called Meyers Station, after the Meyers family who owned the land. The town was renamed Stateline in 1887 when the Nevada-California border was established. The town was a popular destination for miners and prospectors looking to strike it rich in the area.
In the early 1900s, Stateline began to transition from a mining town to a tourist destination. The town was home to several resorts, including the Tahoe Tavern, which was built in 1906. The town also became a popular destination for gambling, as Nevada legalized gambling in 1931.
Geography
Stateline is located in Douglas County, Nevada, on the south shore of Lake Tahoe. The town is situated at an elevation of 6,225 feet and is surrounded by the Sierra Nevada mountain range. The town is located on the Nevada-California border and is approximately 22 miles south of Carson City, the state capital.
The town is located in a temperate climate, with warm summers and cold winters. The average high temperature in the summer is around 80 degrees Fahrenheit, while the average low temperature in the winter is around 20 degrees Fahrenheit.
Economy
Stateline’s economy is largely driven by tourism. The town is home to several ski resorts, including Heavenly Mountain Resort and Sierra-at-Tahoe. The town is also home to several casinos, including Harrah’s Lake Tahoe and MontBleu Resort Casino & Spa.
In addition to tourism, Stateline is home to several businesses, including restaurants, retail stores, and other services. The town is also home to several manufacturing companies, including a furniture factory and a printing company.
Demographics
As of the 2010 census, Stateline had a population of 8,039 people. The population is predominantly white (83.3%), with smaller percentages of Hispanic (7.2%), African American (2.2%), and Asian (2.1%) residents. The median household income in the town is $50,945, and the median age is 44.7 years.
Stateline is a small town with a rich history and a vibrant economy. The town is a popular tourist destination due to its proximity to Lake Tahoe and its many ski resorts. The town is also home to several businesses and manufacturing companies, making it a great place to live and work.
Common Questions
What is Per Capita Income in Stateline?
Per Capita income in Stateline is $22,640.
What is the Median Family Income in Stateline?
Median Family Income in Stateline is $51,696.
What is the Median Household income in Stateline?
Median Household Income in Stateline is $41,830.
What is Income or Wage Gap in Stateline?
Income or Wage Gap in Stateline is 17.6%.
Women in Stateline earn 82.4 cents for every dollar earned by a man.
What is Inequality or Gini Index in Stateline?
Inequality or Gini Index in Stateline is 0.39.
What is the Total Population of Stateline?
Total Population of Stateline is 938.
What is the Total Male Population of Stateline?
Total Male Population of Stateline is 627.
What is the Total Female Population of Stateline?
Total Female Population of Stateline is 311.
What is the Ratio of Males per 100 Females in Stateline?
There are 201.61 Males per 100 Females in Stateline.
What is the Ratio of Females per 100 Males in Stateline?
There are 49.60 Females per 100 Males in Stateline.
What is the Median Population Age in Stateline?
Median Population Age in Stateline is 33.3 Years.
What is the Average Family Size in Stateline
Average Family Size in Stateline is 3.2 People.
What is the Average Household Size in Stateline
Average Household Size in Stateline is 2.3 People.
How Large is the Labor Force in Stateline?
There are 550 People in the Labor Forcein in Stateline.
What is the Percentage of People in the Labor Force in Stateline?
75.2% of People are in the Labor Force in Stateline.
What is the Unemployment Rate in Stateline?
Unemployment Rate in Stateline is 2.0%.