Nixon, NV Map & Demographics
Nixon Map
Nixon Overview
$14,446
PER CAPITA INCOME
$68,017
AVG FAMILY INCOME
$67,608
AVG HOUSEHOLD INCOME
25.0%
WAGE / INCOME GAP [ % ]
75.0¢/ $1
WAGE / INCOME GAP [ $ ]
0.32
INEQUALITY / GINI INDEX
348
TOTAL POPULATION
149
MALE POPULATION
199
FEMALE POPULATION
74.87
MALES / 100 FEMALES
133.56
FEMALES / 100 MALES
34.6
MEDIAN AGE
2.6
AVG FAMILY SIZE
2.4
AVG HOUSEHOLD SIZE
122
LABOR FORCE [ PEOPLE ]
46.4%
PERCENT IN LABOR FORCE
36.9%
UNEMPLOYMENT RATE
Nixon Zip Codes
Nixon Area Codes
Income in Nixon
Income Overview in Nixon
Per Capita Income in Nixon is $14,446, while median incomes of families and households are $68,017 and $67,608 respectively.
| Characteristic | Number | Measure |
| Per Capita Income | 348 | $14,446 |
| Median Family Income | 110 | $68,017 |
| Mean Family Income | 110 | $51,026 |
| Median Household Income | 147 | $67,608 |
| Mean Household Income | 147 | $49,385 |
| Income Deficit | 110 | $0 |
| Wage / Income Gap (%) | 348 | 25.00% |
| Wage / Income Gap ($) | 348 | 75.00¢ per $1 |
| Gini / Inequality Index | 348 | 0.32 |
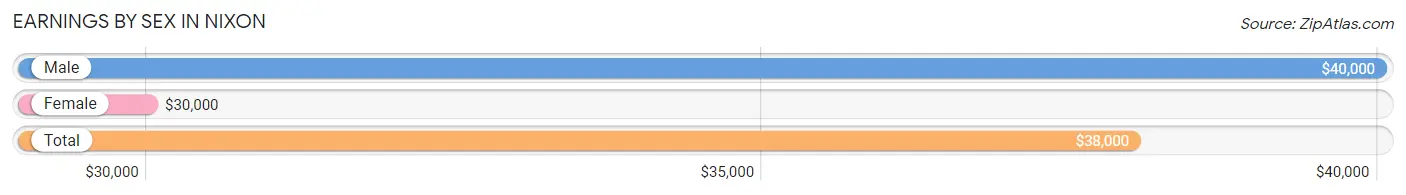
Earnings by Sex in Nixon
Average Earnings in Nixon are $38,000, $40,000 for men and $30,000 for women, a difference of 25.0%.
| Sex | Number | Average Earnings |
| Male | 60 (58.8%) | $40,000 |
| Female | 42 (41.2%) | $30,000 |
| Total | 102 (100.0%) | $38,000 |
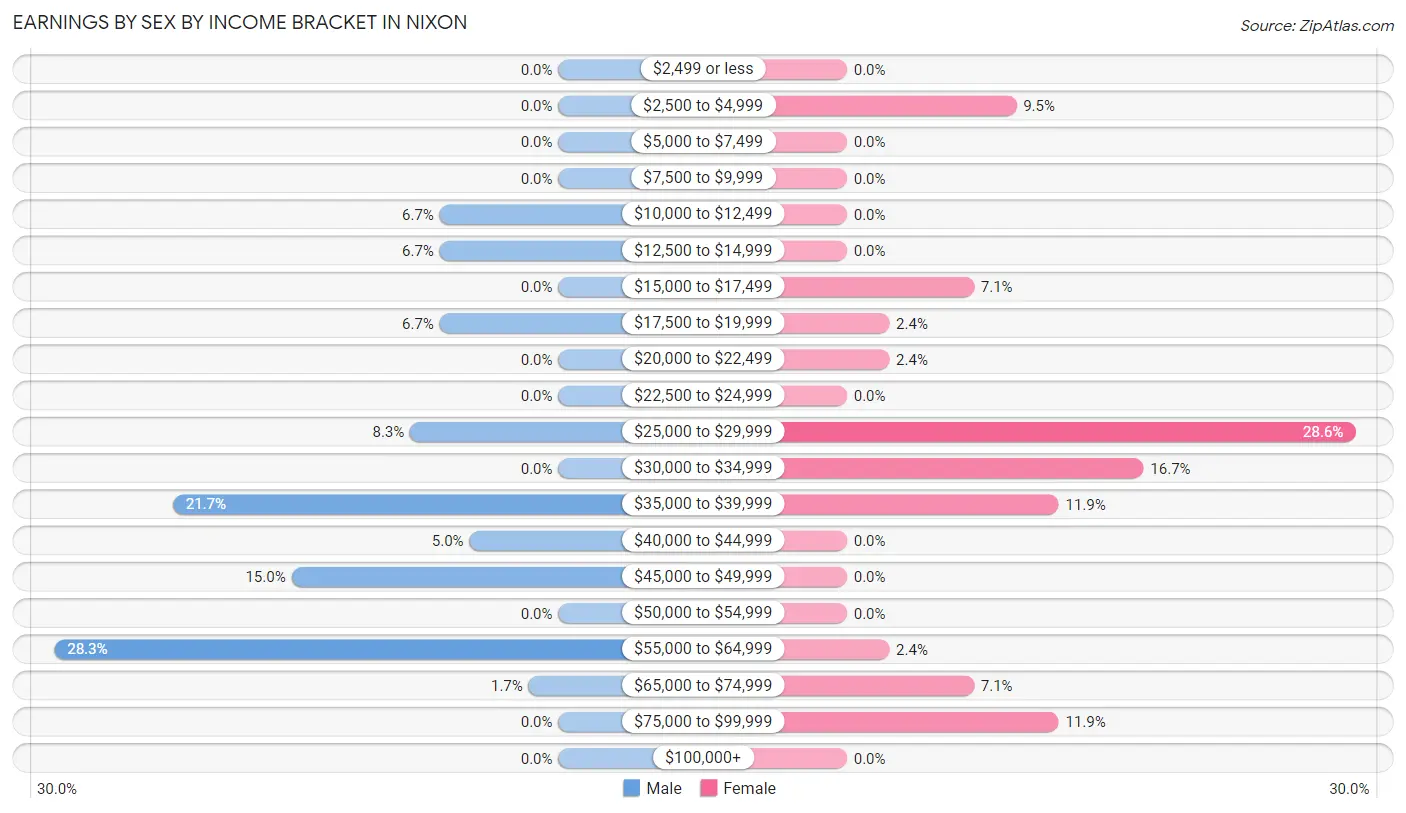
Earnings by Sex by Income Bracket in Nixon
The most common earnings brackets in Nixon are $55,000 to $64,999 for men (17 | 28.3%) and $25,000 to $29,999 for women (12 | 28.6%).
| Income | Male | Female |
| $2,499 or less | 0 (0.0%) | 0 (0.0%) |
| $2,500 to $4,999 | 0 (0.0%) | 4 (9.5%) |
| $5,000 to $7,499 | 0 (0.0%) | 0 (0.0%) |
| $7,500 to $9,999 | 0 (0.0%) | 0 (0.0%) |
| $10,000 to $12,499 | 4 (6.7%) | 0 (0.0%) |
| $12,500 to $14,999 | 4 (6.7%) | 0 (0.0%) |
| $15,000 to $17,499 | 0 (0.0%) | 3 (7.1%) |
| $17,500 to $19,999 | 4 (6.7%) | 1 (2.4%) |
| $20,000 to $22,499 | 0 (0.0%) | 1 (2.4%) |
| $22,500 to $24,999 | 0 (0.0%) | 0 (0.0%) |
| $25,000 to $29,999 | 5 (8.3%) | 12 (28.6%) |
| $30,000 to $34,999 | 0 (0.0%) | 7 (16.7%) |
| $35,000 to $39,999 | 13 (21.7%) | 5 (11.9%) |
| $40,000 to $44,999 | 3 (5.0%) | 0 (0.0%) |
| $45,000 to $49,999 | 9 (15.0%) | 0 (0.0%) |
| $50,000 to $54,999 | 0 (0.0%) | 0 (0.0%) |
| $55,000 to $64,999 | 17 (28.3%) | 1 (2.4%) |
| $65,000 to $74,999 | 1 (1.7%) | 3 (7.1%) |
| $75,000 to $99,999 | 0 (0.0%) | 5 (11.9%) |
| $100,000+ | 0 (0.0%) | 0 (0.0%) |
| Total | 60 (100.0%) | 42 (100.0%) |
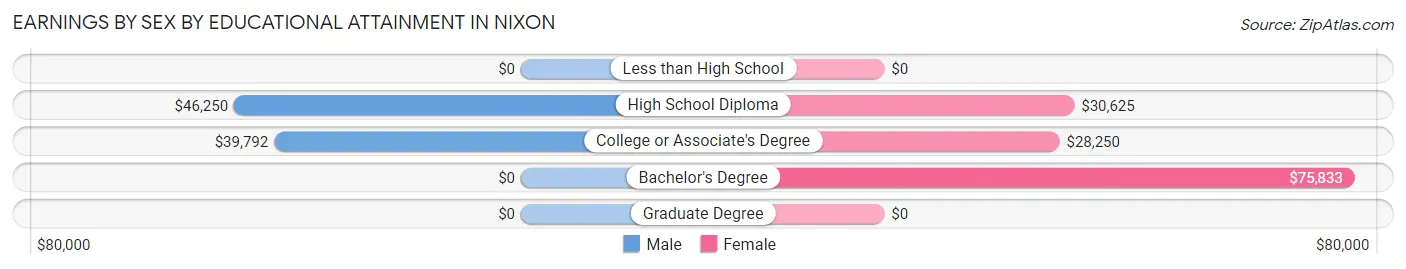
Earnings by Sex by Educational Attainment in Nixon
Average earnings in Nixon are $40,000 for men and $30,000 for women, a difference of 25.0%. Men with an educational attainment of high school diploma enjoy the highest average annual earnings of $46,250, while those with college or associate's degree education earn the least with $39,792. Women with an educational attainment of bachelor's degree earn the most with the average annual earnings of $75,833, while those with college or associate's degree education have the smallest earnings of $28,250.
| Educational Attainment | Male Income | Female Income |
| Less than High School | - | - |
| High School Diploma | $46,250 | $30,625 |
| College or Associate's Degree | $39,792 | $28,250 |
| Bachelor's Degree | - | - |
| Graduate Degree | - | - |
| Total | $40,000 | $30,000 |
Family Income in Nixon
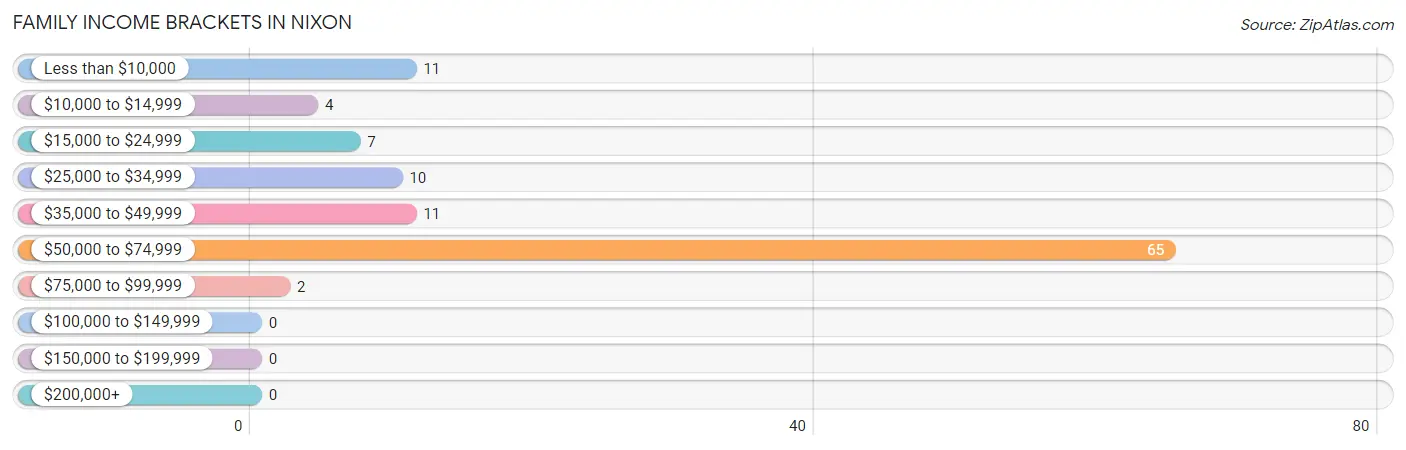
Family Income Brackets in Nixon
According to the Nixon family income data, there are 65 families falling into the $50,000 to $74,999 income range, which is the most common income bracket and makes up 59.1% of all families.
| Income Bracket | # Families | % Families |
| Less than $10,000 | 11 | 10.0% |
| $10,000 to $14,999 | 4 | 3.6% |
| $15,000 to $24,999 | 7 | 6.4% |
| $25,000 to $34,999 | 10 | 9.1% |
| $35,000 to $49,999 | 11 | 10.0% |
| $50,000 to $74,999 | 65 | 59.1% |
| $75,000 to $99,999 | 2 | 1.8% |
| $100,000 to $149,999 | 0 | 0.0% |
| $150,000 to $199,999 | 0 | 0.0% |
| $200,000+ | 0 | 0.0% |
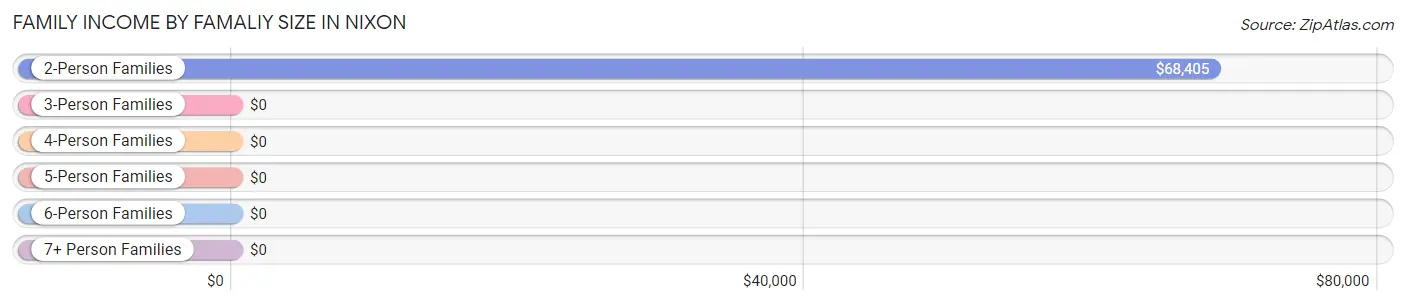
Family Income by Famaliy Size in Nixon
2-person families (78 | 70.9%) account for the highest median family income in Nixon with $68,405 per family, while 2-person families (78 | 70.9%) have the highest median income of $34,202 per family member.
| Income Bracket | # Families | Median Income |
| 2-Person Families | 78 (70.9%) | $68,405 |
| 3-Person Families | 13 (11.8%) | $0 |
| 4-Person Families | 10 (9.1%) | $0 |
| 5-Person Families | 7 (6.4%) | $0 |
| 6-Person Families | 0 (0.0%) | $0 |
| 7+ Person Families | 2 (1.8%) | $0 |
| Total | 110 (100.0%) | $68,017 |
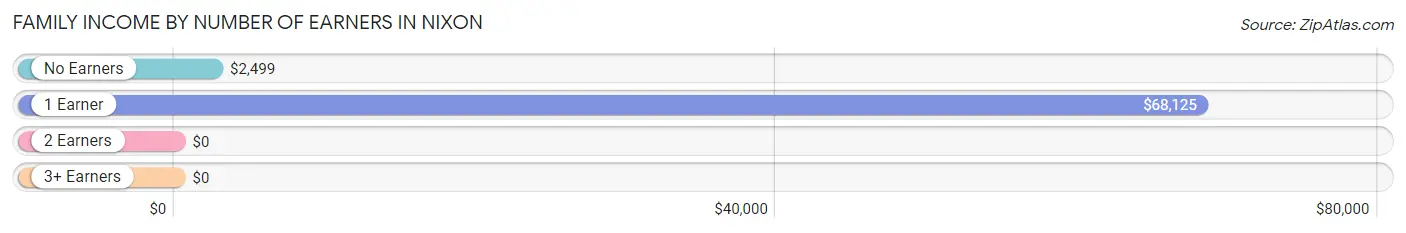
Family Income by Number of Earners in Nixon
| Number of Earners | # Families | Median Income |
| No Earners | 11 (10.0%) | $2,499 |
| 1 Earner | 93 (84.6%) | $68,125 |
| 2 Earners | 2 (1.8%) | $0 |
| 3+ Earners | 4 (3.6%) | $0 |
| Total | 110 (100.0%) | $68,017 |
Household Income in Nixon
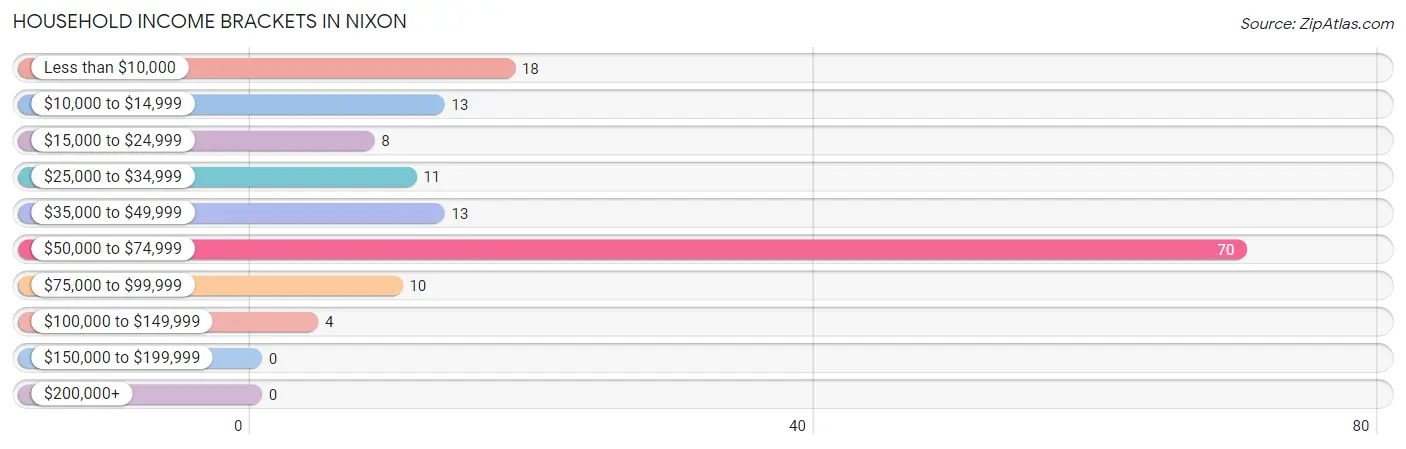
Household Income Brackets in Nixon
With 70 households falling in the category, the $50,000 to $74,999 income range is the most frequent in Nixon, accounting for 47.6% of all households.
| Income Bracket | # Households | % Households |
| Less than $10,000 | 18 | 12.2% |
| $10,000 to $14,999 | 13 | 8.8% |
| $15,000 to $24,999 | 8 | 5.4% |
| $25,000 to $34,999 | 11 | 7.5% |
| $35,000 to $49,999 | 13 | 8.8% |
| $50,000 to $74,999 | 70 | 47.6% |
| $75,000 to $99,999 | 10 | 6.8% |
| $100,000 to $149,999 | 4 | 2.7% |
| $150,000 to $199,999 | 0 | 0.0% |
| $200,000+ | 0 | 0.0% |
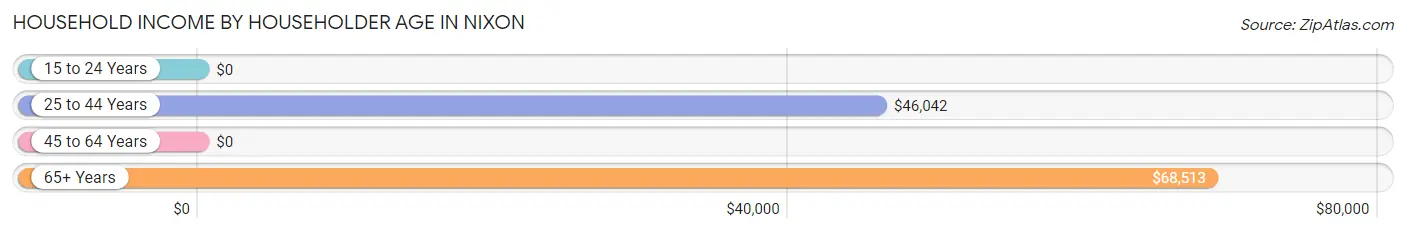
Household Income by Householder Age in Nixon
The median household income in Nixon is $67,608, with the highest median household income of $68,513 found in the 65+ years age bracket for the primary householder. A total of 77 households (52.4%) fall into this category.
| Income Bracket | # Households | Median Income |
| 15 to 24 Years | 0 (0.0%) | $0 |
| 25 to 44 Years | 41 (27.9%) | $46,042 |
| 45 to 64 Years | 29 (19.7%) | $0 |
| 65+ Years | 77 (52.4%) | $68,513 |
| Total | 147 (100.0%) | $67,608 |
Poverty in Nixon
Income Below Poverty by Sex and Age in Nixon
With 40.9% poverty level for males and 50.2% for females among the residents of Nixon, 5 year old males and 5 year old females are the most vulnerable to poverty, with 3 males (100.0%) and 2 females (100.0%) in their respective age groups living below the poverty level.
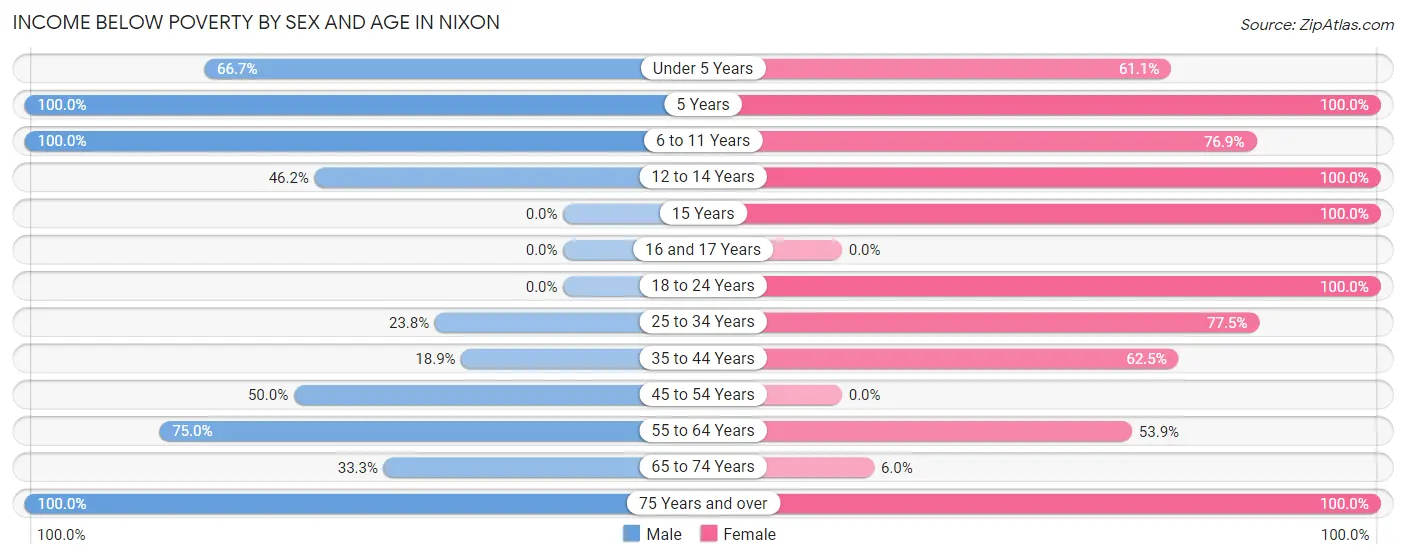
| Age Bracket | Male | Female |
| Under 5 Years | 14 (66.7%) | 11 (61.1%) |
| 5 Years | 3 (100.0%) | 2 (100.0%) |
| 6 to 11 Years | 6 (100.0%) | 10 (76.9%) |
| 12 to 14 Years | 6 (46.2%) | 6 (100.0%) |
| 15 Years | 0 (0.0%) | 3 (100.0%) |
| 16 and 17 Years | 0 (0.0%) | 0 (0.0%) |
| 18 to 24 Years | 0 (0.0%) | 13 (100.0%) |
| 25 to 34 Years | 5 (23.8%) | 31 (77.5%) |
| 35 to 44 Years | 7 (18.9%) | 10 (62.5%) |
| 45 to 54 Years | 4 (50.0%) | 0 (0.0%) |
| 55 to 64 Years | 6 (75.0%) | 7 (53.8%) |
| 65 to 74 Years | 2 (33.3%) | 4 (6.0%) |
| 75 Years and over | 8 (100.0%) | 3 (100.0%) |
| Total | 61 (40.9%) | 100 (50.2%) |
Income Above Poverty by Sex and Age in Nixon
According to the poverty statistics in Nixon, males aged 18 to 24 years and females aged 45 to 54 years are the age groups that are most secure financially, with 100.0% of males and 100.0% of females in these age groups living above the poverty line.
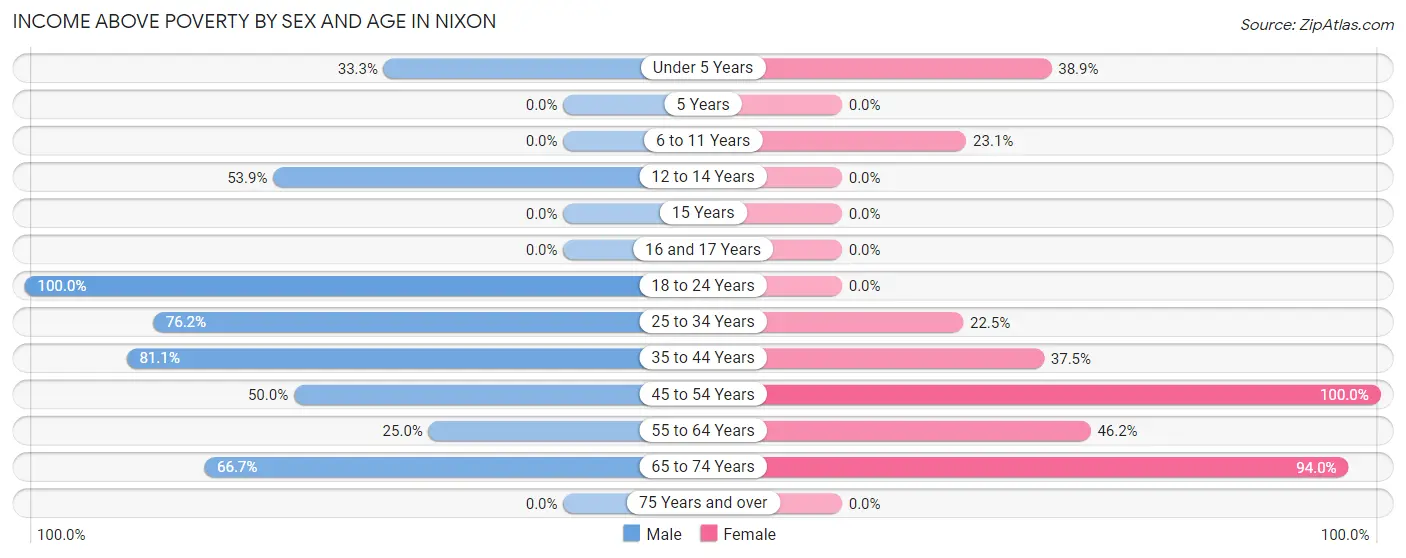
| Age Bracket | Male | Female |
| Under 5 Years | 7 (33.3%) | 7 (38.9%) |
| 5 Years | 0 (0.0%) | 0 (0.0%) |
| 6 to 11 Years | 0 (0.0%) | 3 (23.1%) |
| 12 to 14 Years | 7 (53.8%) | 0 (0.0%) |
| 15 Years | 0 (0.0%) | 0 (0.0%) |
| 16 and 17 Years | 0 (0.0%) | 0 (0.0%) |
| 18 to 24 Years | 18 (100.0%) | 0 (0.0%) |
| 25 to 34 Years | 16 (76.2%) | 9 (22.5%) |
| 35 to 44 Years | 30 (81.1%) | 6 (37.5%) |
| 45 to 54 Years | 4 (50.0%) | 5 (100.0%) |
| 55 to 64 Years | 2 (25.0%) | 6 (46.2%) |
| 65 to 74 Years | 4 (66.7%) | 63 (94.0%) |
| 75 Years and over | 0 (0.0%) | 0 (0.0%) |
| Total | 88 (59.1%) | 99 (49.7%) |
Income Below Poverty Among Married-Couple Families in Nixon
The poverty statistics for married-couple families in Nixon show that 64.7% or 11 of the total 17 families live below the poverty line. Families with 1 or 2 children have the highest poverty rate of 100.0%, comprising of 7 families. On the other hand, families with no children have the lowest poverty rate of 40.0%, which includes 4 families.
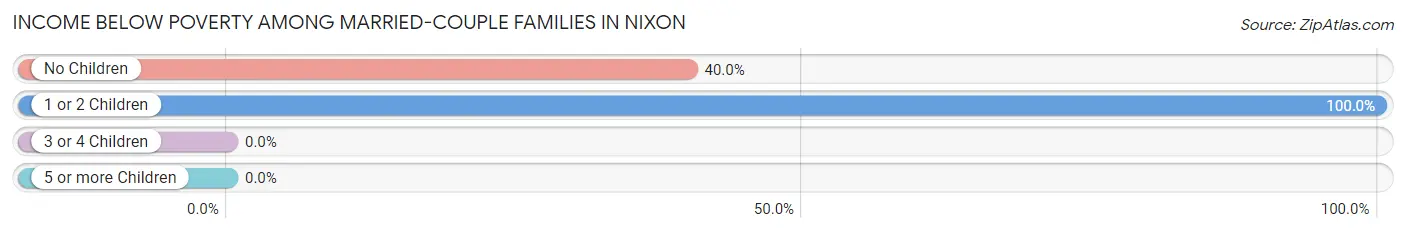
| Children | Above Poverty | Below Poverty |
| No Children | 6 (60.0%) | 4 (40.0%) |
| 1 or 2 Children | 0 (0.0%) | 7 (100.0%) |
| 3 or 4 Children | 0 (0.0%) | 0 (0.0%) |
| 5 or more Children | 0 (0.0%) | 0 (0.0%) |
| Total | 6 (35.3%) | 11 (64.7%) |
Income Below Poverty Among Single-Parent Households in Nixon
According to the poverty data in Nixon, 57.1% or 8 single-father households and 10.1% or 8 single-mother households are living below the poverty line. Among single-father households, those with 3 or 4 children have the highest poverty rate, with 4 households (100.0%) experiencing poverty. Likewise, among single-mother households, those with 5 or more children have the highest poverty rate, with 2 households (100.0%) falling below the poverty line.
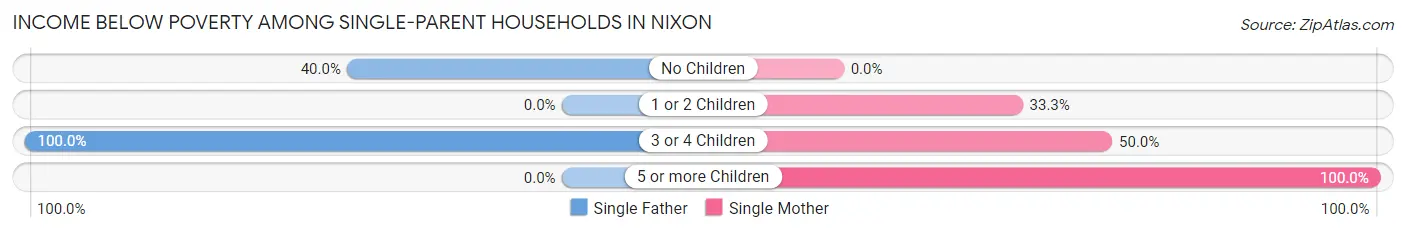
| Children | Single Father | Single Mother |
| No Children | 4 (40.0%) | 0 (0.0%) |
| 1 or 2 Children | 0 (0.0%) | 3 (33.3%) |
| 3 or 4 Children | 4 (100.0%) | 3 (50.0%) |
| 5 or more Children | 0 (0.0%) | 2 (100.0%) |
| Total | 8 (57.1%) | 8 (10.1%) |
Income Below Poverty Among Married-Couple vs Single-Parent Households in Nixon
The poverty data for Nixon shows that 11 of the married-couple family households (64.7%) and 16 of the single-parent households (17.2%) are living below the poverty level. Within the married-couple family households, those with 1 or 2 children have the highest poverty rate, with 7 households (100.0%) falling below the poverty line. Among the single-parent households, those with 5 or more children have the highest poverty rate, with 2 household (100.0%) living below poverty.
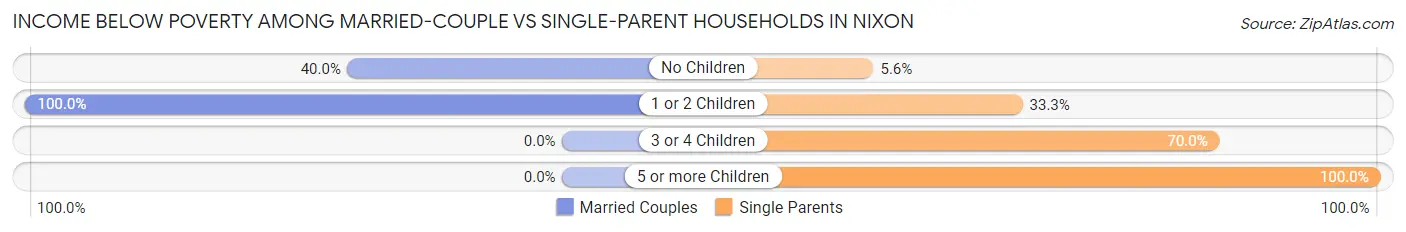
| Children | Married-Couple Families | Single-Parent Households |
| No Children | 4 (40.0%) | 4 (5.6%) |
| 1 or 2 Children | 7 (100.0%) | 3 (33.3%) |
| 3 or 4 Children | 0 (0.0%) | 7 (70.0%) |
| 5 or more Children | 0 (0.0%) | 2 (100.0%) |
| Total | 11 (64.7%) | 16 (17.2%) |
Race in Nixon
The most populous races in Nixon are Native / Alaskan (261 | 75.0%), Hispanic or Latino (60 | 17.2%), and White / Caucasian (27 | 7.8%).
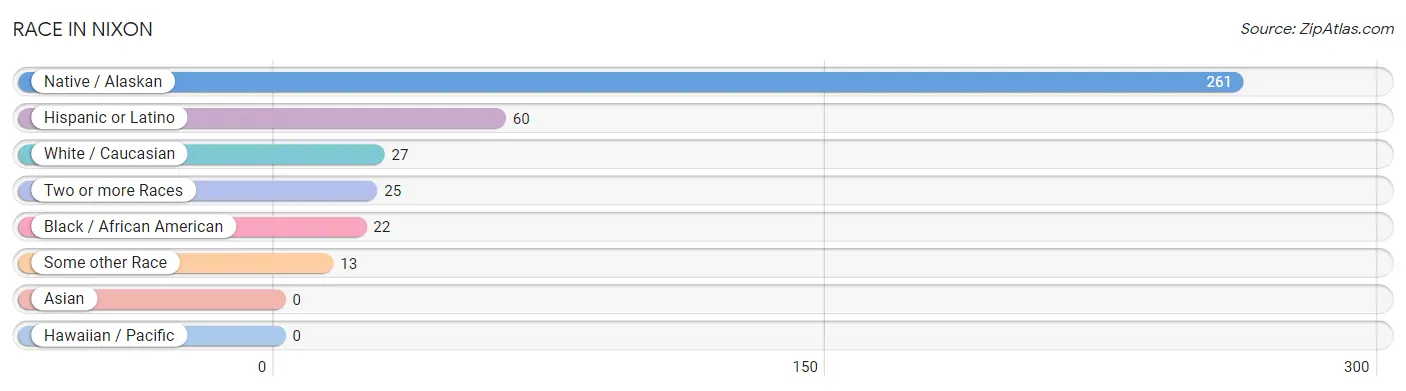
| Race | # Population | % Population |
| Asian | 0 | 0.0% |
| Black / African American | 22 | 6.3% |
| Hawaiian / Pacific | 0 | 0.0% |
| Hispanic or Latino | 60 | 17.2% |
| Native / Alaskan | 261 | 75.0% |
| White / Caucasian | 27 | 7.8% |
| Two or more Races | 25 | 7.2% |
| Some other Race | 13 | 3.7% |
| Total | 348 | 100.0% |
Ancestry in Nixon
The most populous ancestries reported in Nixon are Paiute (274 | 78.7%), Mexican (60 | 17.2%), English (11 | 3.2%), Scottish (4 | 1.1%), and Portuguese (3 | 0.9%), together accounting for 101.1% of all Nixon residents.
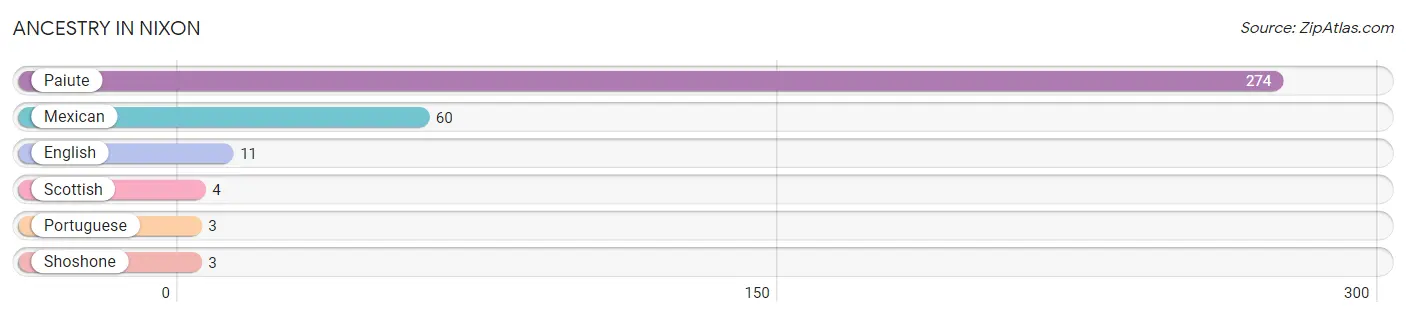
| Ancestry | # Population | % Population |
| English | 11 | 3.2% |
| Mexican | 60 | 17.2% |
| Paiute | 274 | 78.7% |
| Portuguese | 3 | 0.9% |
| Scottish | 4 | 1.1% |
| Shoshone | 3 | 0.9% | View All 6 Rows |
Immigrants in Nixon
The most numerous immigrant groups reported in Nixon came from Europe (3 | 0.9%), Portugal (3 | 0.9%), and Southern Europe (3 | 0.9%), together accounting for 2.6% of all Nixon residents.
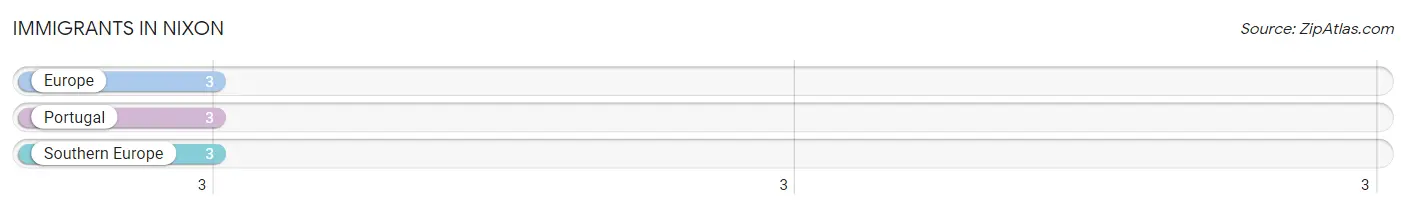
| Immigration Origin | # Population | % Population |
| Europe | 3 | 0.9% |
| Portugal | 3 | 0.9% |
| Southern Europe | 3 | 0.9% | View All 3 Rows |
Sex and Age in Nixon
Sex and Age in Nixon
The most populous age groups in Nixon are 35 to 39 Years (26 | 17.4%) for men and 65 to 69 Years (67 | 33.7%) for women.
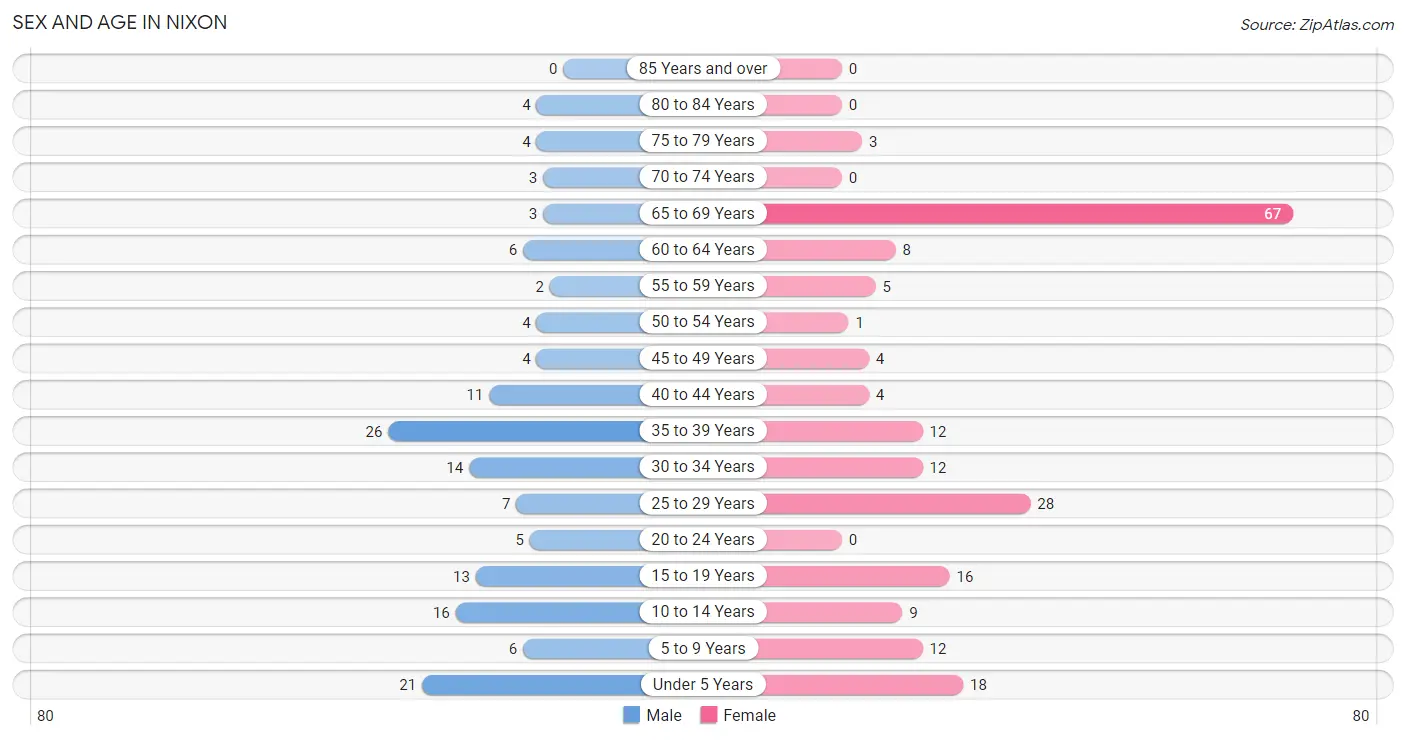
| Age Bracket | Male | Female |
| Under 5 Years | 21 (14.1%) | 18 (9.0%) |
| 5 to 9 Years | 6 (4.0%) | 12 (6.0%) |
| 10 to 14 Years | 16 (10.7%) | 9 (4.5%) |
| 15 to 19 Years | 13 (8.7%) | 16 (8.0%) |
| 20 to 24 Years | 5 (3.4%) | 0 (0.0%) |
| 25 to 29 Years | 7 (4.7%) | 28 (14.1%) |
| 30 to 34 Years | 14 (9.4%) | 12 (6.0%) |
| 35 to 39 Years | 26 (17.4%) | 12 (6.0%) |
| 40 to 44 Years | 11 (7.4%) | 4 (2.0%) |
| 45 to 49 Years | 4 (2.7%) | 4 (2.0%) |
| 50 to 54 Years | 4 (2.7%) | 1 (0.5%) |
| 55 to 59 Years | 2 (1.3%) | 5 (2.5%) |
| 60 to 64 Years | 6 (4.0%) | 8 (4.0%) |
| 65 to 69 Years | 3 (2.0%) | 67 (33.7%) |
| 70 to 74 Years | 3 (2.0%) | 0 (0.0%) |
| 75 to 79 Years | 4 (2.7%) | 3 (1.5%) |
| 80 to 84 Years | 4 (2.7%) | 0 (0.0%) |
| 85 Years and over | 0 (0.0%) | 0 (0.0%) |
| Total | 149 (100.0%) | 199 (100.0%) |
Families and Households in Nixon
Median Family Size in Nixon
The median family size in Nixon is 2.56 persons per family, with married-couple families (17 | 15.4%) accounting for the largest median family size of 4.47 persons per family. On the other hand, single female/mother families (79 | 71.8%) represent the smallest median family size with 2.10 persons per family.
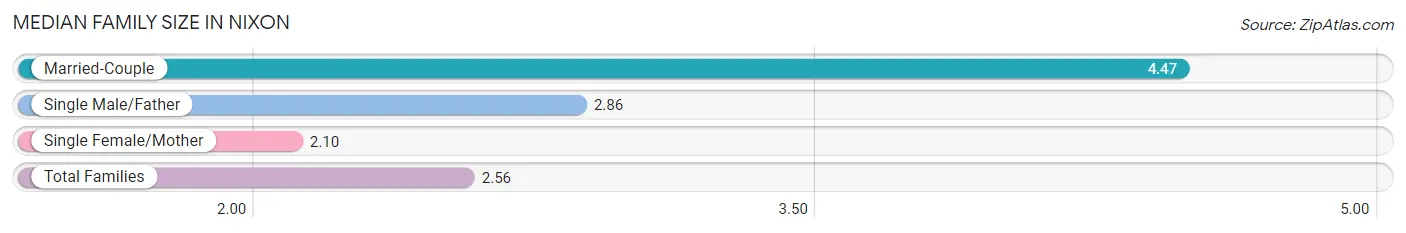
| Family Type | # Families | Family Size |
| Married-Couple | 17 (15.4%) | 4.47 |
| Single Male/Father | 14 (12.7%) | 2.86 |
| Single Female/Mother | 79 (71.8%) | 2.10 |
| Total Families | 110 (100.0%) | 2.56 |
Median Household Size in Nixon
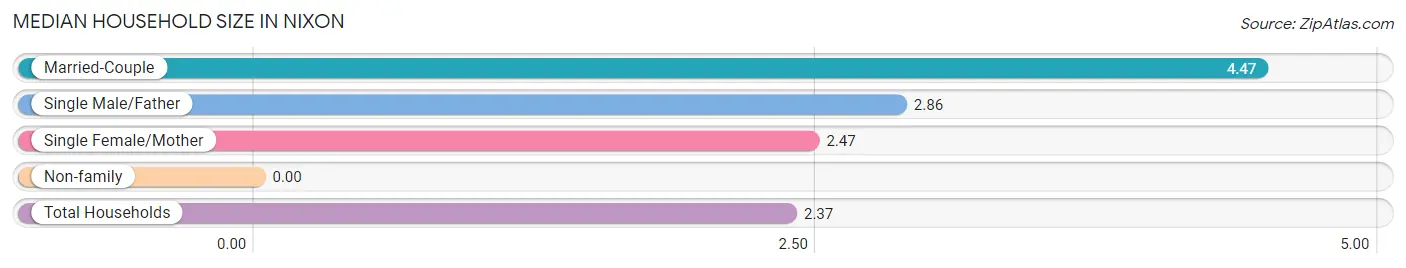
| Household Type | # Households | Household Size |
| Married-Couple | 17 (11.6%) | 4.47 |
| Single Male/Father | 14 (9.5%) | 2.86 |
| Single Female/Mother | 79 (53.7%) | 2.47 |
| Non-family | 37 (25.2%) | - |
| Total Households | 147 (100.0%) | 2.37 |
Household Size by Marriage Status in Nixon
Out of a total of 147 households in Nixon, 110 (74.8%) are family households, while 37 (25.2%) are nonfamily households. The most numerous type of family households are 2-person households, comprising 74, and the most common type of nonfamily households are 1-person households, comprising 37.
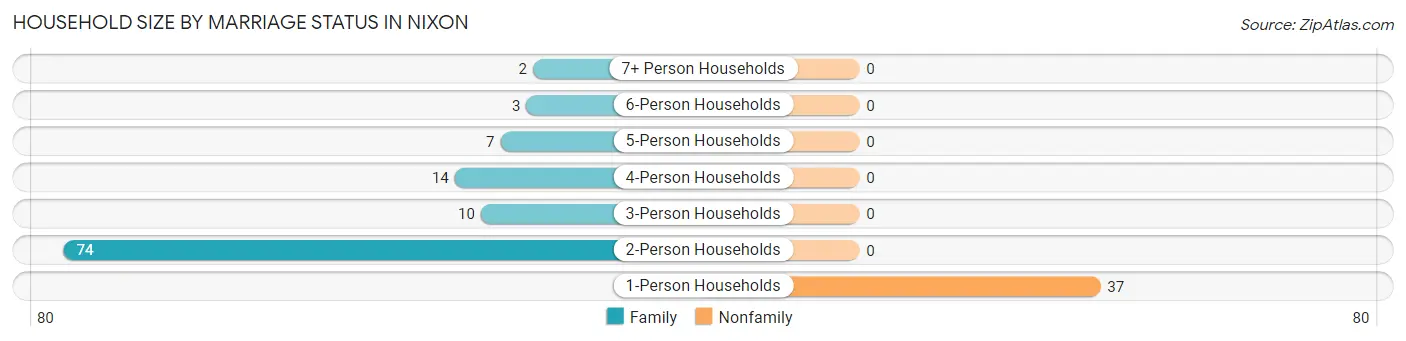
| Household Size | Family Households | Nonfamily Households |
| 1-Person Households | - | 37 (25.2%) |
| 2-Person Households | 74 (50.3%) | 0 (0.0%) |
| 3-Person Households | 10 (6.8%) | 0 (0.0%) |
| 4-Person Households | 14 (9.5%) | 0 (0.0%) |
| 5-Person Households | 7 (4.8%) | 0 (0.0%) |
| 6-Person Households | 3 (2.0%) | 0 (0.0%) |
| 7+ Person Households | 2 (1.4%) | 0 (0.0%) |
| Total | 110 (74.8%) | 37 (25.2%) |
Female Fertility in Nixon
Fertility by Age in Nixon
Average fertility rate in Nixon is 118.0 births per 1,000 women. Women in the age bracket of 20 to 34 years have the highest fertility rate with 150.0 births per 1,000 women. Women in the age bracket of 20 to 34 years acount for 66.7% of all women with births.
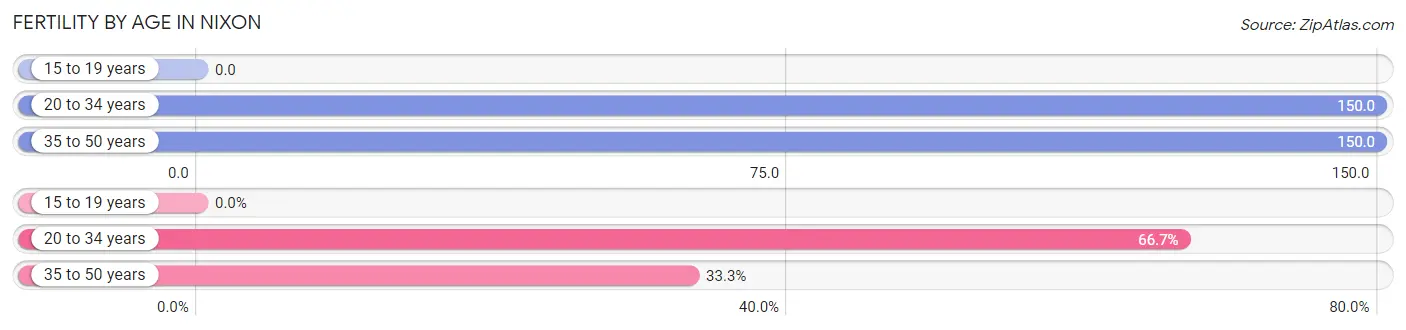
| Age Bracket | Women with Births | Births / 1,000 Women |
| 15 to 19 years | 0 (0.0%) | 0.0 |
| 20 to 34 years | 6 (66.7%) | 150.0 |
| 35 to 50 years | 3 (33.3%) | 150.0 |
| Total | 9 (100.0%) | 118.0 |
Fertility by Age by Marriage Status in Nixon
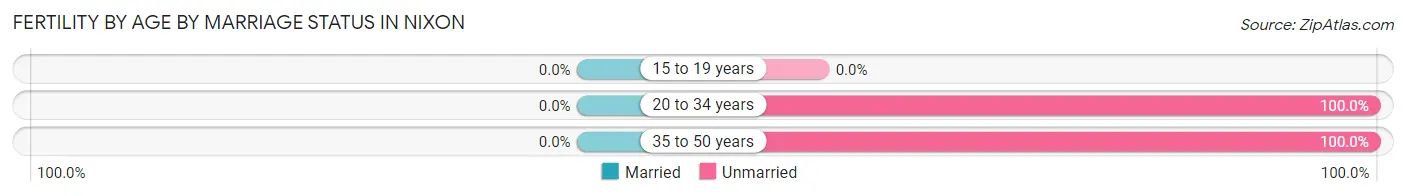
| Age Bracket | Married | Unmarried |
| 15 to 19 years | 0 (0.0%) | 0 (0.0%) |
| 20 to 34 years | 0 (0.0%) | 6 (100.0%) |
| 35 to 50 years | 0 (0.0%) | 3 (100.0%) |
| Total | 0 (0.0%) | 9 (100.0%) |
Fertility by Education in Nixon
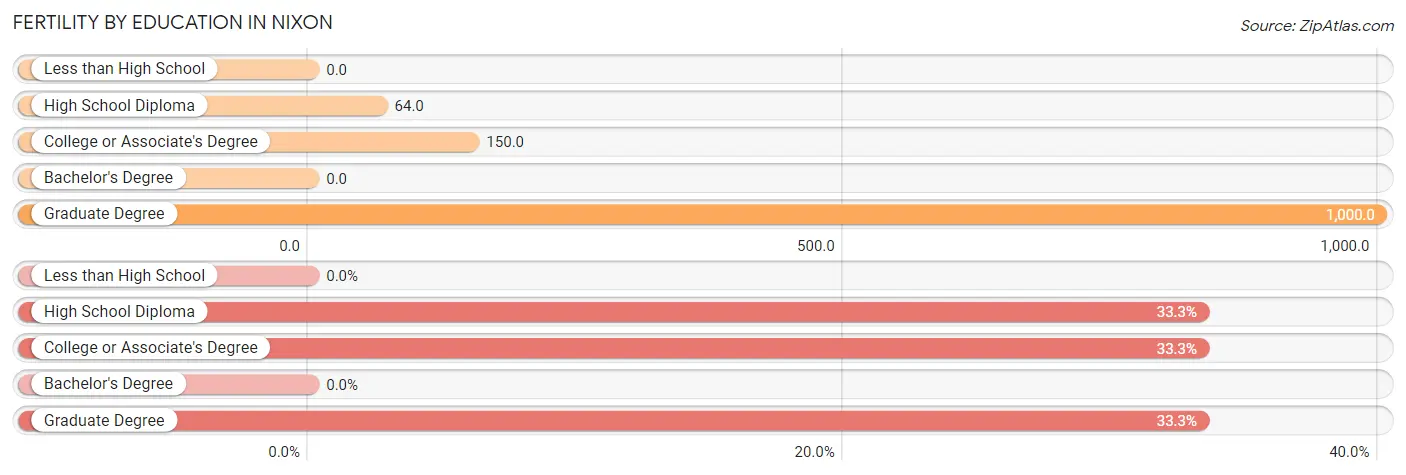
| Educational Attainment | Women with Births | Births / 1,000 Women |
| Less than High School | 0 (0.0%) | 0.0 |
| High School Diploma | 3 (33.3%) | 64.0 |
| College or Associate's Degree | 3 (33.3%) | 150.0 |
| Bachelor's Degree | 0 (0.0%) | 0.0 |
| Graduate Degree | 3 (33.3%) | 1,000.0 |
| Total | 9 (100.0%) | 118.0 |
Fertility by Education by Marriage Status in Nixon
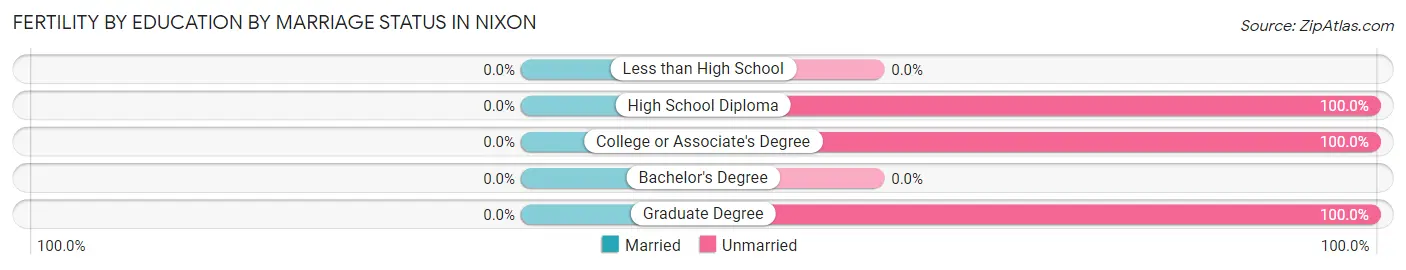
| Educational Attainment | Married | Unmarried |
| Less than High School | 0 (0.0%) | 0 (0.0%) |
| High School Diploma | 0 (0.0%) | 3 (100.0%) |
| College or Associate's Degree | 0 (0.0%) | 3 (100.0%) |
| Bachelor's Degree | 0 (0.0%) | 0 (0.0%) |
| Graduate Degree | 0 (0.0%) | 3 (100.0%) |
| Total | 0 (0.0%) | 9 (100.0%) |
Employment Characteristics in Nixon
Employment by Class of Employer in Nixon
Among the 77 employed individuals in Nixon, private company employees (32 | 41.6%), local government employees (26 | 33.8%), and federal government employees (9 | 11.7%) make up the most common classes of employment.
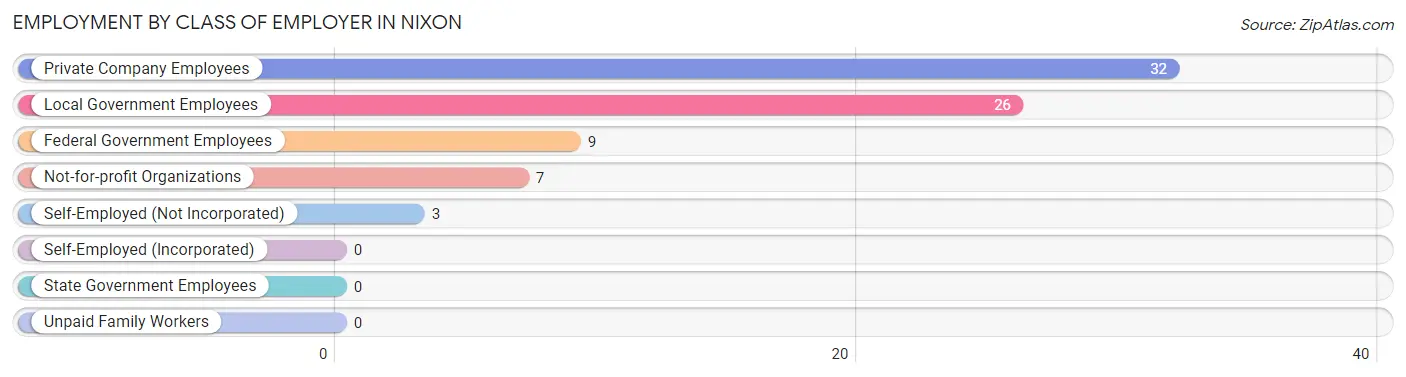
| Employer Class | # Employees | % Employees |
| Private Company Employees | 32 | 41.6% |
| Self-Employed (Incorporated) | 0 | 0.0% |
| Self-Employed (Not Incorporated) | 3 | 3.9% |
| Not-for-profit Organizations | 7 | 9.1% |
| Local Government Employees | 26 | 33.8% |
| State Government Employees | 0 | 0.0% |
| Federal Government Employees | 9 | 11.7% |
| Unpaid Family Workers | 0 | 0.0% |
| Total | 77 | 100.0% |
Employment Status by Age in Nixon
According to the labor force statistics for Nixon, out of the total population over 16 years of age (263), 46.4% or 122 individuals are in the labor force, with 36.9% or 45 of them unemployed. The age group with the highest labor force participation rate is 16 to 19 years, with 100.0% or 26 individuals in the labor force. Within the labor force, the 16 to 19 years age range has the highest percentage of unemployed individuals, with 100.0% or 26 of them being unemployed.
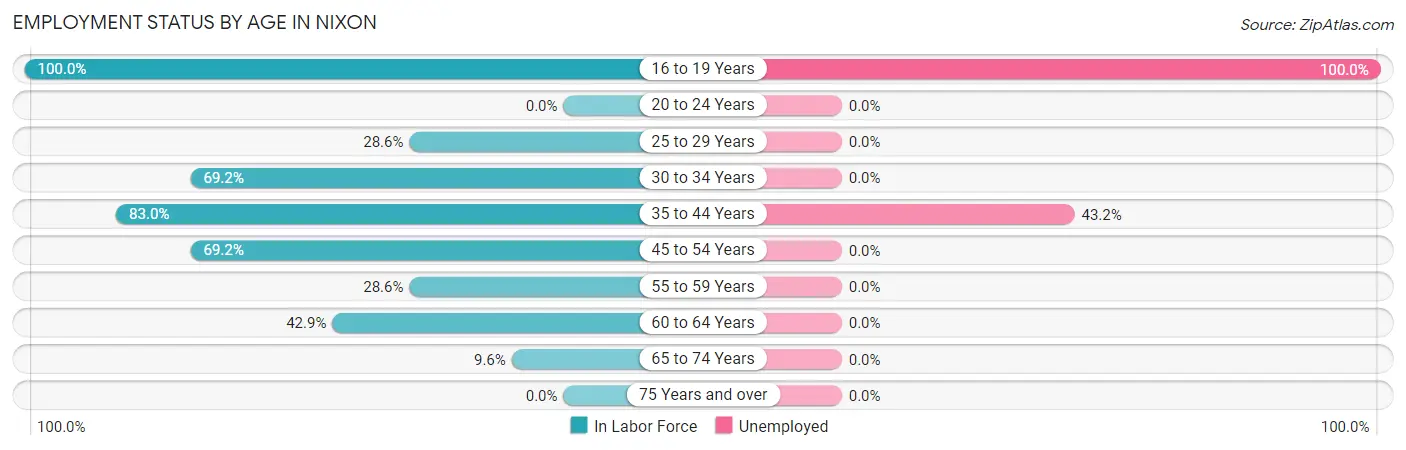
| Age Bracket | In Labor Force | Unemployed |
| 16 to 19 Years | 26 (100.0%) | 26 (100.0%) |
| 20 to 24 Years | 0 (0.0%) | 0 (0.0%) |
| 25 to 29 Years | 10 (28.6%) | 0 (0.0%) |
| 30 to 34 Years | 18 (69.2%) | 0 (0.0%) |
| 35 to 44 Years | 44 (83.0%) | 19 (43.2%) |
| 45 to 54 Years | 9 (69.2%) | 0 (0.0%) |
| 55 to 59 Years | 2 (28.6%) | 0 (0.0%) |
| 60 to 64 Years | 6 (42.9%) | 0 (0.0%) |
| 65 to 74 Years | 7 (9.6%) | 0 (0.0%) |
| 75 Years and over | 0 (0.0%) | 0 (0.0%) |
| Total | 122 (46.4%) | 45 (36.9%) |
Employment Status by Educational Attainment in Nixon
According to labor force statistics for Nixon, 60.1% of individuals (89) out of the total population between 25 and 64 years of age (148) are in the labor force, with 21.3% or 19 of them being unemployed. The group with the highest labor force participation rate are those with the educational attainment of college / associate degree, with 77.1% or 27 individuals in the labor force. Within the labor force, individuals with high school diploma education have the highest percentage of unemployment, with 38.0% or 19 of them being unemployed.
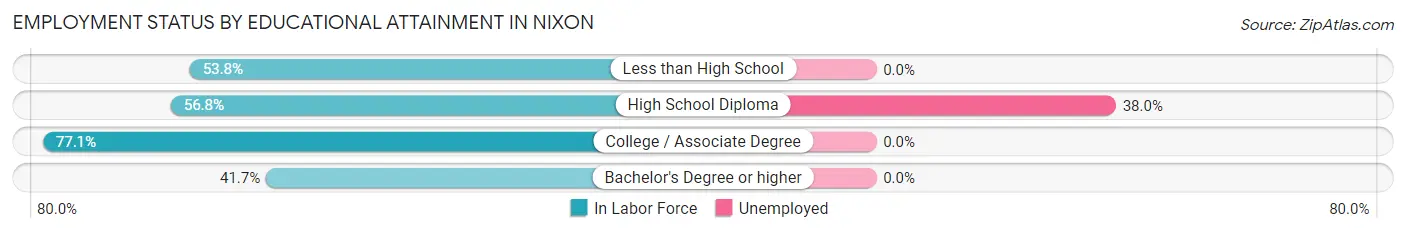
| Educational Attainment | In Labor Force | Unemployed |
| Less than High School | 7 (53.8%) | 0 (0.0%) |
| High School Diploma | 50 (56.8%) | 33 (38.0%) |
| College / Associate Degree | 27 (77.1%) | 0 (0.0%) |
| Bachelor's Degree or higher | 5 (41.7%) | 0 (0.0%) |
| Total | 89 (60.1%) | 32 (21.3%) |
Employment Occupations by Sex in Nixon
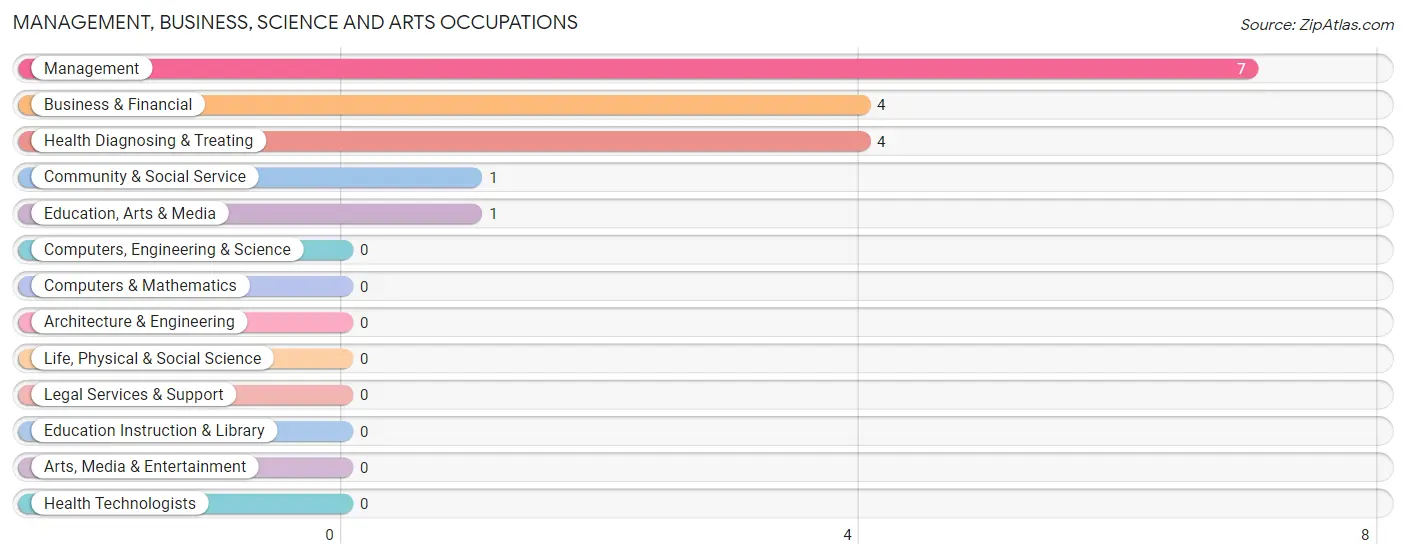
Management, Business, Science and Arts Occupations
The most common Management, Business, Science and Arts occupations in Nixon are Management (7 | 9.1%), Business & Financial (4 | 5.2%), Health Diagnosing & Treating (4 | 5.2%), Community & Social Service (1 | 1.3%), and Education, Arts & Media (1 | 1.3%).
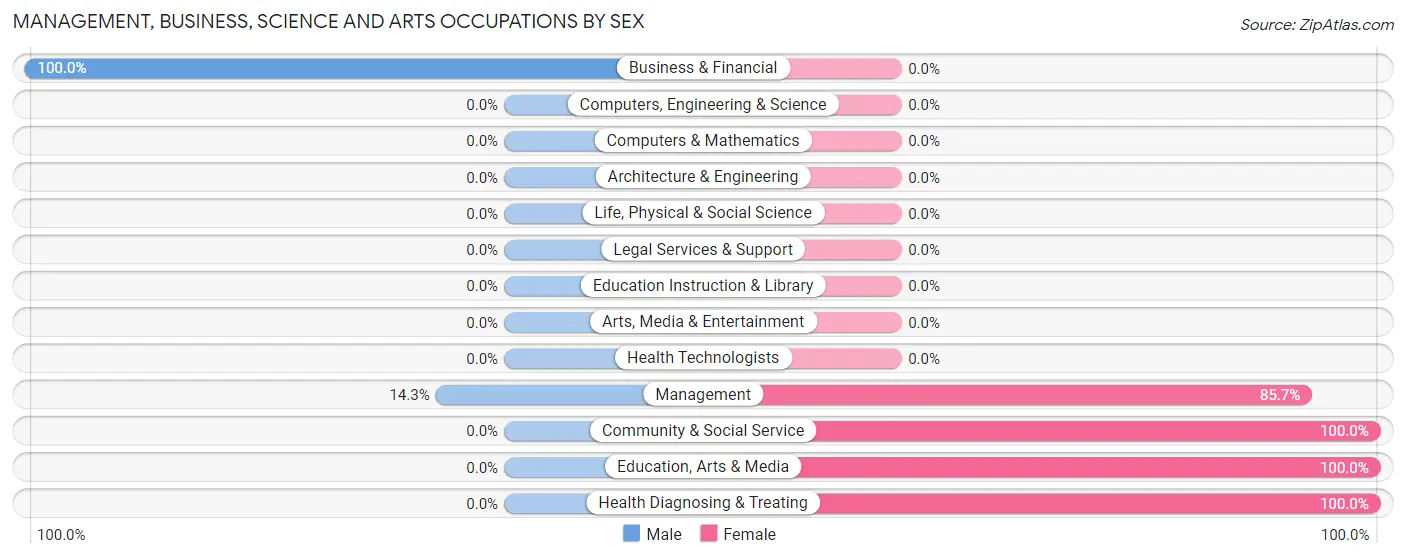
Management, Business, Science and Arts Occupations by Sex
Within the Management, Business, Science and Arts occupations in Nixon, the most male-oriented occupations are Business & Financial (100.0%), and Management (14.3%), while the most female-oriented occupations are Community & Social Service (100.0%), Education, Arts & Media (100.0%), and Health Diagnosing & Treating (100.0%).
| Occupation | Male | Female |
| Management | 1 (14.3%) | 6 (85.7%) |
| Business & Financial | 4 (100.0%) | 0 (0.0%) |
| Computers, Engineering & Science | 0 (0.0%) | 0 (0.0%) |
| Computers & Mathematics | 0 (0.0%) | 0 (0.0%) |
| Architecture & Engineering | 0 (0.0%) | 0 (0.0%) |
| Life, Physical & Social Science | 0 (0.0%) | 0 (0.0%) |
| Community & Social Service | 0 (0.0%) | 1 (100.0%) |
| Education, Arts & Media | 0 (0.0%) | 1 (100.0%) |
| Legal Services & Support | 0 (0.0%) | 0 (0.0%) |
| Education Instruction & Library | 0 (0.0%) | 0 (0.0%) |
| Arts, Media & Entertainment | 0 (0.0%) | 0 (0.0%) |
| Health Diagnosing & Treating | 0 (0.0%) | 4 (100.0%) |
| Health Technologists | 0 (0.0%) | 0 (0.0%) |
| Total (Category) | 5 (31.2%) | 11 (68.8%) |
| Total (Overall) | 43 (55.8%) | 34 (44.2%) |
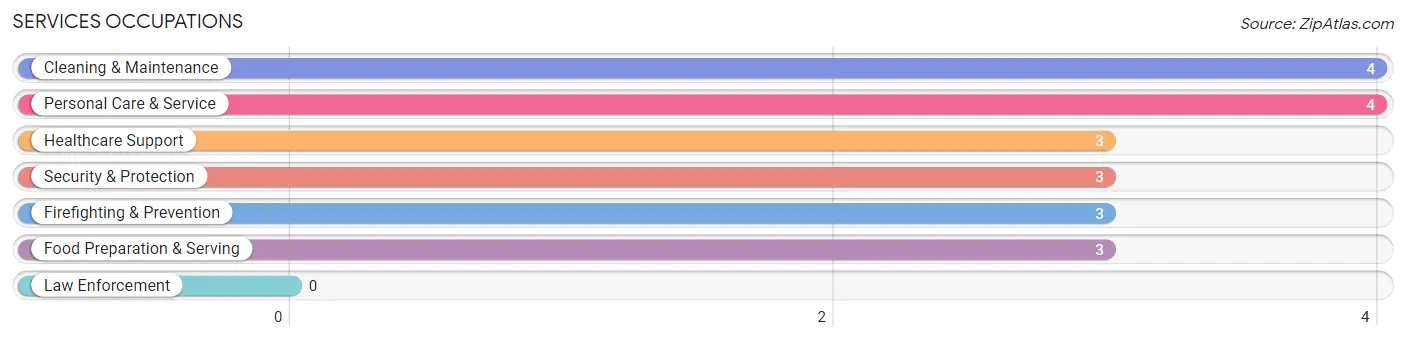
Services Occupations
The most common Services occupations in Nixon are Cleaning & Maintenance (4 | 5.2%), Personal Care & Service (4 | 5.2%), Healthcare Support (3 | 3.9%), Security & Protection (3 | 3.9%), and Firefighting & Prevention (3 | 3.9%).
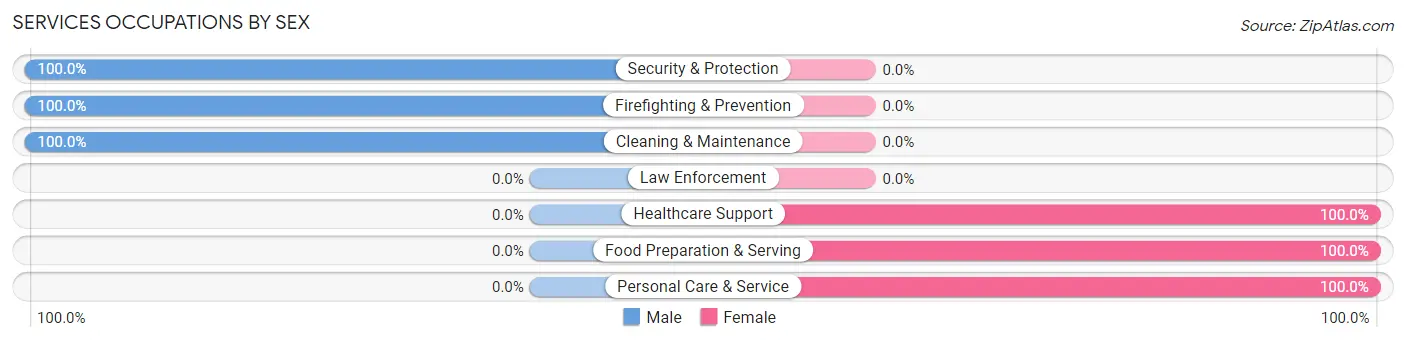
Services Occupations by Sex
Within the Services occupations in Nixon, the most male-oriented occupations are Security & Protection (100.0%), Firefighting & Prevention (100.0%), and Cleaning & Maintenance (100.0%), while the most female-oriented occupations are Healthcare Support (100.0%), Food Preparation & Serving (100.0%), and Personal Care & Service (100.0%).
| Occupation | Male | Female |
| Healthcare Support | 0 (0.0%) | 3 (100.0%) |
| Security & Protection | 3 (100.0%) | 0 (0.0%) |
| Firefighting & Prevention | 3 (100.0%) | 0 (0.0%) |
| Law Enforcement | 0 (0.0%) | 0 (0.0%) |
| Food Preparation & Serving | 0 (0.0%) | 3 (100.0%) |
| Cleaning & Maintenance | 4 (100.0%) | 0 (0.0%) |
| Personal Care & Service | 0 (0.0%) | 4 (100.0%) |
| Total (Category) | 7 (41.2%) | 10 (58.8%) |
| Total (Overall) | 43 (55.8%) | 34 (44.2%) |
Sales and Office Occupations
The most common Sales and Office occupations in Nixon are Sales & Related (4 | 5.2%), and Office & Administration (2 | 2.6%).

Sales and Office Occupations by Sex
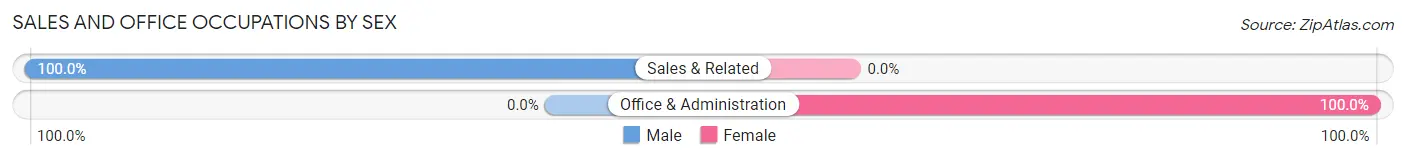
| Occupation | Male | Female |
| Sales & Related | 4 (100.0%) | 0 (0.0%) |
| Office & Administration | 0 (0.0%) | 2 (100.0%) |
| Total (Category) | 4 (66.7%) | 2 (33.3%) |
| Total (Overall) | 43 (55.8%) | 34 (44.2%) |
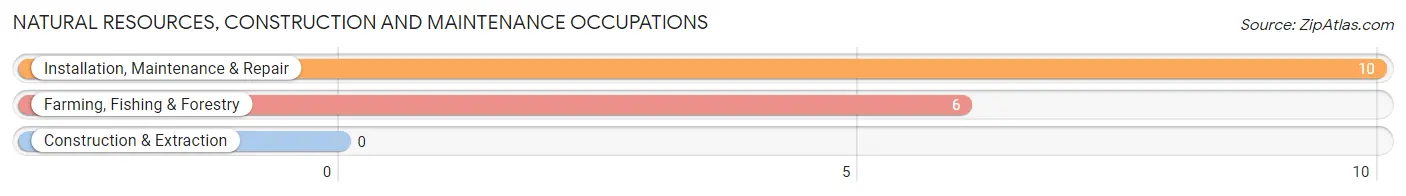
Natural Resources, Construction and Maintenance Occupations
The most common Natural Resources, Construction and Maintenance occupations in Nixon are Installation, Maintenance & Repair (10 | 13.0%), and Farming, Fishing & Forestry (6 | 7.8%).
Natural Resources, Construction and Maintenance Occupations by Sex
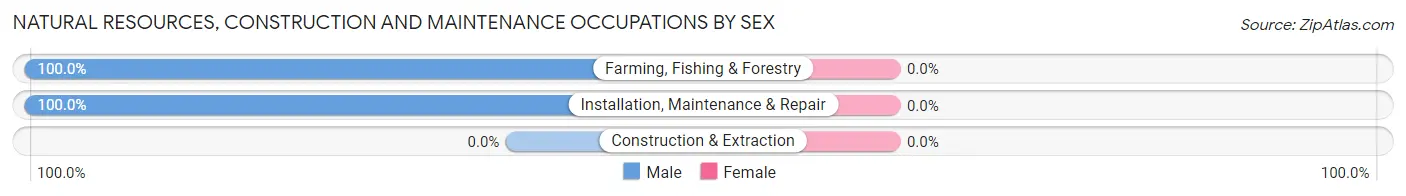
| Occupation | Male | Female |
| Farming, Fishing & Forestry | 6 (100.0%) | 0 (0.0%) |
| Construction & Extraction | 0 (0.0%) | 0 (0.0%) |
| Installation, Maintenance & Repair | 10 (100.0%) | 0 (0.0%) |
| Total (Category) | 16 (100.0%) | 0 (0.0%) |
| Total (Overall) | 43 (55.8%) | 34 (44.2%) |
Production, Transportation and Moving Occupations
The most common Production, Transportation and Moving occupations in Nixon are Material Moving (11 | 14.3%), Production (7 | 9.1%), and Transportation (4 | 5.2%).
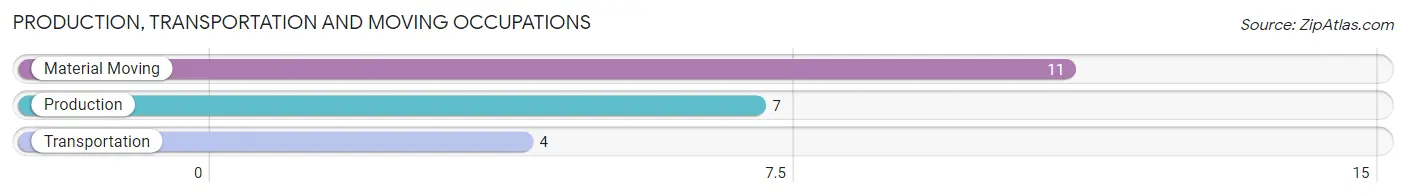
Production, Transportation and Moving Occupations by Sex
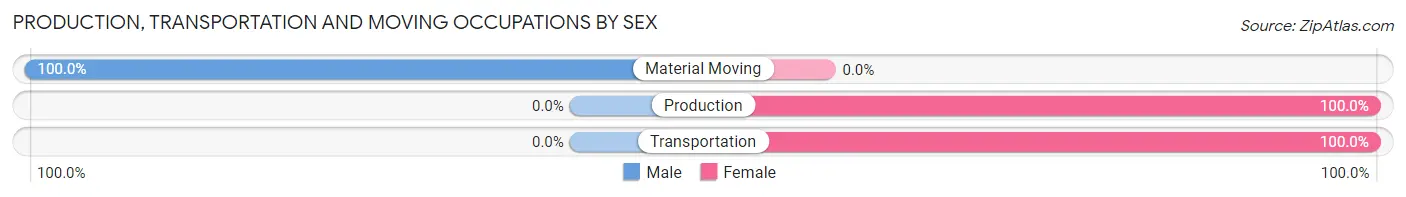
| Occupation | Male | Female |
| Production | 0 (0.0%) | 7 (100.0%) |
| Transportation | 0 (0.0%) | 4 (100.0%) |
| Material Moving | 11 (100.0%) | 0 (0.0%) |
| Total (Category) | 11 (50.0%) | 11 (50.0%) |
| Total (Overall) | 43 (55.8%) | 34 (44.2%) |
Employment Industries by Sex in Nixon
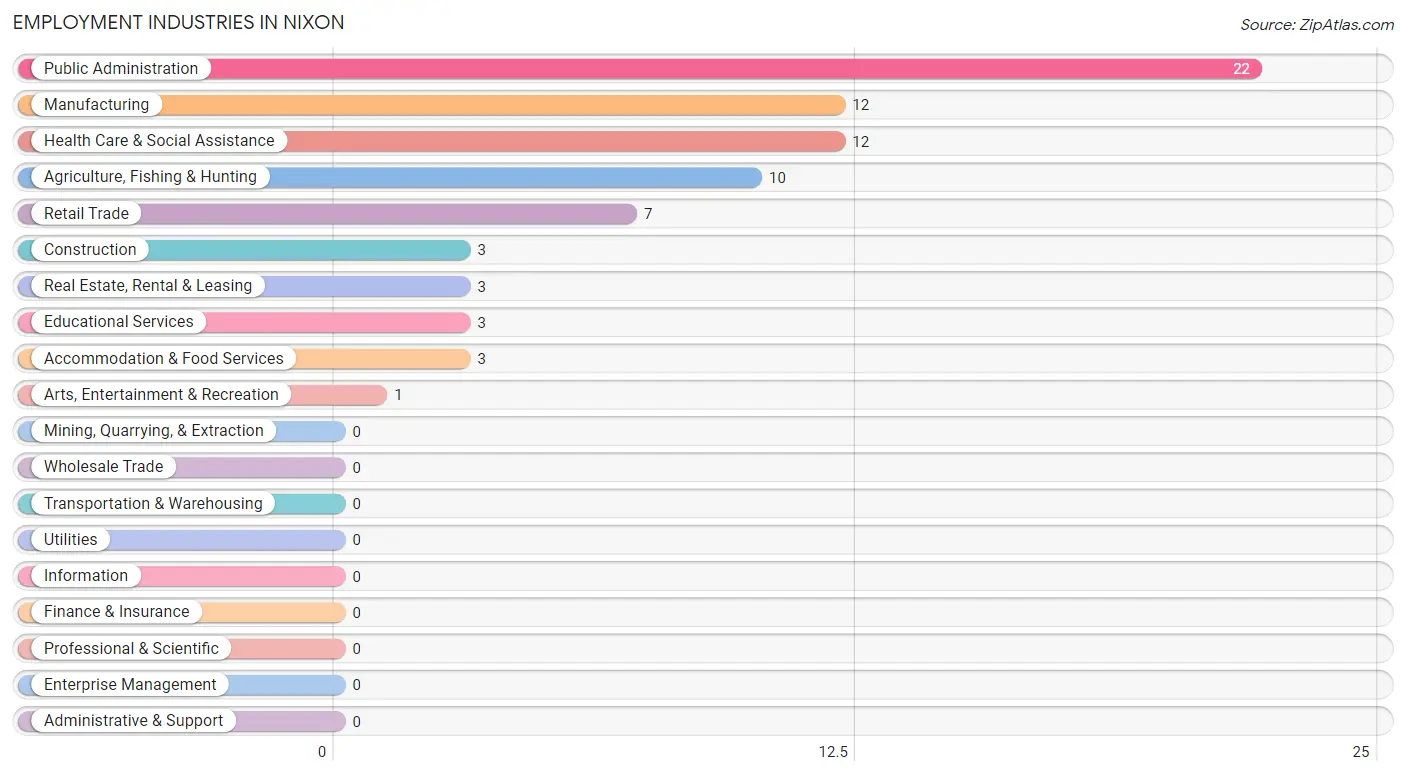
Employment Industries in Nixon
The major employment industries in Nixon include Public Administration (22 | 28.6%), Manufacturing (12 | 15.6%), Health Care & Social Assistance (12 | 15.6%), Agriculture, Fishing & Hunting (10 | 13.0%), and Retail Trade (7 | 9.1%).
Employment Industries by Sex in Nixon
The Nixon industries that see more men than women are Agriculture, Fishing & Hunting (100.0%), Construction (100.0%), and Retail Trade (100.0%), whereas the industries that tend to have a higher number of women are Real Estate, Rental & Leasing (100.0%), Educational Services (100.0%), and Arts, Entertainment & Recreation (100.0%).
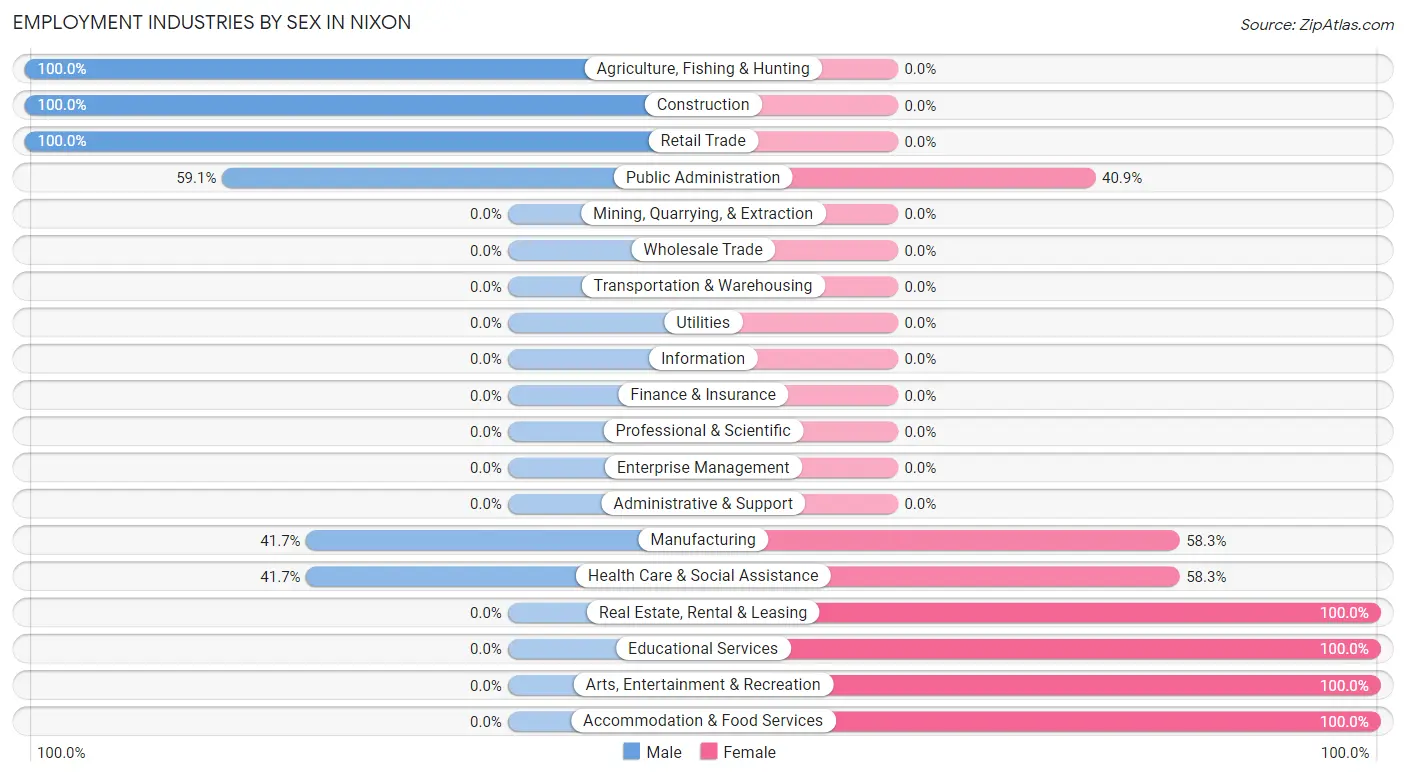
| Industry | Male | Female |
| Agriculture, Fishing & Hunting | 10 (100.0%) | 0 (0.0%) |
| Mining, Quarrying, & Extraction | 0 (0.0%) | 0 (0.0%) |
| Construction | 3 (100.0%) | 0 (0.0%) |
| Manufacturing | 5 (41.7%) | 7 (58.3%) |
| Wholesale Trade | 0 (0.0%) | 0 (0.0%) |
| Retail Trade | 7 (100.0%) | 0 (0.0%) |
| Transportation & Warehousing | 0 (0.0%) | 0 (0.0%) |
| Utilities | 0 (0.0%) | 0 (0.0%) |
| Information | 0 (0.0%) | 0 (0.0%) |
| Finance & Insurance | 0 (0.0%) | 0 (0.0%) |
| Real Estate, Rental & Leasing | 0 (0.0%) | 3 (100.0%) |
| Professional & Scientific | 0 (0.0%) | 0 (0.0%) |
| Enterprise Management | 0 (0.0%) | 0 (0.0%) |
| Administrative & Support | 0 (0.0%) | 0 (0.0%) |
| Educational Services | 0 (0.0%) | 3 (100.0%) |
| Health Care & Social Assistance | 5 (41.7%) | 7 (58.3%) |
| Arts, Entertainment & Recreation | 0 (0.0%) | 1 (100.0%) |
| Accommodation & Food Services | 0 (0.0%) | 3 (100.0%) |
| Public Administration | 13 (59.1%) | 9 (40.9%) |
| Total | 43 (55.8%) | 34 (44.2%) |
Education in Nixon
School Enrollment in Nixon
The most common levels of schooling among the 57 students in Nixon are middle school (22 | 38.6%), nursery / preschool (16 | 28.1%), and elementary school (16 | 28.1%).
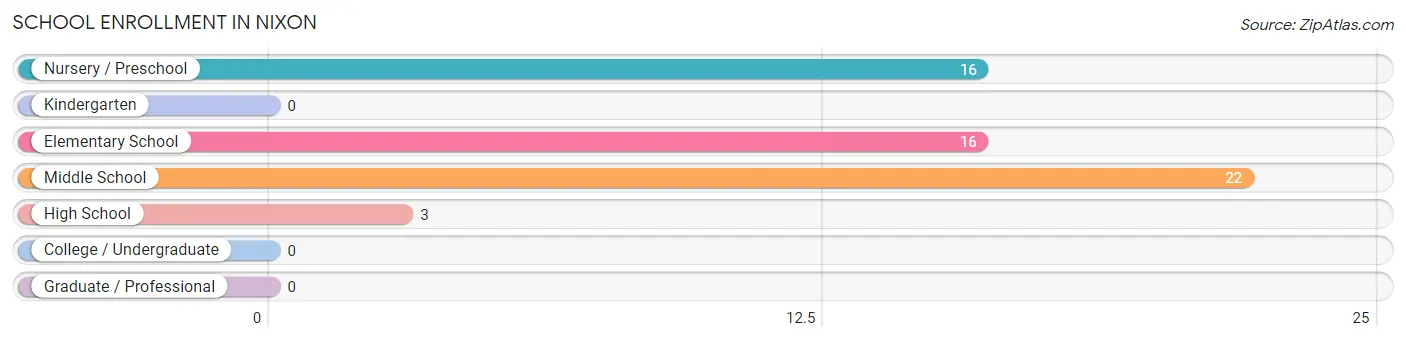
| School Level | # Students | % Students |
| Nursery / Preschool | 16 | 28.1% |
| Kindergarten | 0 | 0.0% |
| Elementary School | 16 | 28.1% |
| Middle School | 22 | 38.6% |
| High School | 3 | 5.3% |
| College / Undergraduate | 0 | 0.0% |
| Graduate / Professional | 0 | 0.0% |
| Total | 57 | 100.0% |
School Enrollment by Age by Funding Source in Nixon
Out of a total of 57 students who are enrolled in schools in Nixon, 22 (38.6%) attend a private institution, while the remaining 35 (61.4%) are enrolled in public schools. The age group of 3 to 4 year olds has the highest likelihood of being enrolled in private schools, with 12 (85.7% in the age bracket) enrolled. Conversely, the age group of 15 to 17 year olds has the lowest likelihood of being enrolled in a private school, with 3 (100.0% in the age bracket) attending a public institution.
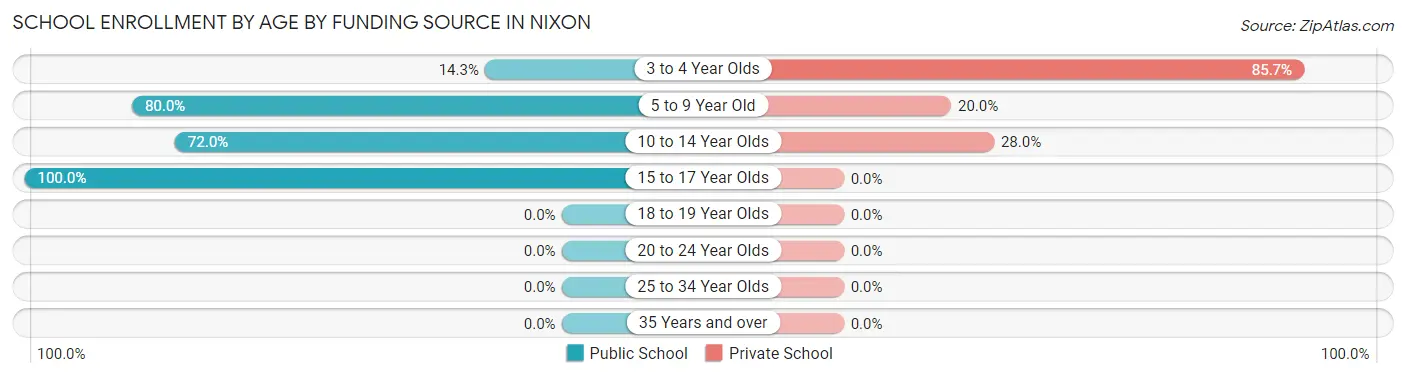
| Age Bracket | Public School | Private School |
| 3 to 4 Year Olds | 2 (14.3%) | 12 (85.7%) |
| 5 to 9 Year Old | 12 (80.0%) | 3 (20.0%) |
| 10 to 14 Year Olds | 18 (72.0%) | 7 (28.0%) |
| 15 to 17 Year Olds | 3 (100.0%) | 0 (0.0%) |
| 18 to 19 Year Olds | 0 (0.0%) | 0 (0.0%) |
| 20 to 24 Year Olds | 0 (0.0%) | 0 (0.0%) |
| 25 to 34 Year Olds | 0 (0.0%) | 0 (0.0%) |
| 35 Years and over | 0 (0.0%) | 0 (0.0%) |
| Total | 35 (61.4%) | 22 (38.6%) |
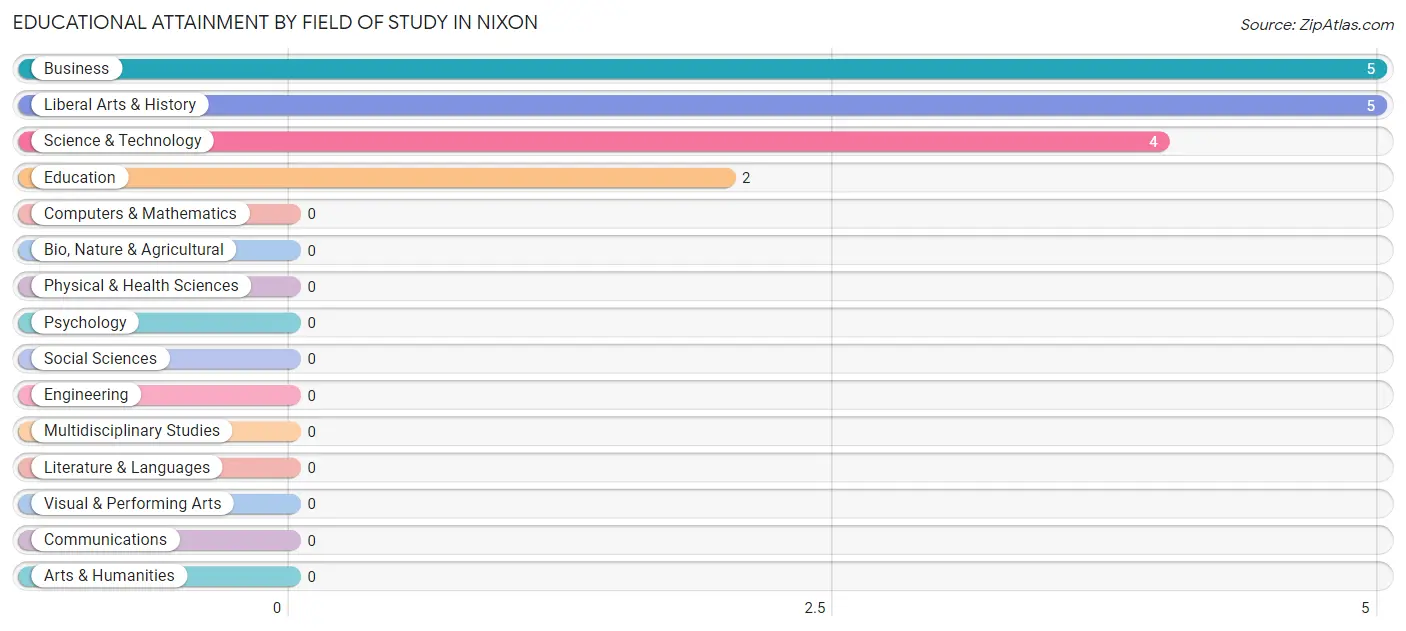
Educational Attainment by Field of Study in Nixon
Business (5 | 31.2%), liberal arts & history (5 | 31.2%), science & technology (4 | 25.0%), and education (2 | 12.5%) are the most common fields of study among 16 individuals in Nixon who have obtained a bachelor's degree or higher.
| Field of Study | # Graduates | % Graduates |
| Computers & Mathematics | 0 | 0.0% |
| Bio, Nature & Agricultural | 0 | 0.0% |
| Physical & Health Sciences | 0 | 0.0% |
| Psychology | 0 | 0.0% |
| Social Sciences | 0 | 0.0% |
| Engineering | 0 | 0.0% |
| Multidisciplinary Studies | 0 | 0.0% |
| Science & Technology | 4 | 25.0% |
| Business | 5 | 31.2% |
| Education | 2 | 12.5% |
| Literature & Languages | 0 | 0.0% |
| Liberal Arts & History | 5 | 31.2% |
| Visual & Performing Arts | 0 | 0.0% |
| Communications | 0 | 0.0% |
| Arts & Humanities | 0 | 0.0% |
| Total | 16 | 100.0% |
Transportation & Commute in Nixon
Vehicle Availability by Sex in Nixon
The most prevalent vehicle ownership categories in Nixon are males with 2 vehicles (24, accounting for 55.8%) and females with 2 vehicles (10, making up 70.6%).
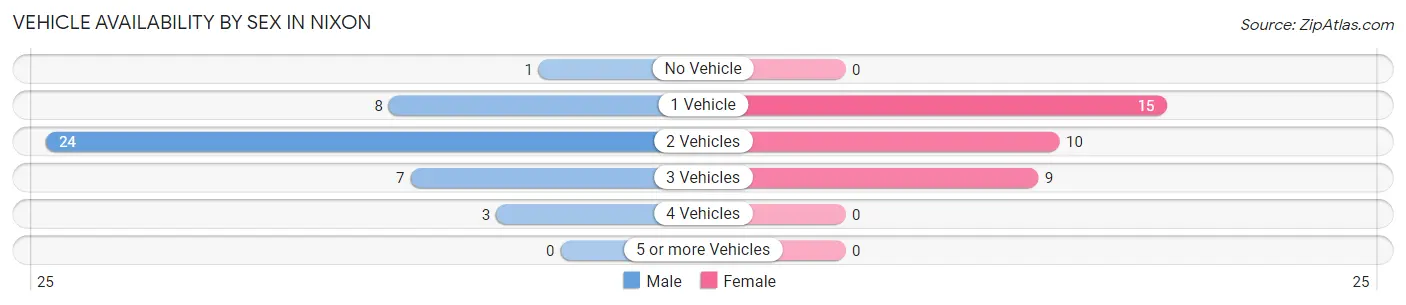
| Vehicles Available | Male | Female |
| No Vehicle | 1 (2.3%) | 0 (0.0%) |
| 1 Vehicle | 8 (18.6%) | 15 (44.1%) |
| 2 Vehicles | 24 (55.8%) | 10 (29.4%) |
| 3 Vehicles | 7 (16.3%) | 9 (26.5%) |
| 4 Vehicles | 3 (7.0%) | 0 (0.0%) |
| 5 or more Vehicles | 0 (0.0%) | 0 (0.0%) |
| Total | 43 (100.0%) | 34 (100.0%) |
Commute Time in Nixon
The most frequently occuring commute durations in Nixon are less than 5 minutes (20 commuters, 26.0%), 10 to 14 minutes (14 commuters, 18.2%), and 30 to 34 minutes (11 commuters, 14.3%).
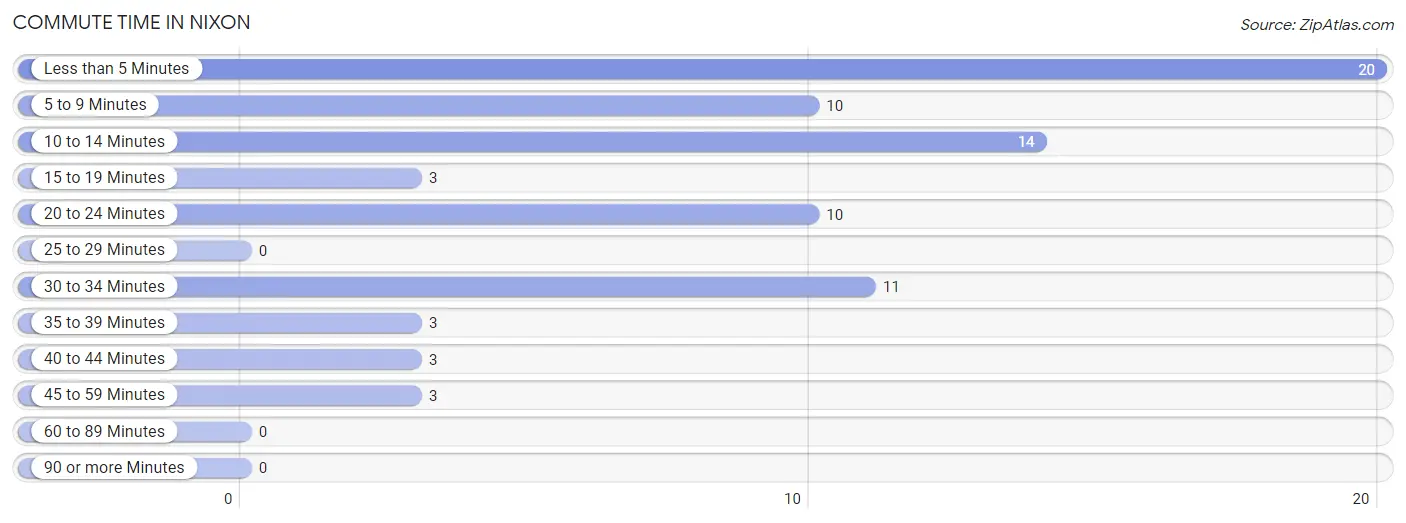
| Commute Time | # Commuters | % Commuters |
| Less than 5 Minutes | 20 | 26.0% |
| 5 to 9 Minutes | 10 | 13.0% |
| 10 to 14 Minutes | 14 | 18.2% |
| 15 to 19 Minutes | 3 | 3.9% |
| 20 to 24 Minutes | 10 | 13.0% |
| 25 to 29 Minutes | 0 | 0.0% |
| 30 to 34 Minutes | 11 | 14.3% |
| 35 to 39 Minutes | 3 | 3.9% |
| 40 to 44 Minutes | 3 | 3.9% |
| 45 to 59 Minutes | 3 | 3.9% |
| 60 to 89 Minutes | 0 | 0.0% |
| 90 or more Minutes | 0 | 0.0% |
Commute Time by Sex in Nixon
The most common commute times in Nixon are less than 5 minutes (11 commuters, 25.6%) for males and less than 5 minutes (9 commuters, 26.5%) for females.
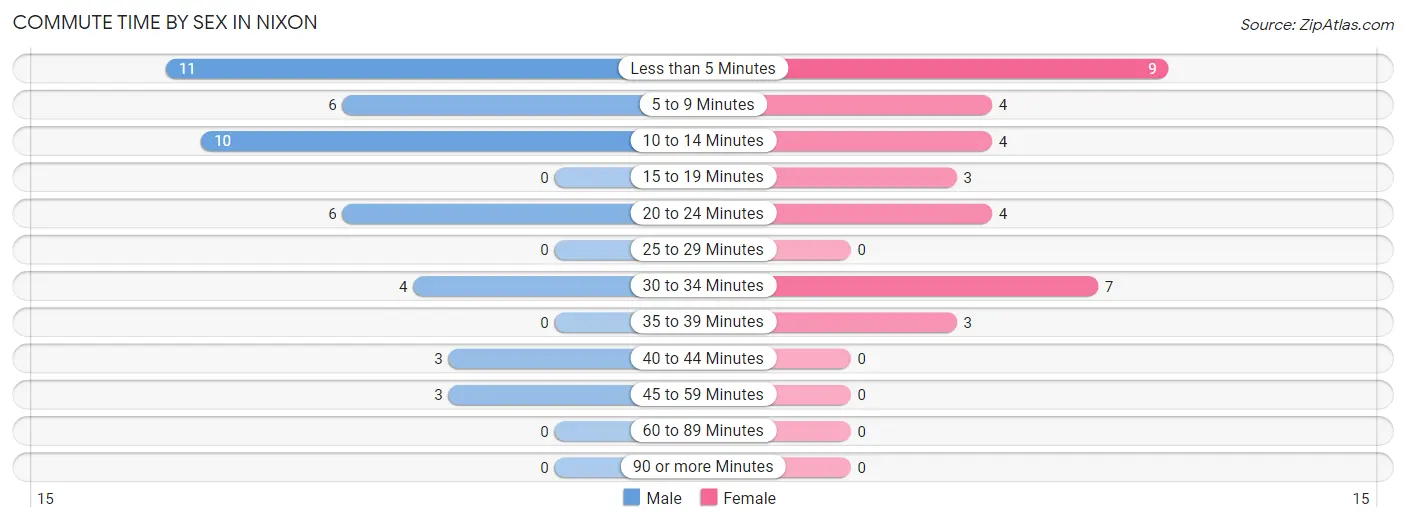
| Commute Time | Male | Female |
| Less than 5 Minutes | 11 (25.6%) | 9 (26.5%) |
| 5 to 9 Minutes | 6 (14.0%) | 4 (11.8%) |
| 10 to 14 Minutes | 10 (23.3%) | 4 (11.8%) |
| 15 to 19 Minutes | 0 (0.0%) | 3 (8.8%) |
| 20 to 24 Minutes | 6 (14.0%) | 4 (11.8%) |
| 25 to 29 Minutes | 0 (0.0%) | 0 (0.0%) |
| 30 to 34 Minutes | 4 (9.3%) | 7 (20.6%) |
| 35 to 39 Minutes | 0 (0.0%) | 3 (8.8%) |
| 40 to 44 Minutes | 3 (7.0%) | 0 (0.0%) |
| 45 to 59 Minutes | 3 (7.0%) | 0 (0.0%) |
| 60 to 89 Minutes | 0 (0.0%) | 0 (0.0%) |
| 90 or more Minutes | 0 (0.0%) | 0 (0.0%) |
Time of Departure to Work by Sex in Nixon
The most frequent times of departure to work in Nixon are 7:30 AM to 7:59 AM (18, 41.9%) for males and 7:30 AM to 7:59 AM (12, 35.3%) for females.
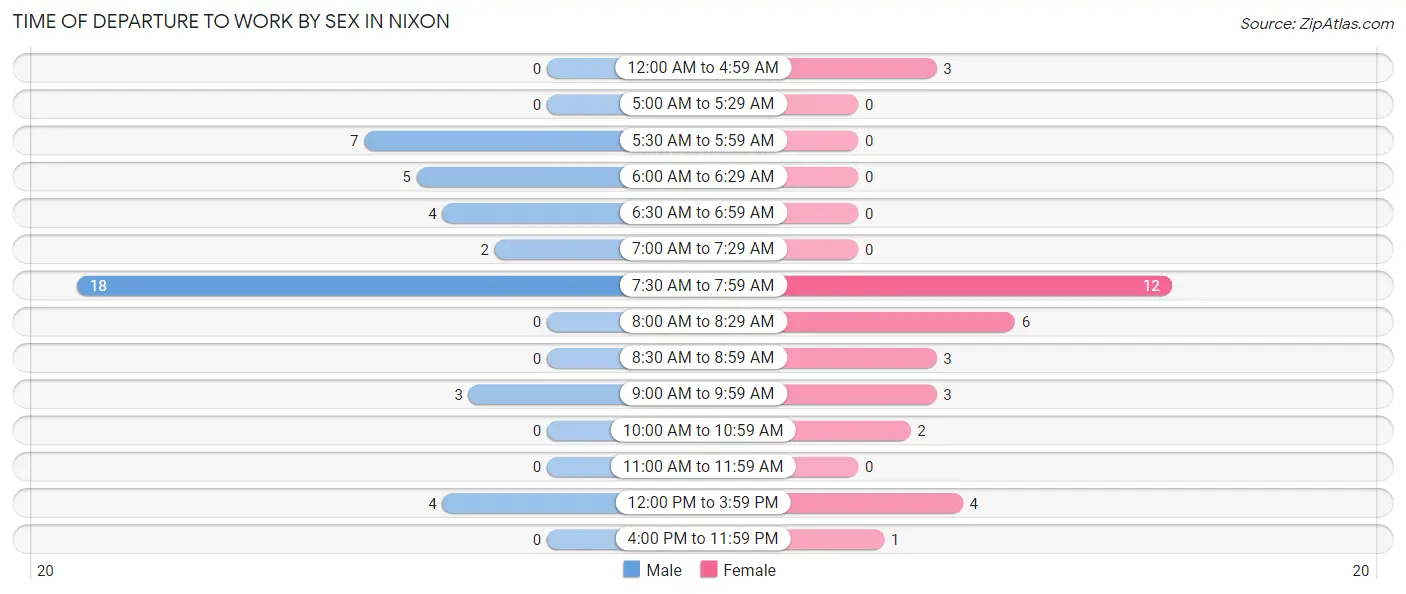
| Time of Departure | Male | Female |
| 12:00 AM to 4:59 AM | 0 (0.0%) | 3 (8.8%) |
| 5:00 AM to 5:29 AM | 0 (0.0%) | 0 (0.0%) |
| 5:30 AM to 5:59 AM | 7 (16.3%) | 0 (0.0%) |
| 6:00 AM to 6:29 AM | 5 (11.6%) | 0 (0.0%) |
| 6:30 AM to 6:59 AM | 4 (9.3%) | 0 (0.0%) |
| 7:00 AM to 7:29 AM | 2 (4.6%) | 0 (0.0%) |
| 7:30 AM to 7:59 AM | 18 (41.9%) | 12 (35.3%) |
| 8:00 AM to 8:29 AM | 0 (0.0%) | 6 (17.6%) |
| 8:30 AM to 8:59 AM | 0 (0.0%) | 3 (8.8%) |
| 9:00 AM to 9:59 AM | 3 (7.0%) | 3 (8.8%) |
| 10:00 AM to 10:59 AM | 0 (0.0%) | 2 (5.9%) |
| 11:00 AM to 11:59 AM | 0 (0.0%) | 0 (0.0%) |
| 12:00 PM to 3:59 PM | 4 (9.3%) | 4 (11.8%) |
| 4:00 PM to 11:59 PM | 0 (0.0%) | 1 (2.9%) |
| Total | 43 (100.0%) | 34 (100.0%) |
Housing Occupancy in Nixon
Occupancy by Ownership in Nixon
Of the total 147 dwellings in Nixon, owner-occupied units account for 123 (83.7%), while renter-occupied units make up 24 (16.3%).
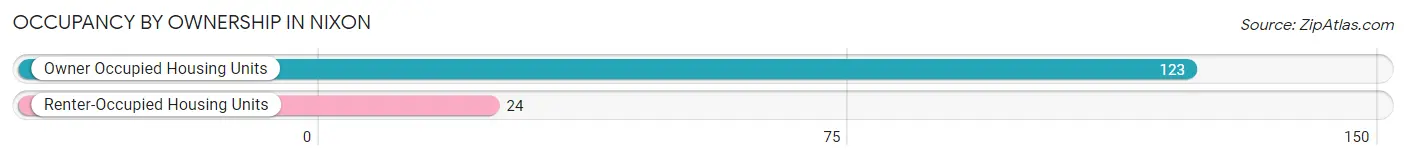
| Occupancy | # Housing Units | % Housing Units |
| Owner Occupied Housing Units | 123 | 83.7% |
| Renter-Occupied Housing Units | 24 | 16.3% |
| Total Occupied Housing Units | 147 | 100.0% |
Occupancy by Household Size in Nixon
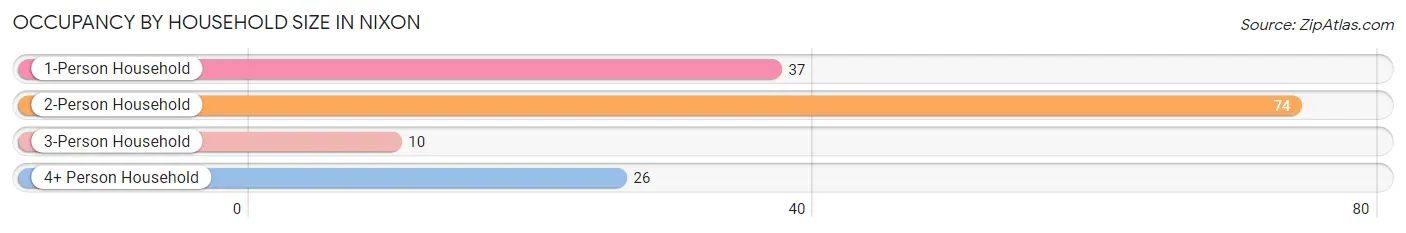
| Household Size | # Housing Units | % Housing Units |
| 1-Person Household | 37 | 25.2% |
| 2-Person Household | 74 | 50.3% |
| 3-Person Household | 10 | 6.8% |
| 4+ Person Household | 26 | 17.7% |
| Total Housing Units | 147 | 100.0% |
Occupancy by Ownership by Household Size in Nixon
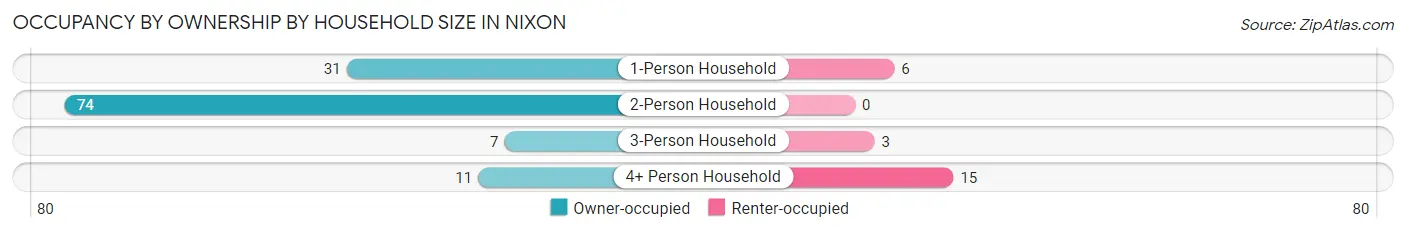
| Household Size | Owner-occupied | Renter-occupied |
| 1-Person Household | 31 (83.8%) | 6 (16.2%) |
| 2-Person Household | 74 (100.0%) | 0 (0.0%) |
| 3-Person Household | 7 (70.0%) | 3 (30.0%) |
| 4+ Person Household | 11 (42.3%) | 15 (57.7%) |
| Total Housing Units | 123 (83.7%) | 24 (16.3%) |
Occupancy by Educational Attainment in Nixon
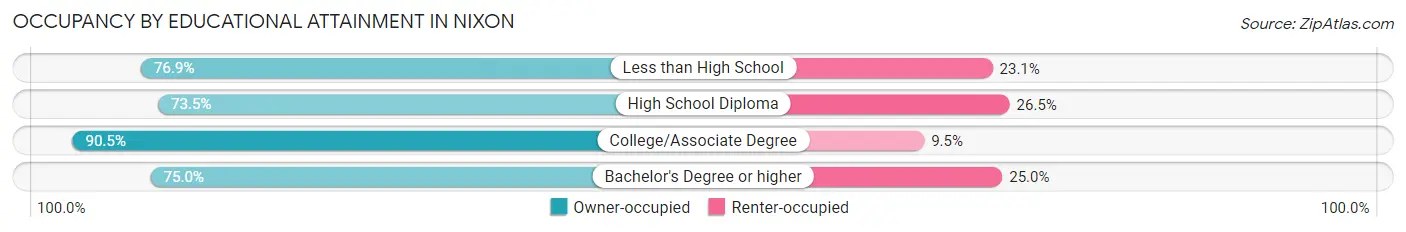
| Household Size | Owner-occupied | Renter-occupied |
| Less than High School | 10 (76.9%) | 3 (23.1%) |
| High School Diploma | 25 (73.5%) | 9 (26.5%) |
| College/Associate Degree | 76 (90.5%) | 8 (9.5%) |
| Bachelor's Degree or higher | 12 (75.0%) | 4 (25.0%) |
Occupancy by Age of Householder in Nixon
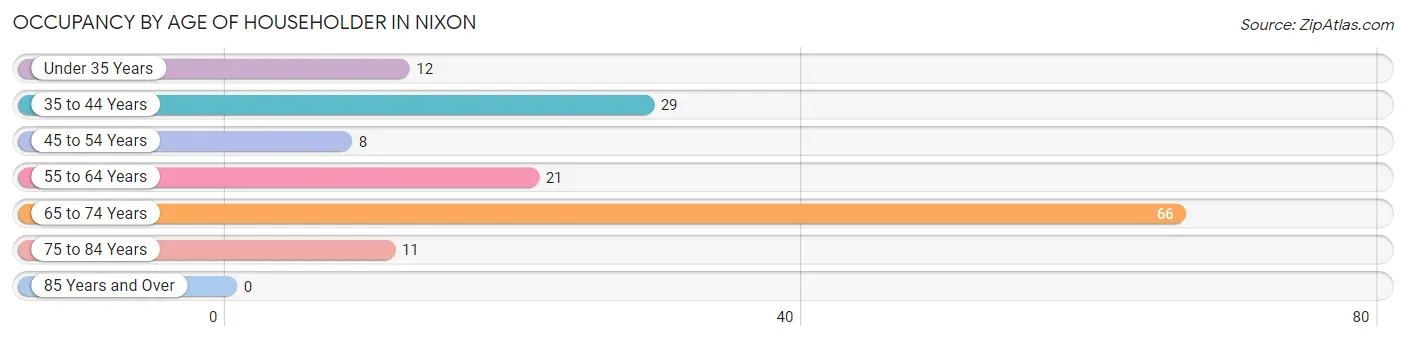
| Age Bracket | # Households | % Households |
| Under 35 Years | 12 | 8.2% |
| 35 to 44 Years | 29 | 19.7% |
| 45 to 54 Years | 8 | 5.4% |
| 55 to 64 Years | 21 | 14.3% |
| 65 to 74 Years | 66 | 44.9% |
| 75 to 84 Years | 11 | 7.5% |
| 85 Years and Over | 0 | 0.0% |
| Total | 147 | 100.0% |
Housing Finances in Nixon
Median Income by Occupancy in Nixon
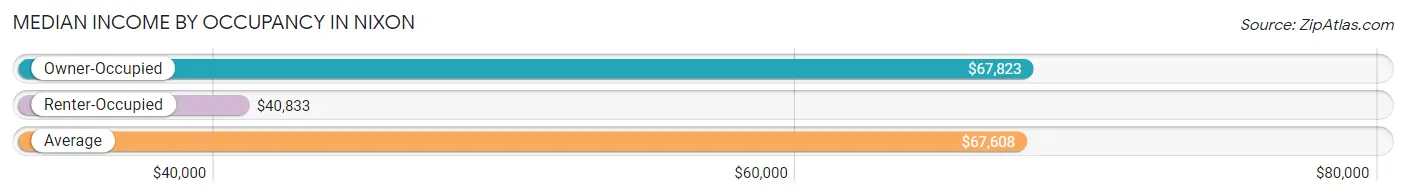
| Occupancy Type | # Households | Median Income |
| Owner-Occupied | 123 (83.7%) | $67,823 |
| Renter-Occupied | 24 (16.3%) | $40,833 |
| Average | 147 (100.0%) | $67,608 |
Occupancy by Householder Income Bracket in Nixon
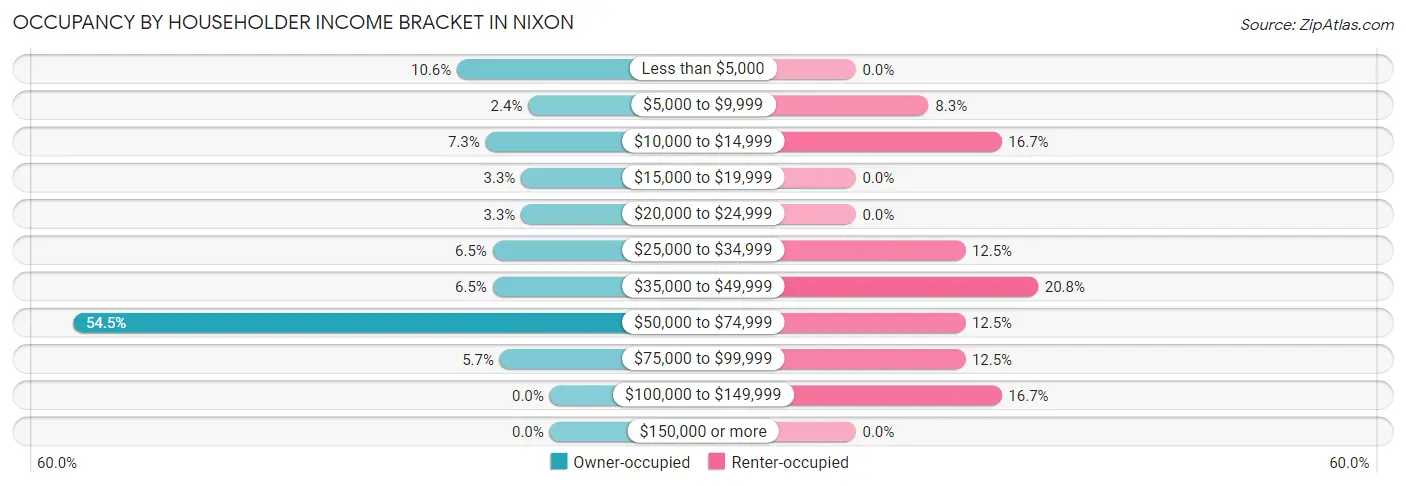
| Income Bracket | Owner-occupied | Renter-occupied |
| Less than $5,000 | 13 (10.6%) | 0 (0.0%) |
| $5,000 to $9,999 | 3 (2.4%) | 2 (8.3%) |
| $10,000 to $14,999 | 9 (7.3%) | 4 (16.7%) |
| $15,000 to $19,999 | 4 (3.3%) | 0 (0.0%) |
| $20,000 to $24,999 | 4 (3.3%) | 0 (0.0%) |
| $25,000 to $34,999 | 8 (6.5%) | 3 (12.5%) |
| $35,000 to $49,999 | 8 (6.5%) | 5 (20.8%) |
| $50,000 to $74,999 | 67 (54.5%) | 3 (12.5%) |
| $75,000 to $99,999 | 7 (5.7%) | 3 (12.5%) |
| $100,000 to $149,999 | 0 (0.0%) | 4 (16.7%) |
| $150,000 or more | 0 (0.0%) | 0 (0.0%) |
| Total | 123 (100.0%) | 24 (100.0%) |
Monthly Housing Cost Tiers in Nixon
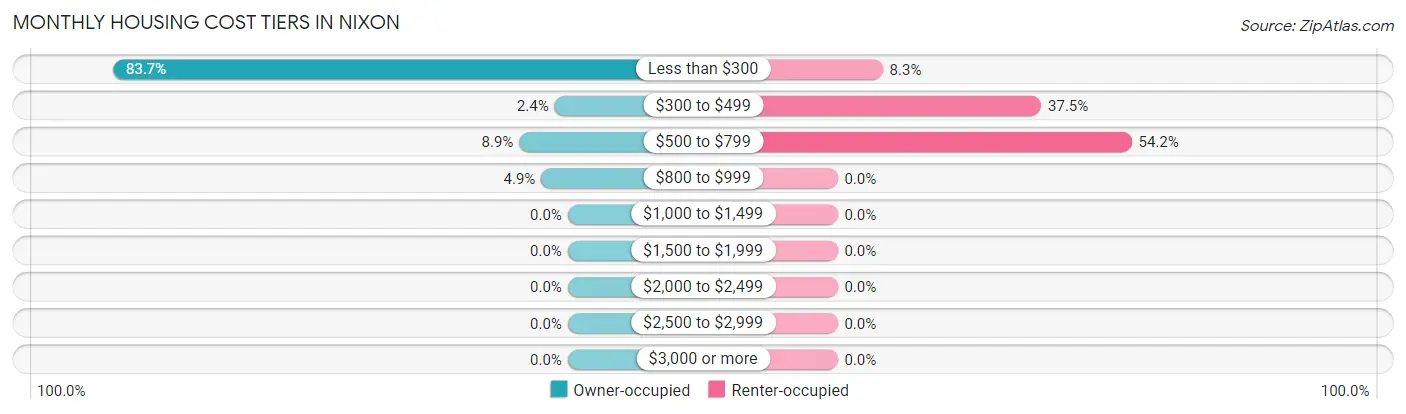
| Monthly Cost | Owner-occupied | Renter-occupied |
| Less than $300 | 103 (83.7%) | 2 (8.3%) |
| $300 to $499 | 3 (2.4%) | 9 (37.5%) |
| $500 to $799 | 11 (8.9%) | 13 (54.2%) |
| $800 to $999 | 6 (4.9%) | 0 (0.0%) |
| $1,000 to $1,499 | 0 (0.0%) | 0 (0.0%) |
| $1,500 to $1,999 | 0 (0.0%) | 0 (0.0%) |
| $2,000 to $2,499 | 0 (0.0%) | 0 (0.0%) |
| $2,500 to $2,999 | 0 (0.0%) | 0 (0.0%) |
| $3,000 or more | 0 (0.0%) | 0 (0.0%) |
| Total | 123 (100.0%) | 24 (100.0%) |
Physical Housing Characteristics in Nixon
Housing Structures in Nixon
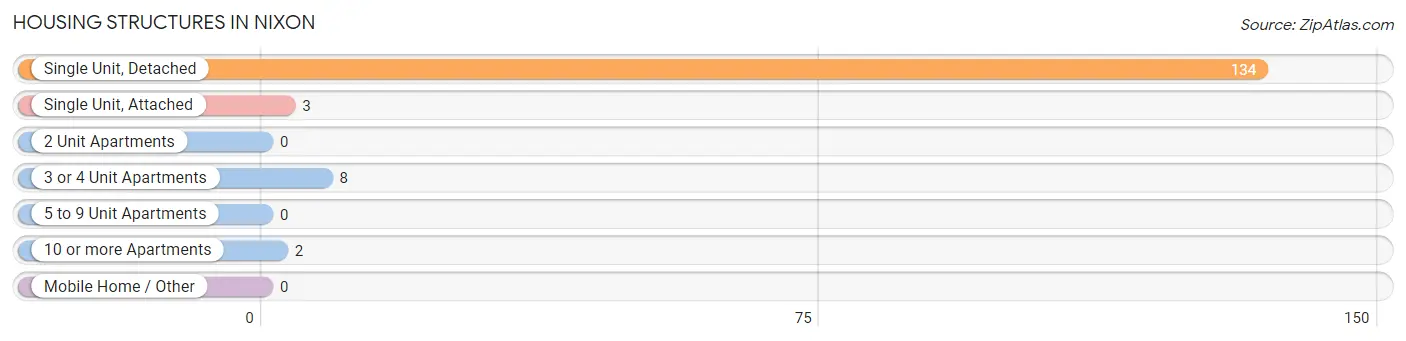
| Structure Type | # Housing Units | % Housing Units |
| Single Unit, Detached | 134 | 91.2% |
| Single Unit, Attached | 3 | 2.0% |
| 2 Unit Apartments | 0 | 0.0% |
| 3 or 4 Unit Apartments | 8 | 5.4% |
| 5 to 9 Unit Apartments | 0 | 0.0% |
| 10 or more Apartments | 2 | 1.4% |
| Mobile Home / Other | 0 | 0.0% |
| Total | 147 | 100.0% |
Housing Structures by Occupancy in Nixon
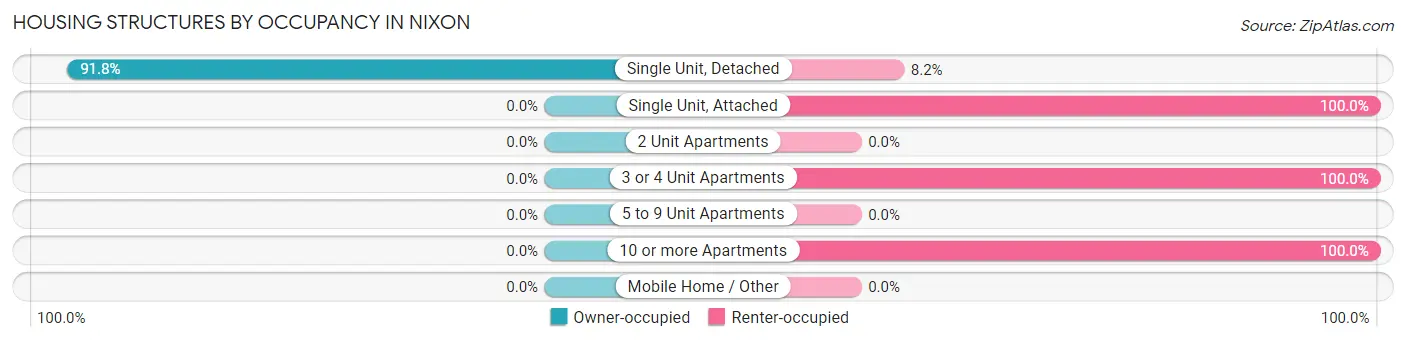
| Structure Type | Owner-occupied | Renter-occupied |
| Single Unit, Detached | 123 (91.8%) | 11 (8.2%) |
| Single Unit, Attached | 0 (0.0%) | 3 (100.0%) |
| 2 Unit Apartments | 0 (0.0%) | 0 (0.0%) |
| 3 or 4 Unit Apartments | 0 (0.0%) | 8 (100.0%) |
| 5 to 9 Unit Apartments | 0 (0.0%) | 0 (0.0%) |
| 10 or more Apartments | 0 (0.0%) | 2 (100.0%) |
| Mobile Home / Other | 0 (0.0%) | 0 (0.0%) |
| Total | 123 (83.7%) | 24 (16.3%) |
Housing Structures by Number of Rooms in Nixon
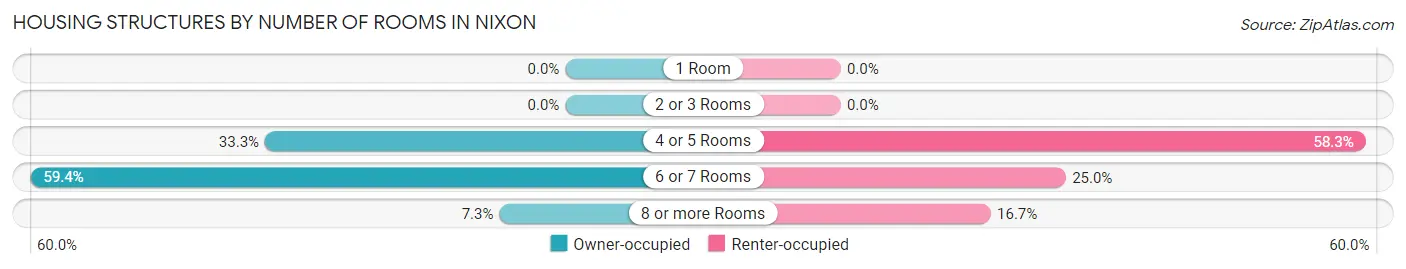
| Number of Rooms | Owner-occupied | Renter-occupied |
| 1 Room | 0 (0.0%) | 0 (0.0%) |
| 2 or 3 Rooms | 0 (0.0%) | 0 (0.0%) |
| 4 or 5 Rooms | 41 (33.3%) | 14 (58.3%) |
| 6 or 7 Rooms | 73 (59.4%) | 6 (25.0%) |
| 8 or more Rooms | 9 (7.3%) | 4 (16.7%) |
| Total | 123 (100.0%) | 24 (100.0%) |
Housing Structure by Heating Type in Nixon
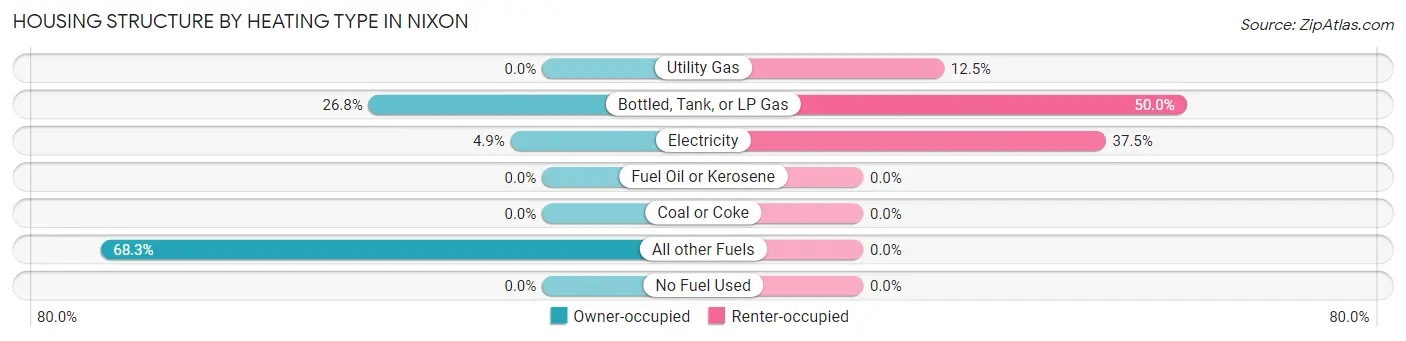
| Heating Type | Owner-occupied | Renter-occupied |
| Utility Gas | 0 (0.0%) | 3 (12.5%) |
| Bottled, Tank, or LP Gas | 33 (26.8%) | 12 (50.0%) |
| Electricity | 6 (4.9%) | 9 (37.5%) |
| Fuel Oil or Kerosene | 0 (0.0%) | 0 (0.0%) |
| Coal or Coke | 0 (0.0%) | 0 (0.0%) |
| All other Fuels | 84 (68.3%) | 0 (0.0%) |
| No Fuel Used | 0 (0.0%) | 0 (0.0%) |
| Total | 123 (100.0%) | 24 (100.0%) |
Household Vehicle Usage in Nixon
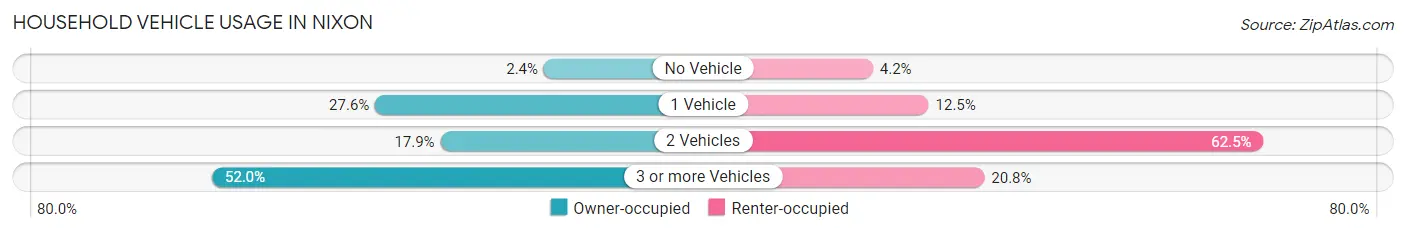
| Vehicles per Household | Owner-occupied | Renter-occupied |
| No Vehicle | 3 (2.4%) | 1 (4.2%) |
| 1 Vehicle | 34 (27.6%) | 3 (12.5%) |
| 2 Vehicles | 22 (17.9%) | 15 (62.5%) |
| 3 or more Vehicles | 64 (52.0%) | 5 (20.8%) |
| Total | 123 (100.0%) | 24 (100.0%) |
Real Estate & Mortgages in Nixon
Real Estate and Mortgage Overview in Nixon
| Characteristic | Without Mortgage | With Mortgage |
| Housing Units | 118 | 5 |
| Median Property Value | $54,000 | $0 |
| Median Household Income | $67,716 | $0 |
| Monthly Housing Costs | $184 | $0 |
| Real Estate Taxes | - | - |
Property Value by Mortgage Status in Nixon
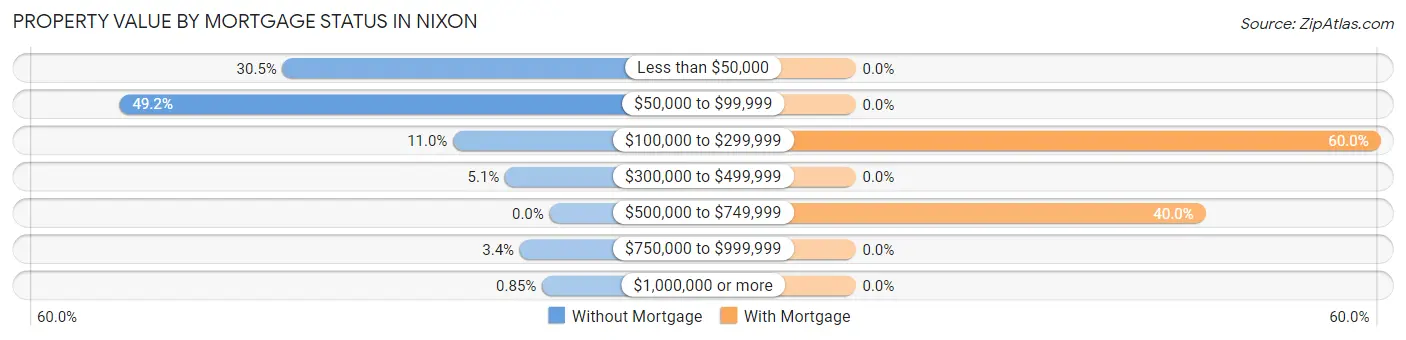
| Property Value | Without Mortgage | With Mortgage |
| Less than $50,000 | 36 (30.5%) | 0 (0.0%) |
| $50,000 to $99,999 | 58 (49.1%) | 0 (0.0%) |
| $100,000 to $299,999 | 13 (11.0%) | 3 (60.0%) |
| $300,000 to $499,999 | 6 (5.1%) | 0 (0.0%) |
| $500,000 to $749,999 | 0 (0.0%) | 2 (40.0%) |
| $750,000 to $999,999 | 4 (3.4%) | 0 (0.0%) |
| $1,000,000 or more | 1 (0.9%) | 0 (0.0%) |
| Total | 118 (100.0%) | 5 (100.0%) |
Household Income by Mortgage Status in Nixon
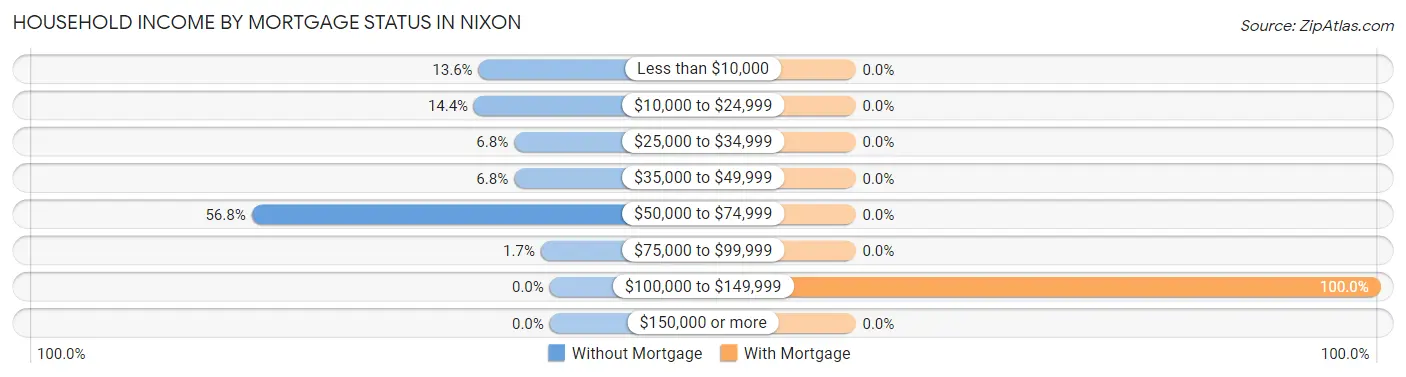
| Household Income | Without Mortgage | With Mortgage |
| Less than $10,000 | 16 (13.6%) | 0 (0.0%) |
| $10,000 to $24,999 | 17 (14.4%) | 0 (0.0%) |
| $25,000 to $34,999 | 8 (6.8%) | 0 (0.0%) |
| $35,000 to $49,999 | 8 (6.8%) | 0 (0.0%) |
| $50,000 to $74,999 | 67 (56.8%) | 0 (0.0%) |
| $75,000 to $99,999 | 2 (1.7%) | 0 (0.0%) |
| $100,000 to $149,999 | 0 (0.0%) | 5 (100.0%) |
| $150,000 or more | 0 (0.0%) | 0 (0.0%) |
| Total | 118 (100.0%) | 5 (100.0%) |
Property Value to Household Income Ratio in Nixon
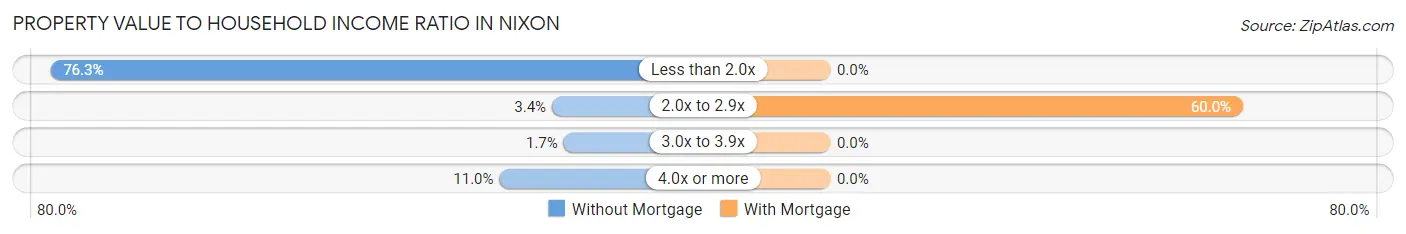
| Value-to-Income Ratio | Without Mortgage | With Mortgage |
| Less than 2.0x | 90 (76.3%) | 0 (0.0%) |
| 2.0x to 2.9x | 4 (3.4%) | 3 (60.0%) |
| 3.0x to 3.9x | 2 (1.7%) | 0 (0.0%) |
| 4.0x or more | 13 (11.0%) | 0 (0.0%) |
| Total | 118 (100.0%) | 5 (100.0%) |
Real Estate Taxes by Mortgage Status in Nixon
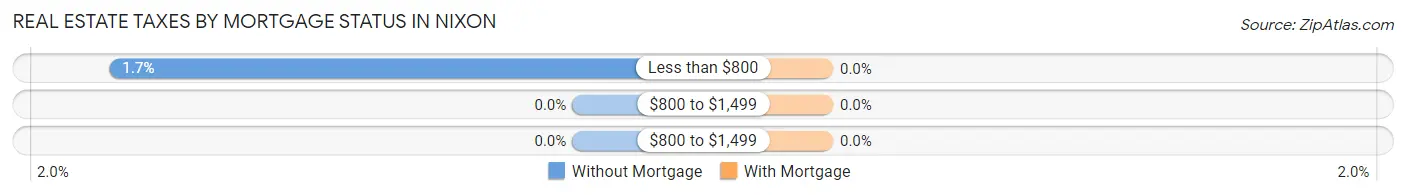
| Property Taxes | Without Mortgage | With Mortgage |
| Less than $800 | 2 (1.7%) | 0 (0.0%) |
| $800 to $1,499 | 0 (0.0%) | 0 (0.0%) |
| $800 to $1,499 | 0 (0.0%) | 0 (0.0%) |
| Total | 118 (100.0%) | 5 (100.0%) |
Health & Disability in Nixon
Health Insurance Coverage by Age in Nixon
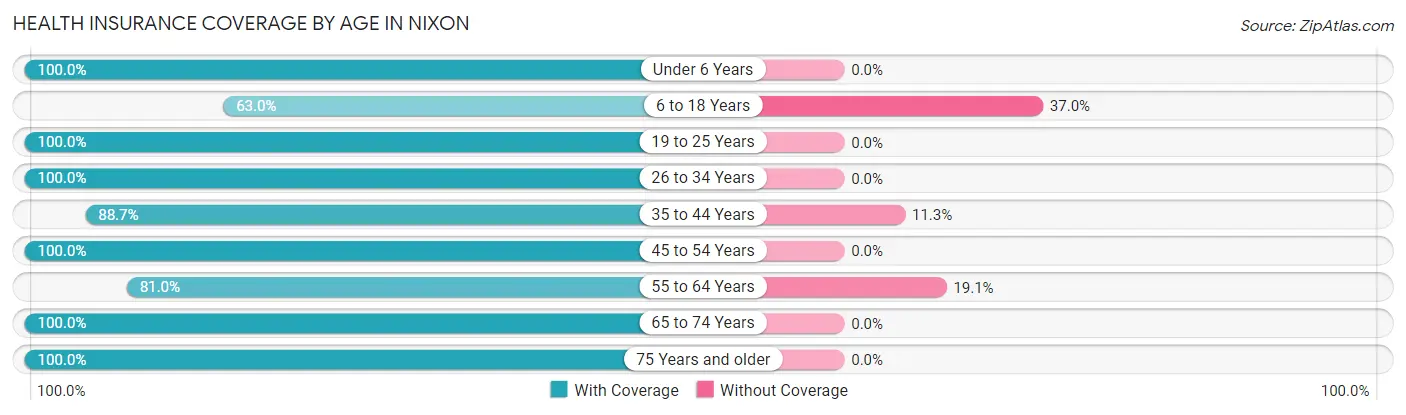
| Age Bracket | With Coverage | Without Coverage |
| Under 6 Years | 44 (100.0%) | 0 (0.0%) |
| 6 to 18 Years | 34 (63.0%) | 20 (37.0%) |
| 19 to 25 Years | 25 (100.0%) | 0 (0.0%) |
| 26 to 34 Years | 54 (100.0%) | 0 (0.0%) |
| 35 to 44 Years | 47 (88.7%) | 6 (11.3%) |
| 45 to 54 Years | 13 (100.0%) | 0 (0.0%) |
| 55 to 64 Years | 17 (80.9%) | 4 (19.1%) |
| 65 to 74 Years | 73 (100.0%) | 0 (0.0%) |
| 75 Years and older | 11 (100.0%) | 0 (0.0%) |
| Total | 318 (91.4%) | 30 (8.6%) |
Health Insurance Coverage by Citizenship Status in Nixon
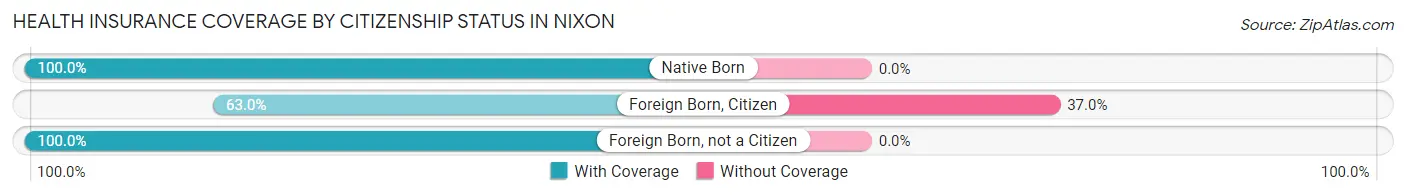
| Citizenship Status | With Coverage | Without Coverage |
| Native Born | 44 (100.0%) | 0 (0.0%) |
| Foreign Born, Citizen | 34 (63.0%) | 20 (37.0%) |
| Foreign Born, not a Citizen | 25 (100.0%) | 0 (0.0%) |
Health Insurance Coverage by Household Income in Nixon
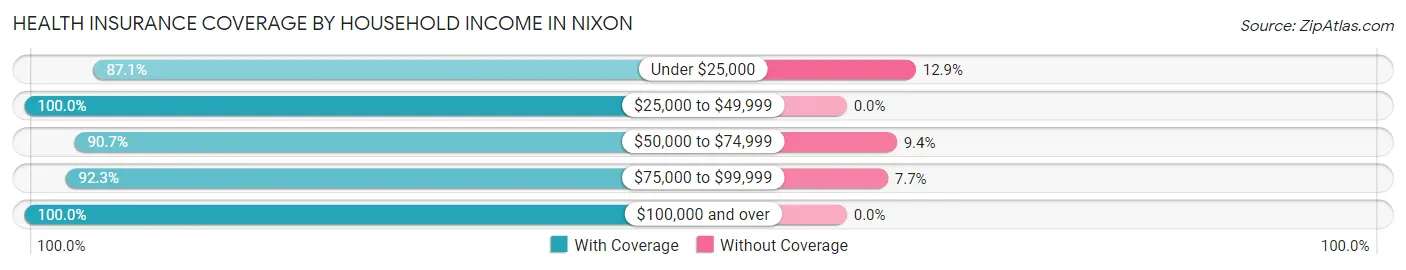
| Household Income | With Coverage | Without Coverage |
| Under $25,000 | 101 (87.1%) | 15 (12.9%) |
| $25,000 to $49,999 | 54 (100.0%) | 0 (0.0%) |
| $50,000 to $74,999 | 126 (90.6%) | 13 (9.3%) |
| $75,000 to $99,999 | 24 (92.3%) | 2 (7.7%) |
| $100,000 and over | 13 (100.0%) | 0 (0.0%) |
Public vs Private Health Insurance Coverage by Age in Nixon
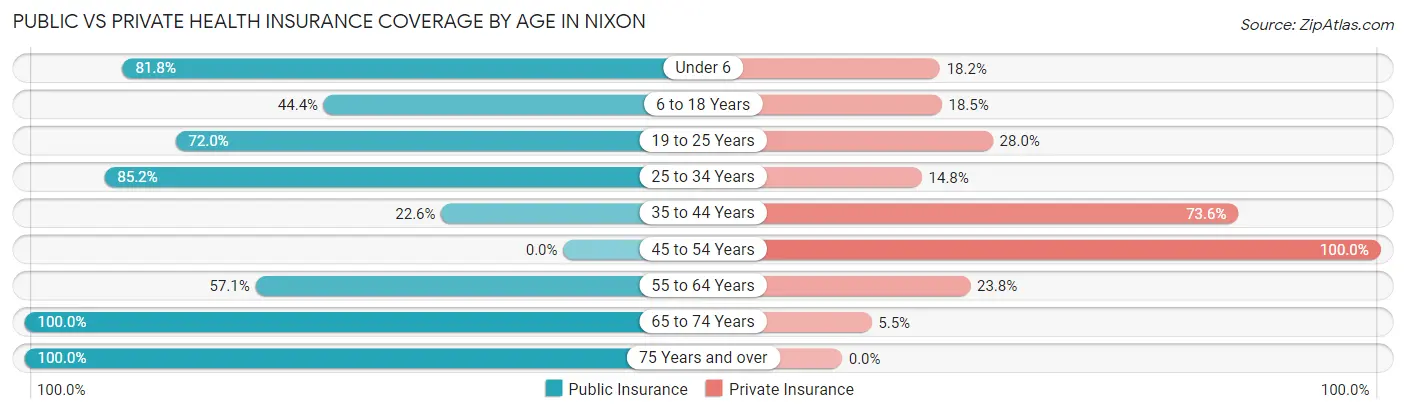
| Age Bracket | Public Insurance | Private Insurance |
| Under 6 | 36 (81.8%) | 8 (18.2%) |
| 6 to 18 Years | 24 (44.4%) | 10 (18.5%) |
| 19 to 25 Years | 18 (72.0%) | 7 (28.0%) |
| 25 to 34 Years | 46 (85.2%) | 8 (14.8%) |
| 35 to 44 Years | 12 (22.6%) | 39 (73.6%) |
| 45 to 54 Years | 0 (0.0%) | 13 (100.0%) |
| 55 to 64 Years | 12 (57.1%) | 5 (23.8%) |
| 65 to 74 Years | 73 (100.0%) | 4 (5.5%) |
| 75 Years and over | 11 (100.0%) | 0 (0.0%) |
| Total | 232 (66.7%) | 94 (27.0%) |
Disability Status by Sex by Age in Nixon
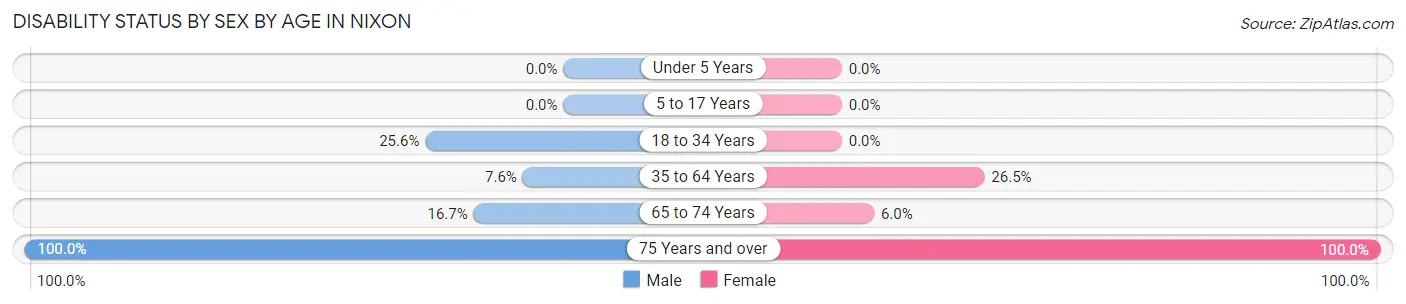
| Age Bracket | Male | Female |
| Under 5 Years | 0 (0.0%) | 0 (0.0%) |
| 5 to 17 Years | 0 (0.0%) | 0 (0.0%) |
| 18 to 34 Years | 10 (25.6%) | 0 (0.0%) |
| 35 to 64 Years | 4 (7.5%) | 9 (26.5%) |
| 65 to 74 Years | 1 (16.7%) | 4 (6.0%) |
| 75 Years and over | 8 (100.0%) | 3 (100.0%) |
Disability Class by Sex by Age in Nixon
Disability Class: Hearing Difficulty
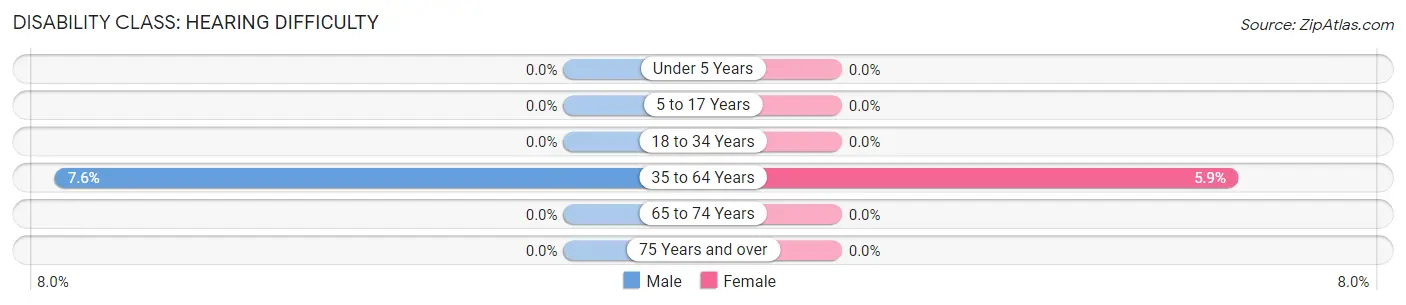
| Age Bracket | Male | Female |
| Under 5 Years | 0 (0.0%) | 0 (0.0%) |
| 5 to 17 Years | 0 (0.0%) | 0 (0.0%) |
| 18 to 34 Years | 0 (0.0%) | 0 (0.0%) |
| 35 to 64 Years | 4 (7.5%) | 2 (5.9%) |
| 65 to 74 Years | 0 (0.0%) | 0 (0.0%) |
| 75 Years and over | 0 (0.0%) | 0 (0.0%) |
Disability Class: Vision Difficulty
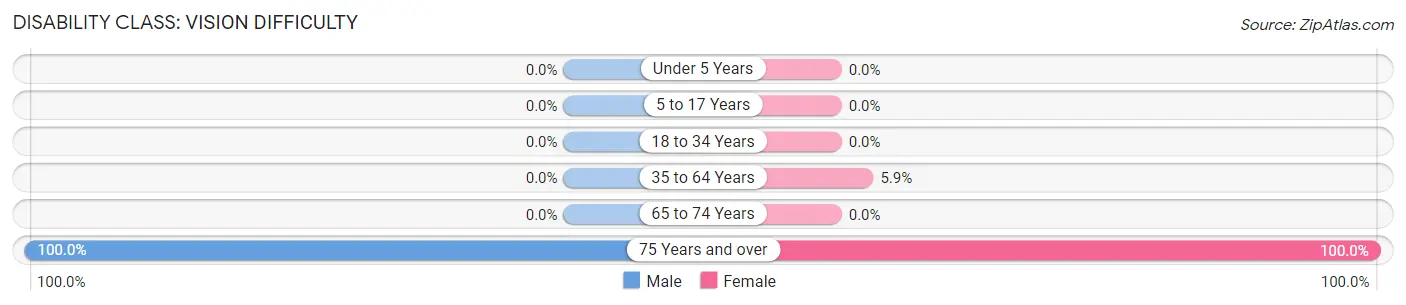
| Age Bracket | Male | Female |
| Under 5 Years | 0 (0.0%) | 0 (0.0%) |
| 5 to 17 Years | 0 (0.0%) | 0 (0.0%) |
| 18 to 34 Years | 0 (0.0%) | 0 (0.0%) |
| 35 to 64 Years | 0 (0.0%) | 2 (5.9%) |
| 65 to 74 Years | 0 (0.0%) | 0 (0.0%) |
| 75 Years and over | 8 (100.0%) | 3 (100.0%) |
Disability Class: Cognitive Difficulty
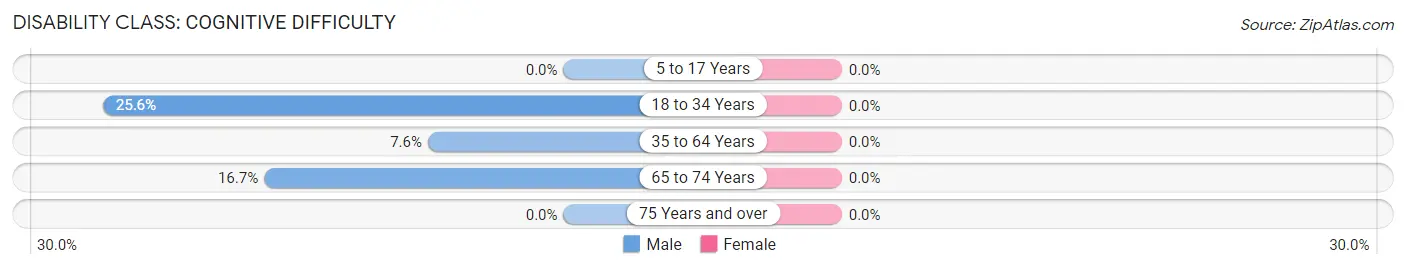
| Age Bracket | Male | Female |
| 5 to 17 Years | 0 (0.0%) | 0 (0.0%) |
| 18 to 34 Years | 10 (25.6%) | 0 (0.0%) |
| 35 to 64 Years | 4 (7.5%) | 0 (0.0%) |
| 65 to 74 Years | 1 (16.7%) | 0 (0.0%) |
| 75 Years and over | 0 (0.0%) | 0 (0.0%) |
Disability Class: Ambulatory Difficulty
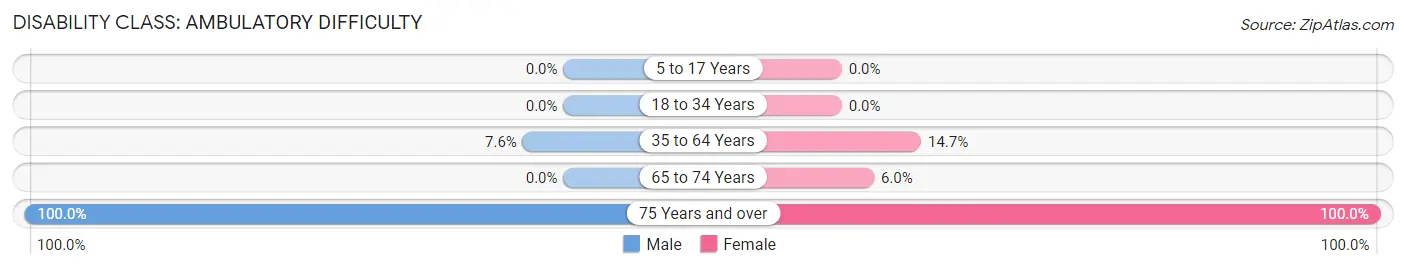
| Age Bracket | Male | Female |
| 5 to 17 Years | 0 (0.0%) | 0 (0.0%) |
| 18 to 34 Years | 0 (0.0%) | 0 (0.0%) |
| 35 to 64 Years | 4 (7.5%) | 5 (14.7%) |
| 65 to 74 Years | 0 (0.0%) | 4 (6.0%) |
| 75 Years and over | 8 (100.0%) | 3 (100.0%) |
Disability Class: Self-Care Difficulty
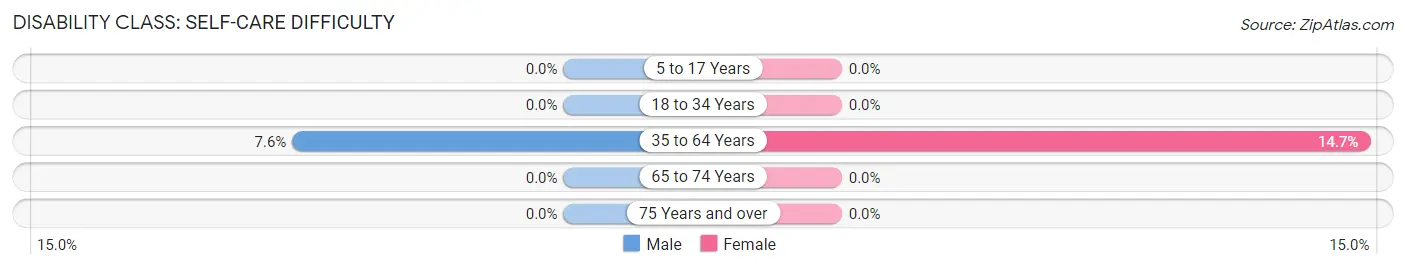
| Age Bracket | Male | Female |
| 5 to 17 Years | 0 (0.0%) | 0 (0.0%) |
| 18 to 34 Years | 0 (0.0%) | 0 (0.0%) |
| 35 to 64 Years | 4 (7.5%) | 5 (14.7%) |
| 65 to 74 Years | 0 (0.0%) | 0 (0.0%) |
| 75 Years and over | 0 (0.0%) | 0 (0.0%) |
Technology Access in Nixon
Computing Device Access in Nixon
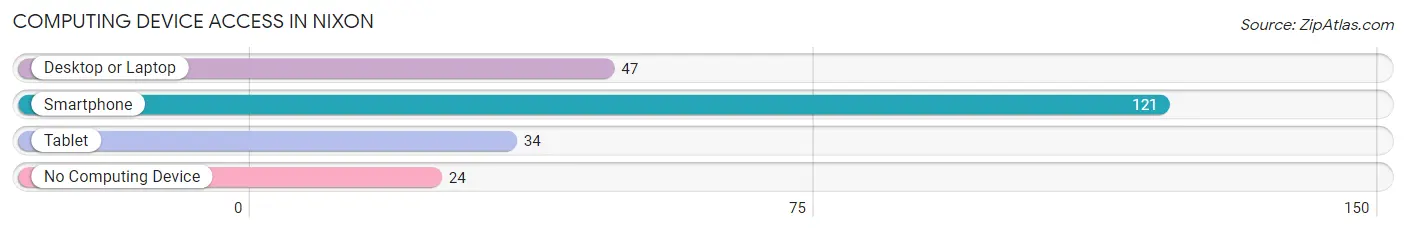
| Device Type | # Households | % Households |
| Desktop or Laptop | 47 | 32.0% |
| Smartphone | 121 | 82.3% |
| Tablet | 34 | 23.1% |
| No Computing Device | 24 | 16.3% |
| Total | 147 | 100.0% |
Internet Access in Nixon
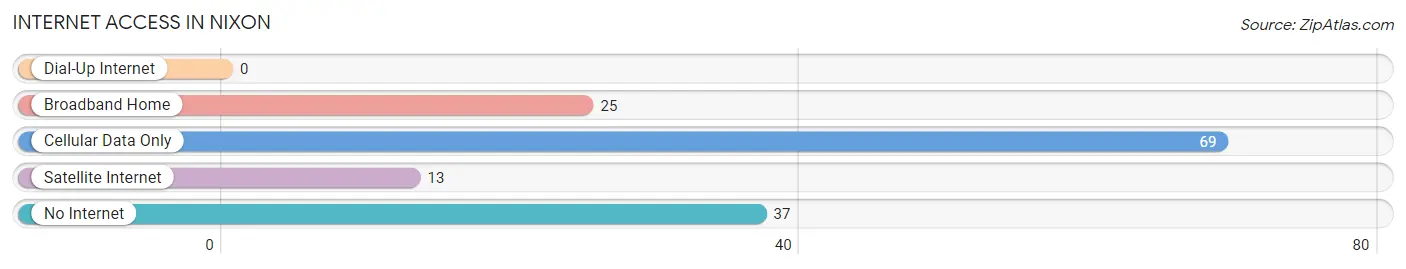
| Internet Type | # Households | % Households |
| Dial-Up Internet | 0 | 0.0% |
| Broadband Home | 25 | 17.0% |
| Cellular Data Only | 69 | 46.9% |
| Satellite Internet | 13 | 8.8% |
| No Internet | 37 | 25.2% |
| Total | 147 | 100.0% |
Nixon Summary
Nixon is a small town located in Washoe County, Nevada, United States. The town is situated in the Truckee Meadows region of the state, approximately 20 miles east of Reno. As of the 2010 census, the population of Nixon was 1,845.
History
Nixon was founded in 1868 by William Nixon, a rancher and miner who had moved to the area from California. The town was originally known as Nixon's Station, and was a stop on the Central Pacific Railroad. In 1871, the town was renamed Nixonville, and in 1873, it was renamed Nixon.
The town was an important stop on the Central Pacific Railroad, and was the site of a major train robbery in 1875. The robbery was committed by the infamous Reno Gang, and resulted in the theft of over $50,000 in gold and silver coins.
In the early 20th century, Nixon was a popular stop for travelers on the Lincoln Highway, the first transcontinental highway in the United States. The town was also home to a number of businesses, including a hotel, saloon, and general store.
Geography
Nixon is located in the Truckee Meadows region of Nevada, approximately 20 miles east of Reno. The town is situated at an elevation of 4,717 feet, and is surrounded by the Sierra Nevada mountain range.
The town is located in a semi-arid climate, with hot summers and cold winters. The average annual precipitation is 8.5 inches, and the average annual snowfall is 25 inches.
Economy
Nixon's economy is largely based on tourism and agriculture. The town is home to a number of tourist attractions, including the historic Nixon Hotel and the nearby Pyramid Lake.
Agriculture is also an important part of the local economy. The town is home to a number of farms and ranches, which produce a variety of crops, including alfalfa, hay, and wheat.
Demographics
As of the 2010 census, the population of Nixon was 1,845. The racial makeup of the town was 79.3% White, 0.7% African American, 1.2% Native American, 0.7% Asian, 0.1% Pacific Islander, 15.2% from other races, and 3.0% from two or more races. Hispanic or Latino of any race were 24.2% of the population.
The median household income in Nixon was $41,250, and the median family income was $45,938. The per capita income for the town was $19,945. About 11.2% of families and 14.2% of the population were below the poverty line, including 19.2% of those under age 18 and 8.3% of those age 65 or over.
Common Questions
What is Per Capita Income in Nixon?
Per Capita income in Nixon is $14,446.
What is the Median Family Income in Nixon?
Median Family Income in Nixon is $68,017.
What is the Median Household income in Nixon?
Median Household Income in Nixon is $67,608.
What is Income or Wage Gap in Nixon?
Income or Wage Gap in Nixon is 25.0%.
Women in Nixon earn 75.0 cents for every dollar earned by a man.
What is Inequality or Gini Index in Nixon?
Inequality or Gini Index in Nixon is 0.32.
What is the Total Population of Nixon?
Total Population of Nixon is 348.
What is the Total Male Population of Nixon?
Total Male Population of Nixon is 149.
What is the Total Female Population of Nixon?
Total Female Population of Nixon is 199.
What is the Ratio of Males per 100 Females in Nixon?
There are 74.87 Males per 100 Females in Nixon.
What is the Ratio of Females per 100 Males in Nixon?
There are 133.56 Females per 100 Males in Nixon.
What is the Median Population Age in Nixon?
Median Population Age in Nixon is 34.6 Years.
What is the Average Family Size in Nixon
Average Family Size in Nixon is 2.6 People.
What is the Average Household Size in Nixon
Average Household Size in Nixon is 2.4 People.
How Large is the Labor Force in Nixon?
There are 122 People in the Labor Forcein in Nixon.
What is the Percentage of People in the Labor Force in Nixon?
46.4% of People are in the Labor Force in Nixon.
What is the Unemployment Rate in Nixon?
Unemployment Rate in Nixon is 36.9%.