Gardnerville, NV Map & Demographics
Gardnerville Map
Gardnerville Overview
$34,288
PER CAPITA INCOME
$79,823
AVG FAMILY INCOME
$66,157
AVG HOUSEHOLD INCOME
42.9%
WAGE / INCOME GAP [ % ]
57.1¢/ $1
WAGE / INCOME GAP [ $ ]
0.42
INEQUALITY / GINI INDEX
6,147
TOTAL POPULATION
3,393
MALE POPULATION
2,754
FEMALE POPULATION
123.20
MALES / 100 FEMALES
81.17
FEMALES / 100 MALES
49.0
MEDIAN AGE
2.9
AVG FAMILY SIZE
2.1
AVG HOUSEHOLD SIZE
3,058
LABOR FORCE [ PEOPLE ]
55.9%
PERCENT IN LABOR FORCE
4.5%
UNEMPLOYMENT RATE
Gardnerville Area Codes
Income in Gardnerville
Income Overview in Gardnerville
Per Capita Income in Gardnerville is $34,288, while median incomes of families and households are $79,823 and $66,157 respectively.
| Characteristic | Number | Measure |
| Per Capita Income | 6,147 | $34,288 |
| Median Family Income | 1,568 | $79,823 |
| Mean Family Income | 1,568 | $91,083 |
| Median Household Income | 2,793 | $66,157 |
| Mean Household Income | 2,793 | $76,960 |
| Income Deficit | 1,568 | $0 |
| Wage / Income Gap (%) | 6,147 | 42.94% |
| Wage / Income Gap ($) | 6,147 | 57.06¢ per $1 |
| Gini / Inequality Index | 6,147 | 0.42 |
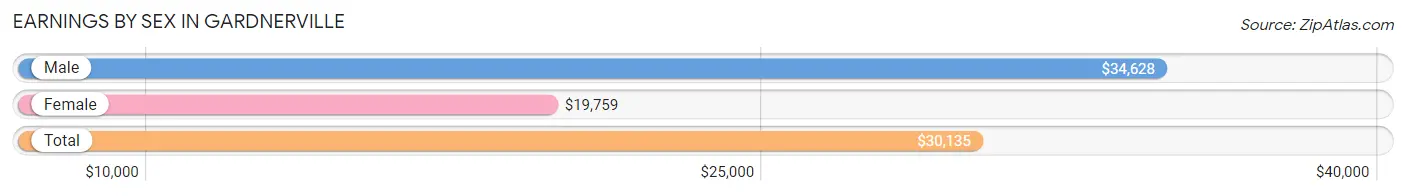
Earnings by Sex in Gardnerville
Average Earnings in Gardnerville are $30,135, $34,628 for men and $19,759 for women, a difference of 42.9%.
| Sex | Number | Average Earnings |
| Male | 1,728 (54.5%) | $34,628 |
| Female | 1,441 (45.5%) | $19,759 |
| Total | 3,169 (100.0%) | $30,135 |
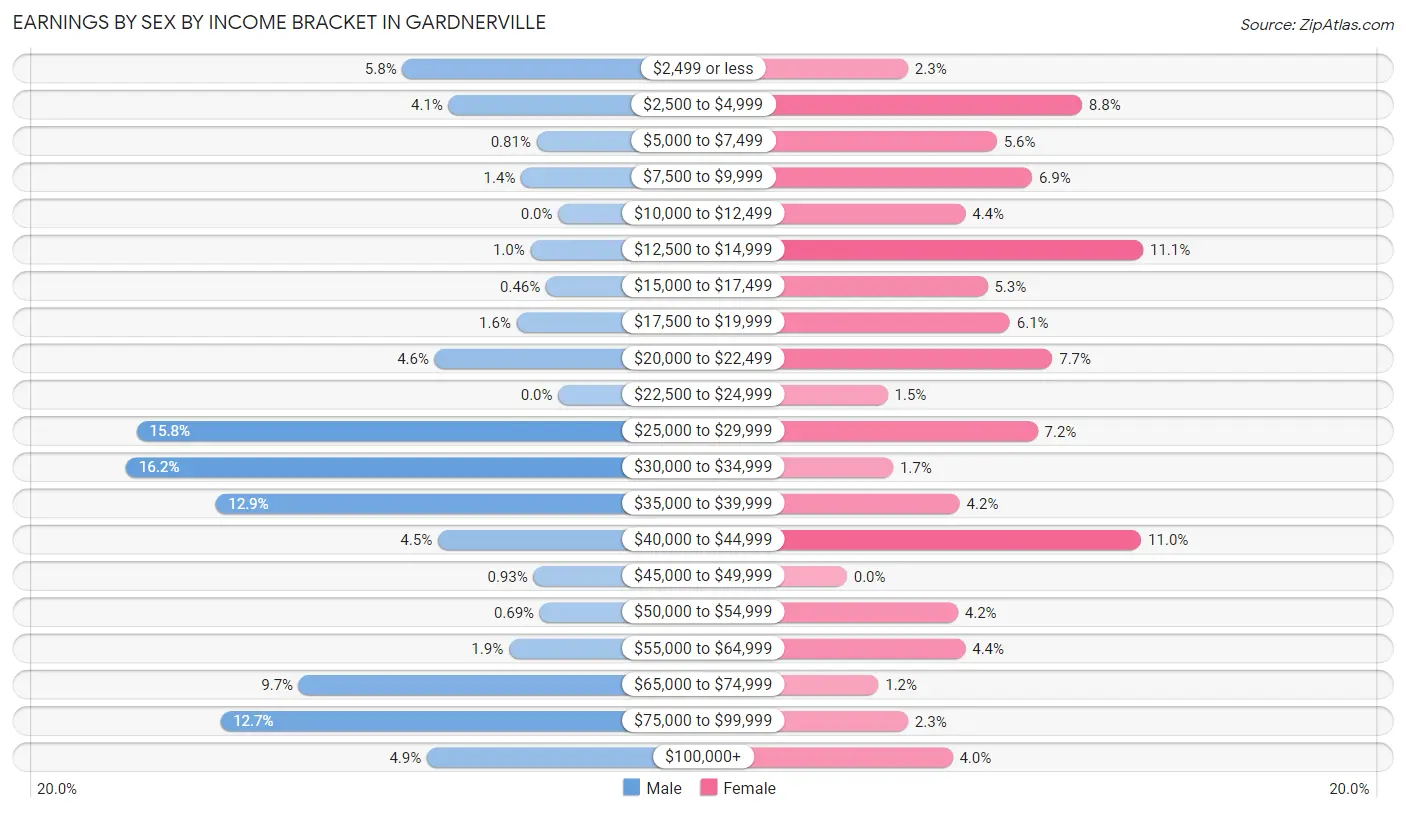
Earnings by Sex by Income Bracket in Gardnerville
The most common earnings brackets in Gardnerville are $30,000 to $34,999 for men (280 | 16.2%) and $12,500 to $14,999 for women (160 | 11.1%).
| Income | Male | Female |
| $2,499 or less | 101 (5.8%) | 33 (2.3%) |
| $2,500 to $4,999 | 71 (4.1%) | 127 (8.8%) |
| $5,000 to $7,499 | 14 (0.8%) | 81 (5.6%) |
| $7,500 to $9,999 | 24 (1.4%) | 100 (6.9%) |
| $10,000 to $12,499 | 0 (0.0%) | 64 (4.4%) |
| $12,500 to $14,999 | 18 (1.0%) | 160 (11.1%) |
| $15,000 to $17,499 | 8 (0.5%) | 76 (5.3%) |
| $17,500 to $19,999 | 27 (1.6%) | 88 (6.1%) |
| $20,000 to $22,499 | 80 (4.6%) | 111 (7.7%) |
| $22,500 to $24,999 | 0 (0.0%) | 22 (1.5%) |
| $25,000 to $29,999 | 273 (15.8%) | 103 (7.1%) |
| $30,000 to $34,999 | 280 (16.2%) | 25 (1.7%) |
| $35,000 to $39,999 | 222 (12.9%) | 61 (4.2%) |
| $40,000 to $44,999 | 78 (4.5%) | 159 (11.0%) |
| $45,000 to $49,999 | 16 (0.9%) | 0 (0.0%) |
| $50,000 to $54,999 | 12 (0.7%) | 60 (4.2%) |
| $55,000 to $64,999 | 32 (1.8%) | 64 (4.4%) |
| $65,000 to $74,999 | 168 (9.7%) | 17 (1.2%) |
| $75,000 to $99,999 | 219 (12.7%) | 33 (2.3%) |
| $100,000+ | 85 (4.9%) | 57 (4.0%) |
| Total | 1,728 (100.0%) | 1,441 (100.0%) |
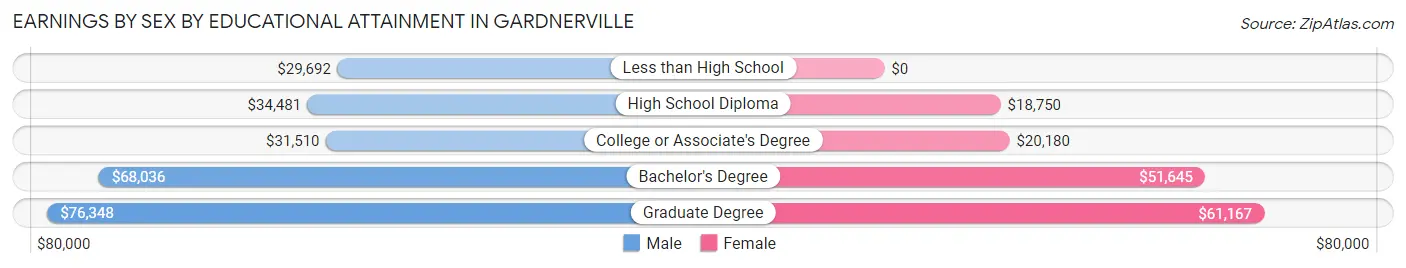
Earnings by Sex by Educational Attainment in Gardnerville
Average earnings in Gardnerville are $35,349 for men and $21,261 for women, a difference of 39.9%. Men with an educational attainment of graduate degree enjoy the highest average annual earnings of $76,348, while those with less than high school education earn the least with $29,692. Women with an educational attainment of graduate degree earn the most with the average annual earnings of $61,167, while those with high school diploma education have the smallest earnings of $18,750.
| Educational Attainment | Male Income | Female Income |
| Less than High School | $29,692 | $0 |
| High School Diploma | $34,481 | $18,750 |
| College or Associate's Degree | $31,510 | $20,180 |
| Bachelor's Degree | $68,036 | $51,645 |
| Graduate Degree | $76,348 | $61,167 |
| Total | $35,349 | $21,261 |
Family Income in Gardnerville
Family Income Brackets in Gardnerville
According to the Gardnerville family income data, there are 397 families falling into the $100,000 to $149,999 income range, which is the most common income bracket and makes up 25.3% of all families.
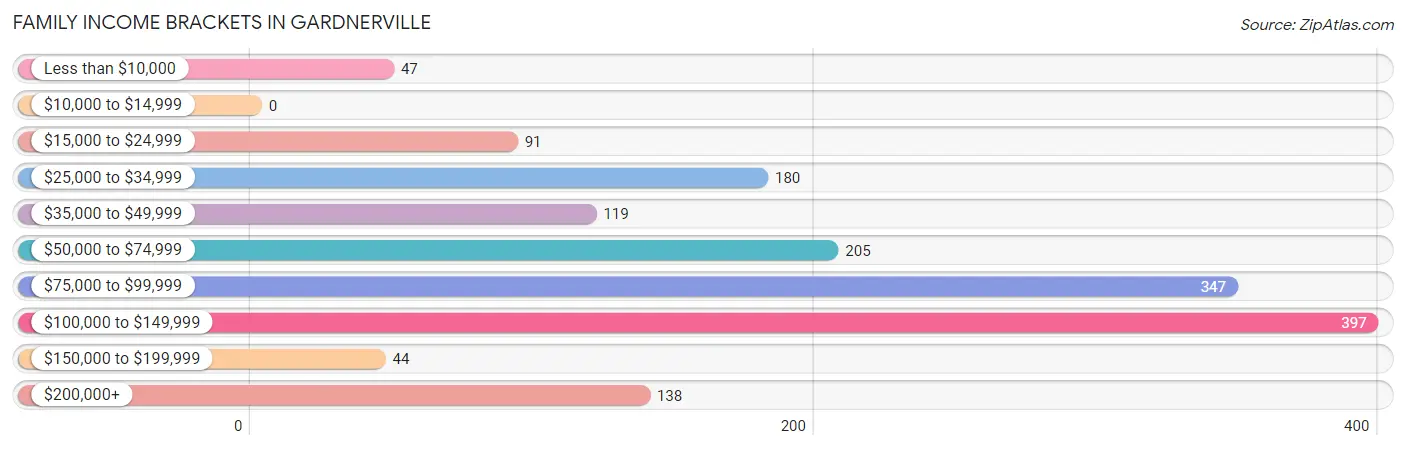
| Income Bracket | # Families | % Families |
| Less than $10,000 | 47 | 3.0% |
| $10,000 to $14,999 | 0 | 0.0% |
| $15,000 to $24,999 | 91 | 5.8% |
| $25,000 to $34,999 | 180 | 11.5% |
| $35,000 to $49,999 | 119 | 7.6% |
| $50,000 to $74,999 | 205 | 13.1% |
| $75,000 to $99,999 | 347 | 22.1% |
| $100,000 to $149,999 | 397 | 25.3% |
| $150,000 to $199,999 | 44 | 2.8% |
| $200,000+ | 138 | 8.8% |
Family Income by Famaliy Size in Gardnerville
3-person families (353 | 22.5%) account for the highest median family income in Gardnerville with $117,054 per family, while 3-person families (353 | 22.5%) have the highest median income of $39,018 per family member.
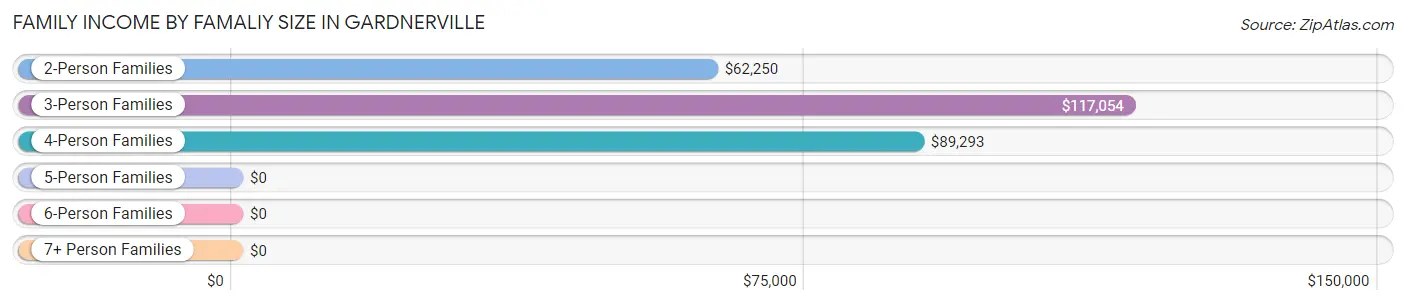
| Income Bracket | # Families | Median Income |
| 2-Person Families | 771 (49.2%) | $62,250 |
| 3-Person Families | 353 (22.5%) | $117,054 |
| 4-Person Families | 255 (16.3%) | $89,293 |
| 5-Person Families | 152 (9.7%) | $0 |
| 6-Person Families | 31 (2.0%) | $0 |
| 7+ Person Families | 6 (0.4%) | $0 |
| Total | 1,568 (100.0%) | $79,823 |
Family Income by Number of Earners in Gardnerville
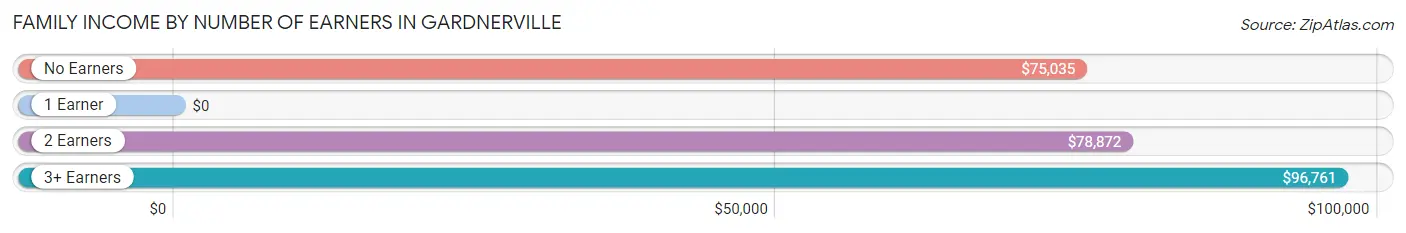
| Number of Earners | # Families | Median Income |
| No Earners | 471 (30.0%) | $75,035 |
| 1 Earner | 349 (22.3%) | $0 |
| 2 Earners | 534 (34.1%) | $78,872 |
| 3+ Earners | 214 (13.7%) | $96,761 |
| Total | 1,568 (100.0%) | $79,823 |
Household Income in Gardnerville
Household Income Brackets in Gardnerville
With 506 households falling in the category, the $50,000 to $74,999 income range is the most frequent in Gardnerville, accounting for 18.1% of all households. In contrast, only 137 households (4.9%) fall into the $10,000 to $14,999 income bracket, making it the least populous group.
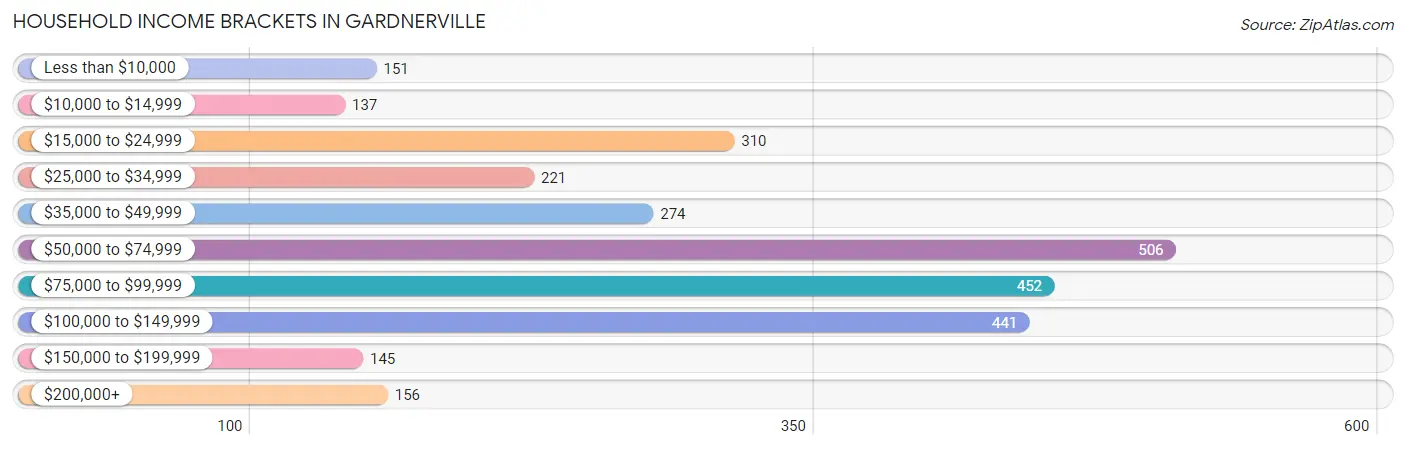
| Income Bracket | # Households | % Households |
| Less than $10,000 | 151 | 5.4% |
| $10,000 to $14,999 | 137 | 4.9% |
| $15,000 to $24,999 | 310 | 11.1% |
| $25,000 to $34,999 | 221 | 7.9% |
| $35,000 to $49,999 | 274 | 9.8% |
| $50,000 to $74,999 | 506 | 18.1% |
| $75,000 to $99,999 | 452 | 16.2% |
| $100,000 to $149,999 | 441 | 15.8% |
| $150,000 to $199,999 | 145 | 5.2% |
| $200,000+ | 156 | 5.6% |
Household Income by Householder Age in Gardnerville
The median household income in Gardnerville is $66,157, with the highest median household income of $70,665 found in the 45 to 64 years age bracket for the primary householder. A total of 1,076 households (38.5%) fall into this category.
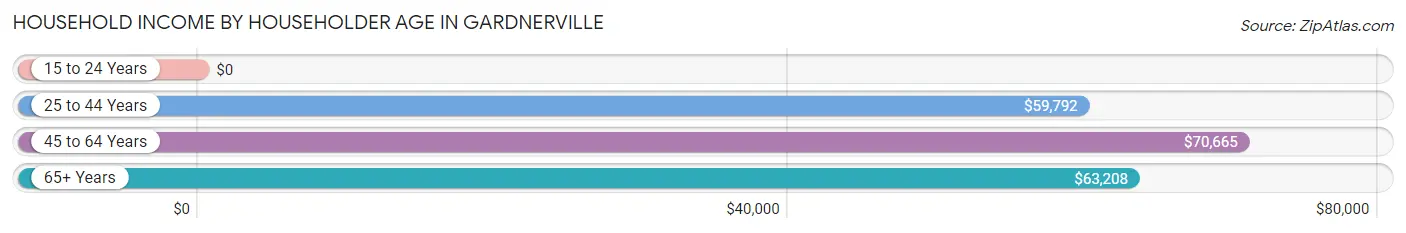
| Income Bracket | # Households | Median Income |
| 15 to 24 Years | 0 (0.0%) | $0 |
| 25 to 44 Years | 723 (25.9%) | $59,792 |
| 45 to 64 Years | 1,076 (38.5%) | $70,665 |
| 65+ Years | 994 (35.6%) | $63,208 |
| Total | 2,793 (100.0%) | $66,157 |
Poverty in Gardnerville
Income Below Poverty by Sex and Age in Gardnerville
With 9.1% poverty level for males and 10.8% for females among the residents of Gardnerville, 12 to 14 year old males and 55 to 64 year old females are the most vulnerable to poverty, with 29 males (74.4%) and 86 females (22.6%) in their respective age groups living below the poverty level.
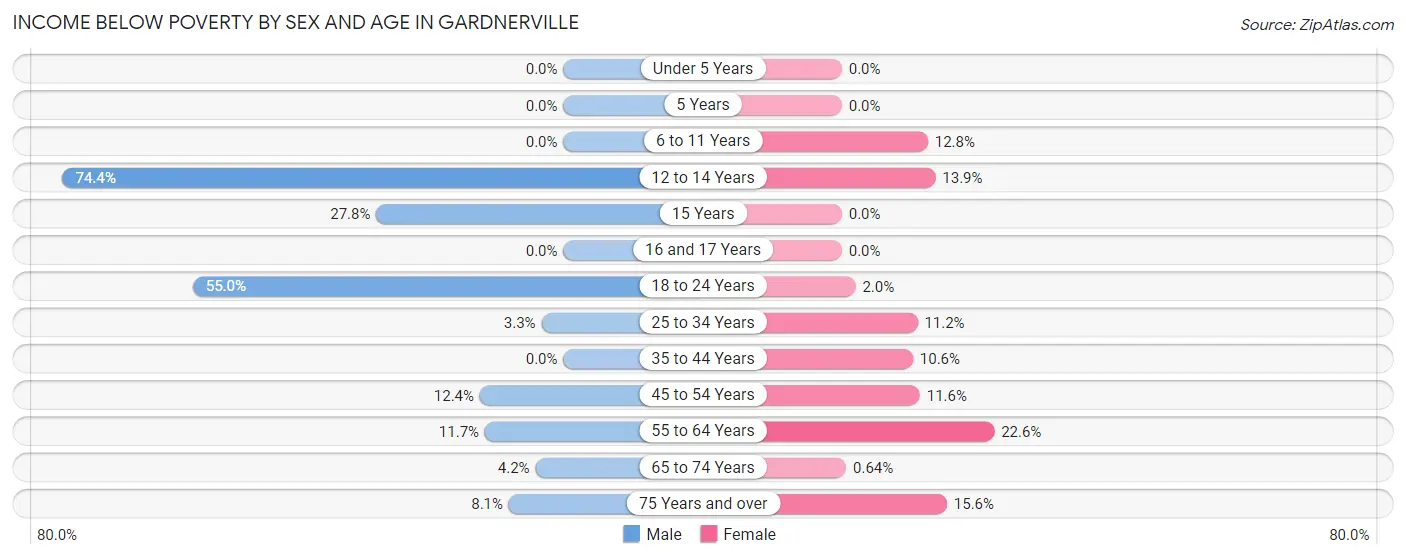
| Age Bracket | Male | Female |
| Under 5 Years | 0 (0.0%) | 0 (0.0%) |
| 5 Years | 0 (0.0%) | 0 (0.0%) |
| 6 to 11 Years | 0 (0.0%) | 6 (12.8%) |
| 12 to 14 Years | 29 (74.4%) | 5 (13.9%) |
| 15 Years | 5 (27.8%) | 0 (0.0%) |
| 16 and 17 Years | 0 (0.0%) | 0 (0.0%) |
| 18 to 24 Years | 115 (55.0%) | 3 (2.0%) |
| 25 to 34 Years | 18 (3.3%) | 43 (11.2%) |
| 35 to 44 Years | 0 (0.0%) | 25 (10.5%) |
| 45 to 54 Years | 30 (12.4%) | 47 (11.6%) |
| 55 to 64 Years | 67 (11.7%) | 86 (22.6%) |
| 65 to 74 Years | 17 (4.2%) | 3 (0.6%) |
| 75 Years and over | 22 (8.1%) | 78 (15.6%) |
| Total | 303 (9.1%) | 296 (10.8%) |
Income Above Poverty by Sex and Age in Gardnerville
According to the poverty statistics in Gardnerville, males aged under 5 years and females aged under 5 years are the age groups that are most secure financially, with 100.0% of males and 100.0% of females in these age groups living above the poverty line.
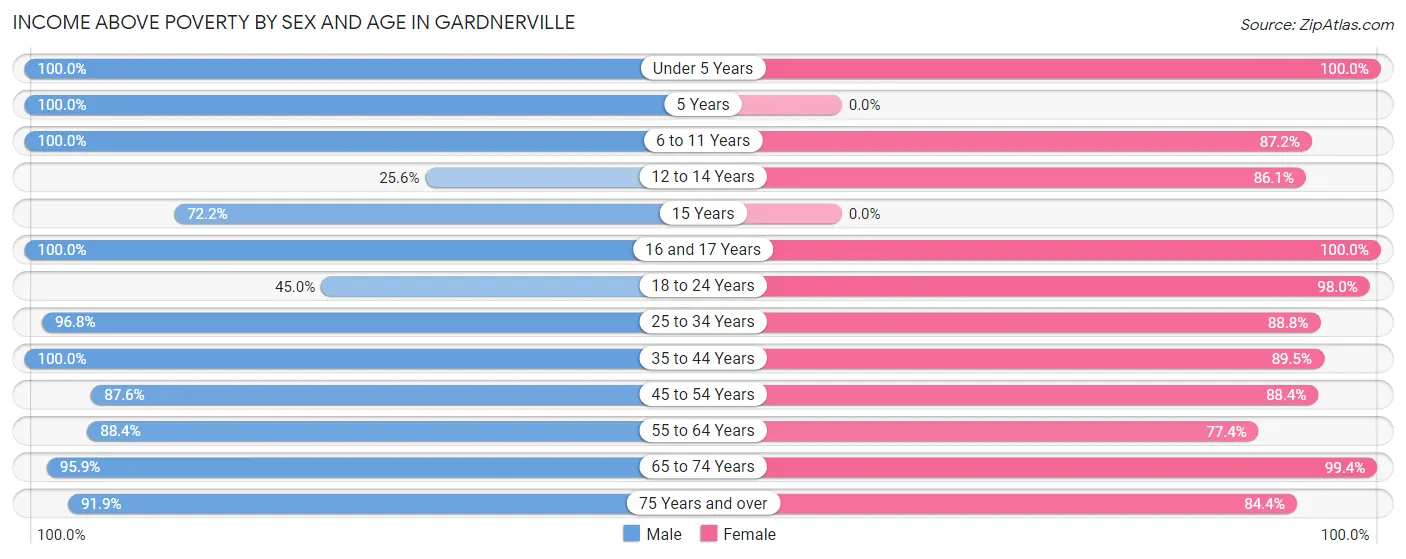
| Age Bracket | Male | Female |
| Under 5 Years | 83 (100.0%) | 117 (100.0%) |
| 5 Years | 37 (100.0%) | 0 (0.0%) |
| 6 to 11 Years | 299 (100.0%) | 41 (87.2%) |
| 12 to 14 Years | 10 (25.6%) | 31 (86.1%) |
| 15 Years | 13 (72.2%) | 0 (0.0%) |
| 16 and 17 Years | 149 (100.0%) | 5 (100.0%) |
| 18 to 24 Years | 94 (45.0%) | 145 (98.0%) |
| 25 to 34 Years | 536 (96.8%) | 340 (88.8%) |
| 35 to 44 Years | 447 (100.0%) | 212 (89.4%) |
| 45 to 54 Years | 212 (87.6%) | 359 (88.4%) |
| 55 to 64 Years | 508 (88.3%) | 294 (77.4%) |
| 65 to 74 Years | 393 (95.9%) | 468 (99.4%) |
| 75 Years and over | 250 (91.9%) | 422 (84.4%) |
| Total | 3,031 (90.9%) | 2,434 (89.2%) |
Income Below Poverty Among Married-Couple Families in Gardnerville
The poverty statistics for married-couple families in Gardnerville show that 1.5% or 18 of the total 1,173 families live below the poverty line. Families with 3 or 4 children have the highest poverty rate of 3.9%, comprising of 5 families. On the other hand, families with 1 or 2 children have the lowest poverty rate of 0.0%, which includes 0 families.
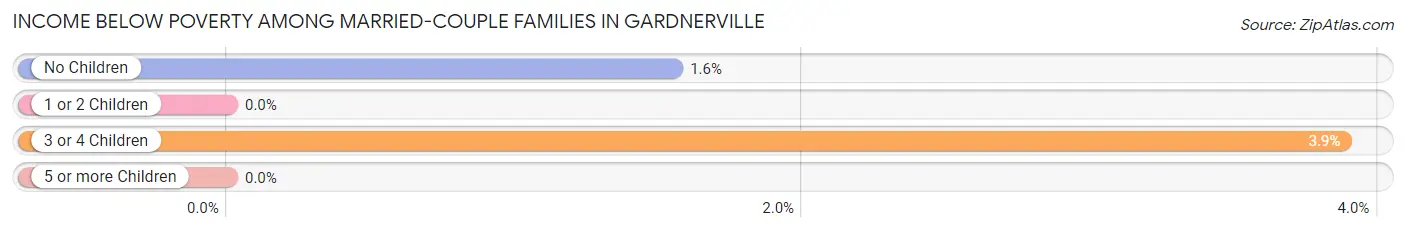
| Children | Above Poverty | Below Poverty |
| No Children | 825 (98.5%) | 13 (1.5%) |
| 1 or 2 Children | 200 (100.0%) | 0 (0.0%) |
| 3 or 4 Children | 124 (96.1%) | 5 (3.9%) |
| 5 or more Children | 6 (100.0%) | 0 (0.0%) |
| Total | 1,155 (98.5%) | 18 (1.5%) |
Income Below Poverty Among Single-Parent Households in Gardnerville
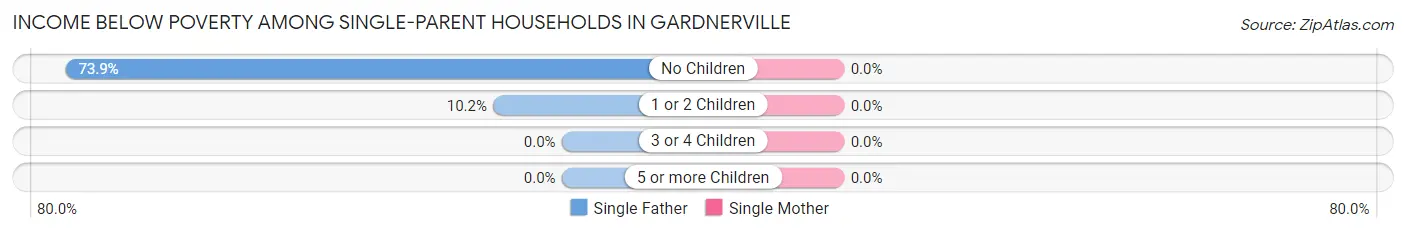
| Children | Single Father | Single Mother |
| No Children | 51 (73.9%) | 0 (0.0%) |
| 1 or 2 Children | 18 (10.2%) | 0 (0.0%) |
| 3 or 4 Children | 0 (0.0%) | 0 (0.0%) |
| 5 or more Children | 0 (0.0%) | 0 (0.0%) |
| Total | 69 (28.2%) | 0 (0.0%) |
Income Below Poverty Among Married-Couple vs Single-Parent Households in Gardnerville
The poverty data for Gardnerville shows that 18 of the married-couple family households (1.5%) and 69 of the single-parent households (17.5%) are living below the poverty level. Within the married-couple family households, those with 3 or 4 children have the highest poverty rate, with 5 households (3.9%) falling below the poverty line. Among the single-parent households, those with no children have the highest poverty rate, with 51 household (25.0%) living below poverty.
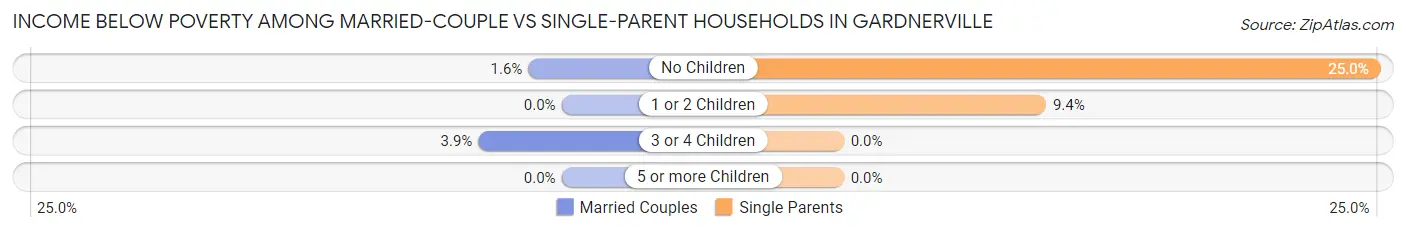
| Children | Married-Couple Families | Single-Parent Households |
| No Children | 13 (1.5%) | 51 (25.0%) |
| 1 or 2 Children | 0 (0.0%) | 18 (9.4%) |
| 3 or 4 Children | 5 (3.9%) | 0 (0.0%) |
| 5 or more Children | 0 (0.0%) | 0 (0.0%) |
| Total | 18 (1.5%) | 69 (17.5%) |
Race in Gardnerville
The most populous races in Gardnerville are White / Caucasian (5,142 | 83.7%), Hispanic or Latino (1,241 | 20.2%), and Two or more Races (369 | 6.0%).
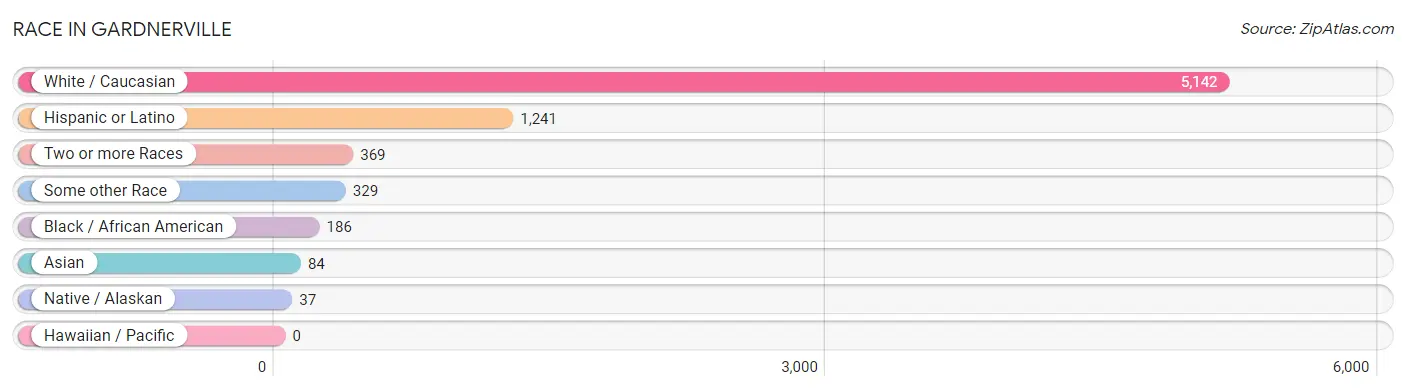
| Race | # Population | % Population |
| Asian | 84 | 1.4% |
| Black / African American | 186 | 3.0% |
| Hawaiian / Pacific | 0 | 0.0% |
| Hispanic or Latino | 1,241 | 20.2% |
| Native / Alaskan | 37 | 0.6% |
| White / Caucasian | 5,142 | 83.7% |
| Two or more Races | 369 | 6.0% |
| Some other Race | 329 | 5.3% |
| Total | 6,147 | 100.0% |
Ancestry in Gardnerville
The most populous ancestries reported in Gardnerville are Irish (1,157 | 18.8%), Mexican (1,061 | 17.3%), German (895 | 14.6%), English (758 | 12.3%), and Italian (370 | 6.0%), together accounting for 69.0% of all Gardnerville residents.
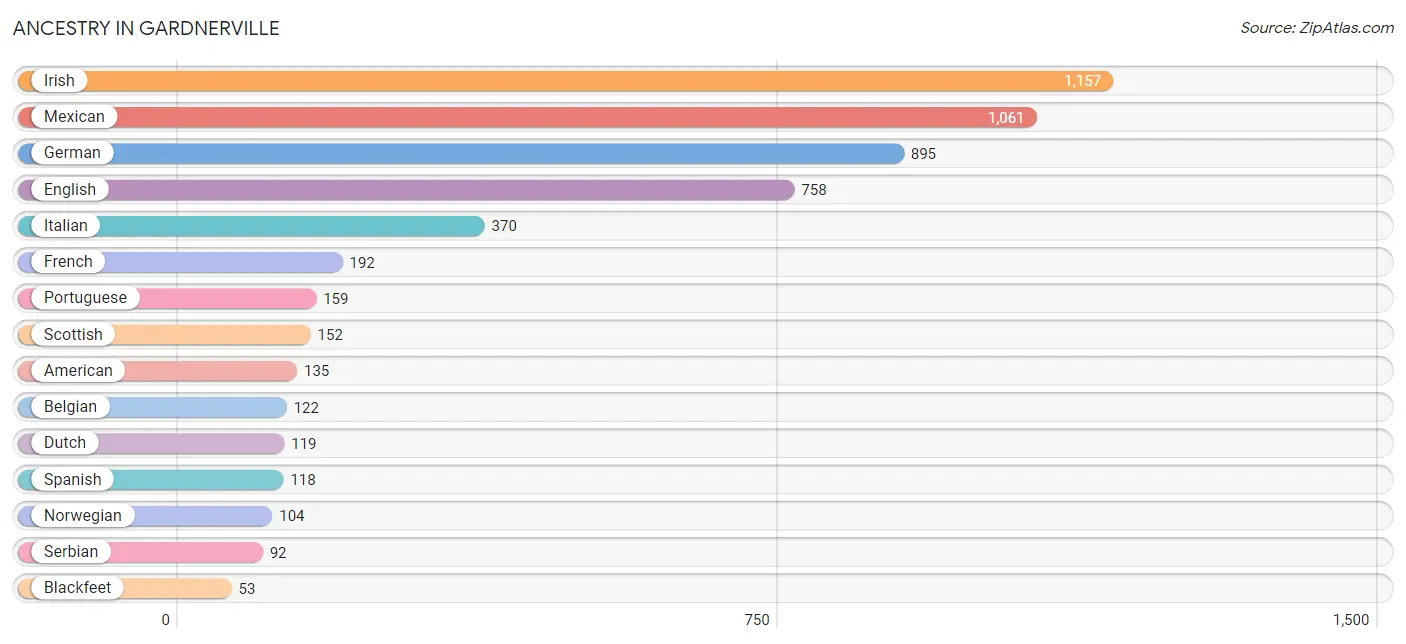
| Ancestry | # Population | % Population |
| American | 135 | 2.2% |
| Arab | 49 | 0.8% |
| Armenian | 19 | 0.3% |
| Austrian | 51 | 0.8% |
| Basque | 12 | 0.2% |
| Belgian | 122 | 2.0% |
| Blackfeet | 53 | 0.9% |
| British | 37 | 0.6% |
| Burmese | 23 | 0.4% |
| Colombian | 35 | 0.6% |
| Czech | 13 | 0.2% |
| Danish | 34 | 0.5% |
| Dutch | 119 | 1.9% |
| English | 758 | 12.3% |
| European | 24 | 0.4% |
| French | 192 | 3.1% |
| French Canadian | 45 | 0.7% |
| German | 895 | 14.6% |
| Hungarian | 51 | 0.8% |
| Indian (Asian) | 2 | 0.0% |
| Irish | 1,157 | 18.8% |
| Italian | 370 | 6.0% |
| Korean | 52 | 0.9% |
| Laotian | 39 | 0.6% |
| Lebanese | 10 | 0.2% |
| Lithuanian | 13 | 0.2% |
| Mexican | 1,061 | 17.3% |
| Native Hawaiian | 28 | 0.5% |
| Norwegian | 104 | 1.7% |
| Polish | 25 | 0.4% |
| Portuguese | 159 | 2.6% |
| Russian | 49 | 0.8% |
| Scandinavian | 51 | 0.8% |
| Scotch-Irish | 38 | 0.6% |
| Scottish | 152 | 2.5% |
| Serbian | 92 | 1.5% |
| South American | 35 | 0.6% |
| Spaniard | 27 | 0.4% |
| Spanish | 118 | 1.9% |
| Sri Lankan | 39 | 0.6% |
| Swedish | 44 | 0.7% |
| Swiss | 24 | 0.4% |
| Welsh | 29 | 0.5% | View All 43 Rows |
Immigrants in Gardnerville
The most numerous immigrant groups reported in Gardnerville came from Latin America (421 | 6.9%), Central America (386 | 6.3%), Mexico (386 | 6.3%), Europe (159 | 2.6%), and Asia (126 | 2.1%), together accounting for 24.0% of all Gardnerville residents.
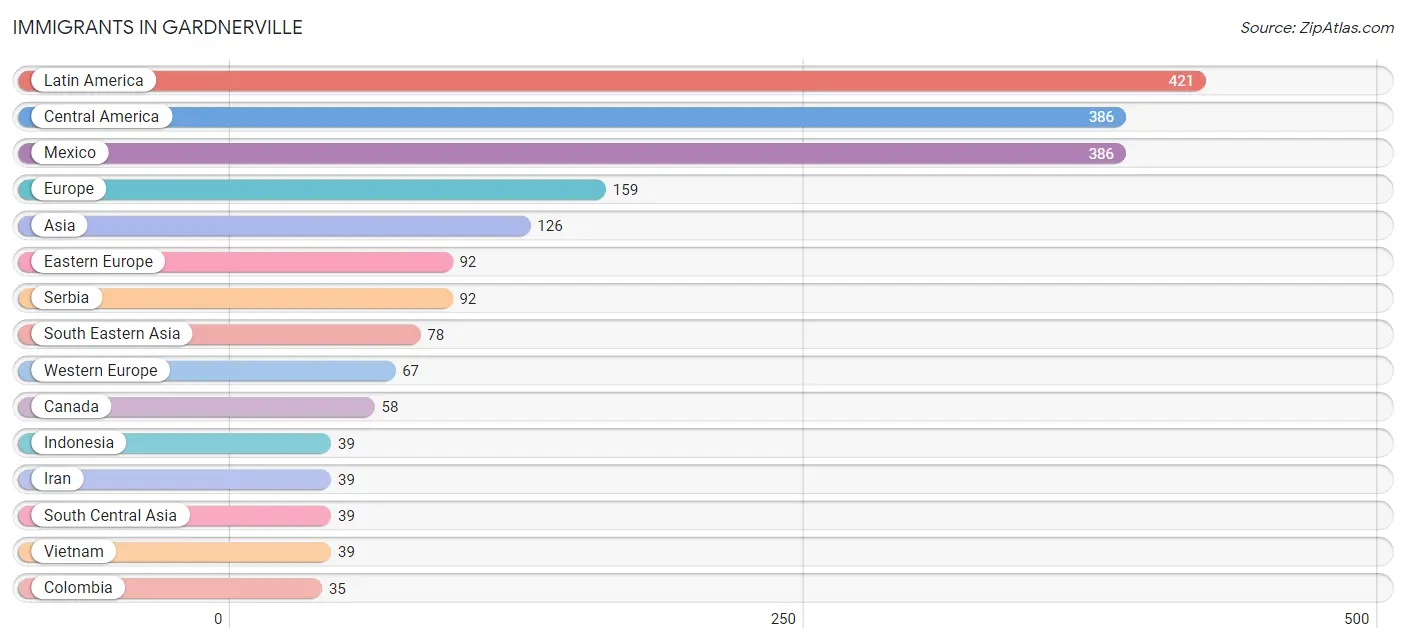
| Immigration Origin | # Population | % Population |
| Africa | 13 | 0.2% |
| Asia | 126 | 2.1% |
| Canada | 58 | 0.9% |
| Central America | 386 | 6.3% |
| Colombia | 35 | 0.6% |
| Eastern Europe | 92 | 1.5% |
| Europe | 159 | 2.6% |
| France | 13 | 0.2% |
| Germany | 32 | 0.5% |
| Indonesia | 39 | 0.6% |
| Iran | 39 | 0.6% |
| Latin America | 421 | 6.9% |
| Mexico | 386 | 6.3% |
| Middle Africa | 13 | 0.2% |
| Netherlands | 22 | 0.4% |
| Serbia | 92 | 1.5% |
| South America | 35 | 0.6% |
| South Central Asia | 39 | 0.6% |
| South Eastern Asia | 78 | 1.3% |
| Syria | 9 | 0.2% |
| Vietnam | 39 | 0.6% |
| Western Asia | 9 | 0.2% |
| Western Europe | 67 | 1.1% | View All 23 Rows |
Sex and Age in Gardnerville
Sex and Age in Gardnerville
The most populous age groups in Gardnerville are 25 to 29 Years (382 | 11.3%) for men and 65 to 69 Years (274 | 10.0%) for women.
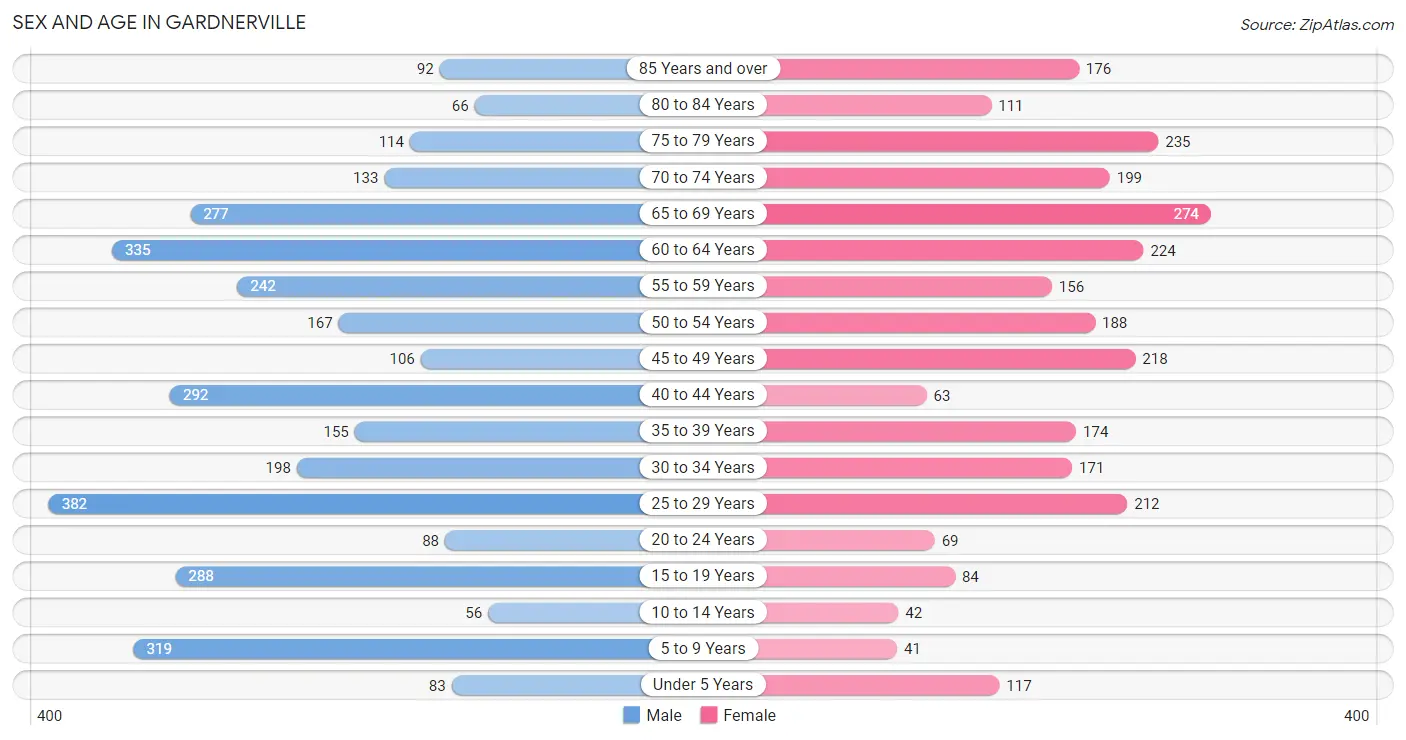
| Age Bracket | Male | Female |
| Under 5 Years | 83 (2.5%) | 117 (4.3%) |
| 5 to 9 Years | 319 (9.4%) | 41 (1.5%) |
| 10 to 14 Years | 56 (1.7%) | 42 (1.5%) |
| 15 to 19 Years | 288 (8.5%) | 84 (3.0%) |
| 20 to 24 Years | 88 (2.6%) | 69 (2.5%) |
| 25 to 29 Years | 382 (11.3%) | 212 (7.7%) |
| 30 to 34 Years | 198 (5.8%) | 171 (6.2%) |
| 35 to 39 Years | 155 (4.6%) | 174 (6.3%) |
| 40 to 44 Years | 292 (8.6%) | 63 (2.3%) |
| 45 to 49 Years | 106 (3.1%) | 218 (7.9%) |
| 50 to 54 Years | 167 (4.9%) | 188 (6.8%) |
| 55 to 59 Years | 242 (7.1%) | 156 (5.7%) |
| 60 to 64 Years | 335 (9.9%) | 224 (8.1%) |
| 65 to 69 Years | 277 (8.2%) | 274 (10.0%) |
| 70 to 74 Years | 133 (3.9%) | 199 (7.2%) |
| 75 to 79 Years | 114 (3.4%) | 235 (8.5%) |
| 80 to 84 Years | 66 (1.9%) | 111 (4.0%) |
| 85 Years and over | 92 (2.7%) | 176 (6.4%) |
| Total | 3,393 (100.0%) | 2,754 (100.0%) |
Families and Households in Gardnerville
Median Family Size in Gardnerville
The median family size in Gardnerville is 2.90 persons per family, with single male/father families (245 | 15.6%) accounting for the largest median family size of 3.15 persons per family. On the other hand, single female/mother families (150 | 9.6%) represent the smallest median family size with 1.70 persons per family.
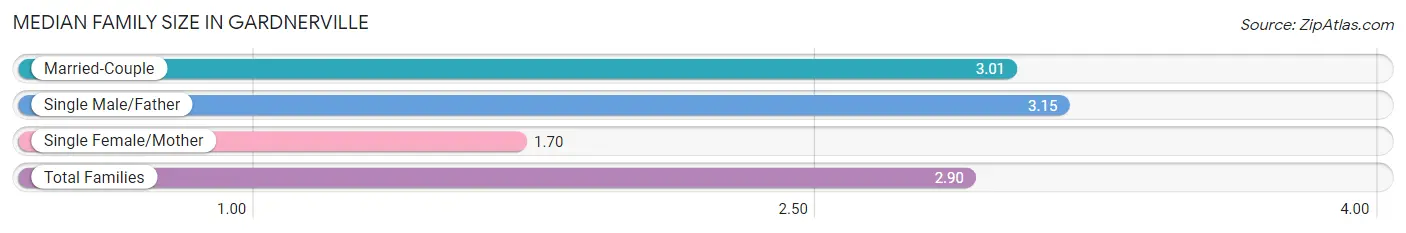
| Family Type | # Families | Family Size |
| Married-Couple | 1,173 (74.8%) | 3.01 |
| Single Male/Father | 245 (15.6%) | 3.15 |
| Single Female/Mother | 150 (9.6%) | 1.70 |
| Total Families | 1,568 (100.0%) | 2.90 |
Median Household Size in Gardnerville
The median household size in Gardnerville is 2.15 persons per household, with single male/father households (245 | 8.8%) accounting for the largest median household size of 3.22 persons per household. non-family households (1,225 | 43.9%) represent the smallest median household size with 1.13 persons per household.
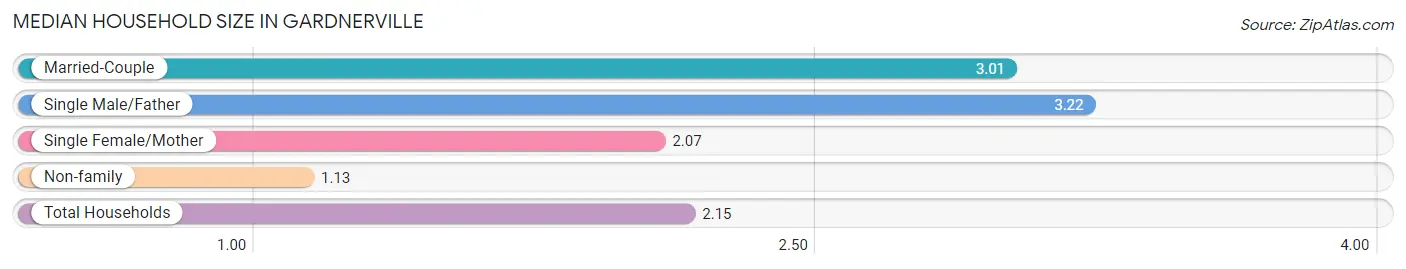
| Household Type | # Households | Household Size |
| Married-Couple | 1,173 (42.0%) | 3.01 |
| Single Male/Father | 245 (8.8%) | 3.22 |
| Single Female/Mother | 150 (5.4%) | 2.07 |
| Non-family | 1,225 (43.9%) | 1.13 |
| Total Households | 2,793 (100.0%) | 2.15 |
Household Size by Marriage Status in Gardnerville
Out of a total of 2,793 households in Gardnerville, 1,568 (56.1%) are family households, while 1,225 (43.9%) are nonfamily households. The most numerous type of family households are 2-person households, comprising 677, and the most common type of nonfamily households are 1-person households, comprising 1,034.
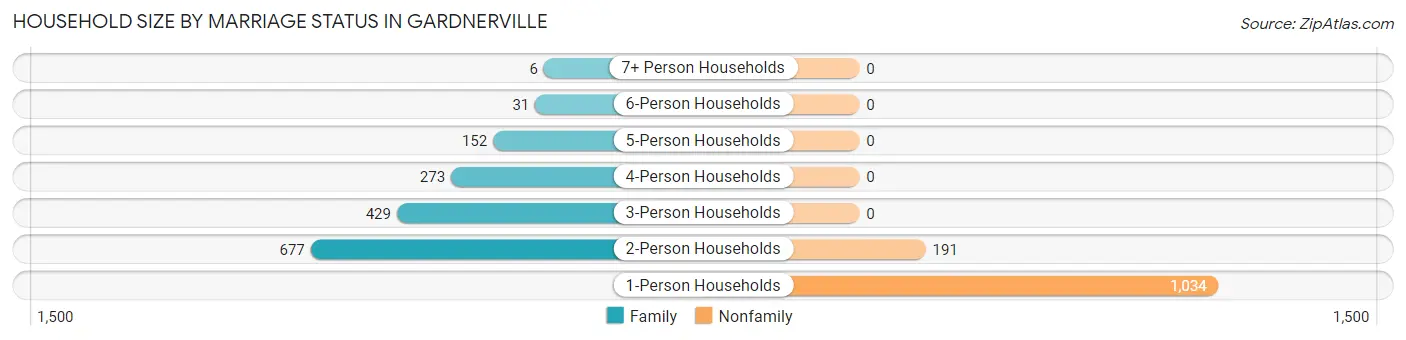
| Household Size | Family Households | Nonfamily Households |
| 1-Person Households | - | 1,034 (37.0%) |
| 2-Person Households | 677 (24.2%) | 191 (6.8%) |
| 3-Person Households | 429 (15.4%) | 0 (0.0%) |
| 4-Person Households | 273 (9.8%) | 0 (0.0%) |
| 5-Person Households | 152 (5.4%) | 0 (0.0%) |
| 6-Person Households | 31 (1.1%) | 0 (0.0%) |
| 7+ Person Households | 6 (0.2%) | 0 (0.0%) |
| Total | 1,568 (56.1%) | 1,225 (43.9%) |
Female Fertility in Gardnerville
Fertility by Age in Gardnerville
Average fertility rate in Gardnerville is 50.0 births per 1,000 women. Women in the age bracket of 20 to 34 years have the highest fertility rate with 111.0 births per 1,000 women. Women in the age bracket of 20 to 34 years acount for 100.0% of all women with births.
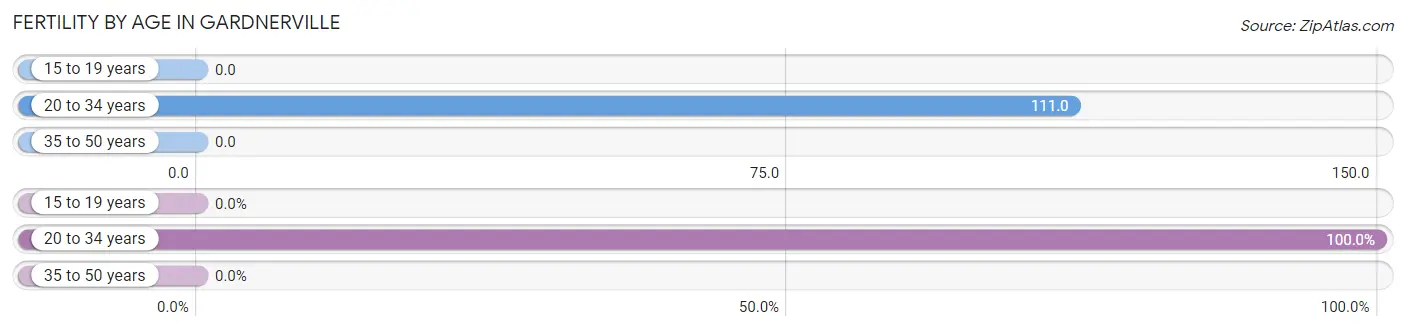
| Age Bracket | Women with Births | Births / 1,000 Women |
| 15 to 19 years | 0 (0.0%) | 0.0 |
| 20 to 34 years | 50 (100.0%) | 111.0 |
| 35 to 50 years | 0 (0.0%) | 0.0 |
| Total | 50 (100.0%) | 50.0 |
Fertility by Age by Marriage Status in Gardnerville
48.0% of women with births (50) in Gardnerville are married. The highest percentage of unmarried women with births falls into 20 to 34 years age bracket with 52.0% of them unmarried at the time of birth, while the lowest percentage of unmarried women with births belong to 20 to 34 years age bracket with 52.0% of them unmarried.
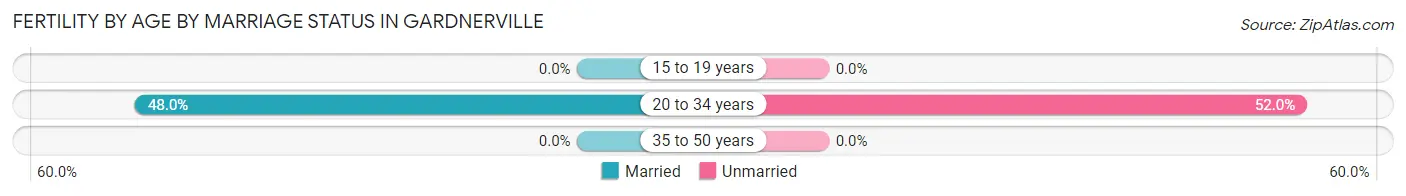
| Age Bracket | Married | Unmarried |
| 15 to 19 years | 0 (0.0%) | 0 (0.0%) |
| 20 to 34 years | 24 (48.0%) | 26 (52.0%) |
| 35 to 50 years | 0 (0.0%) | 0 (0.0%) |
| Total | 24 (48.0%) | 26 (52.0%) |
Fertility by Education in Gardnerville
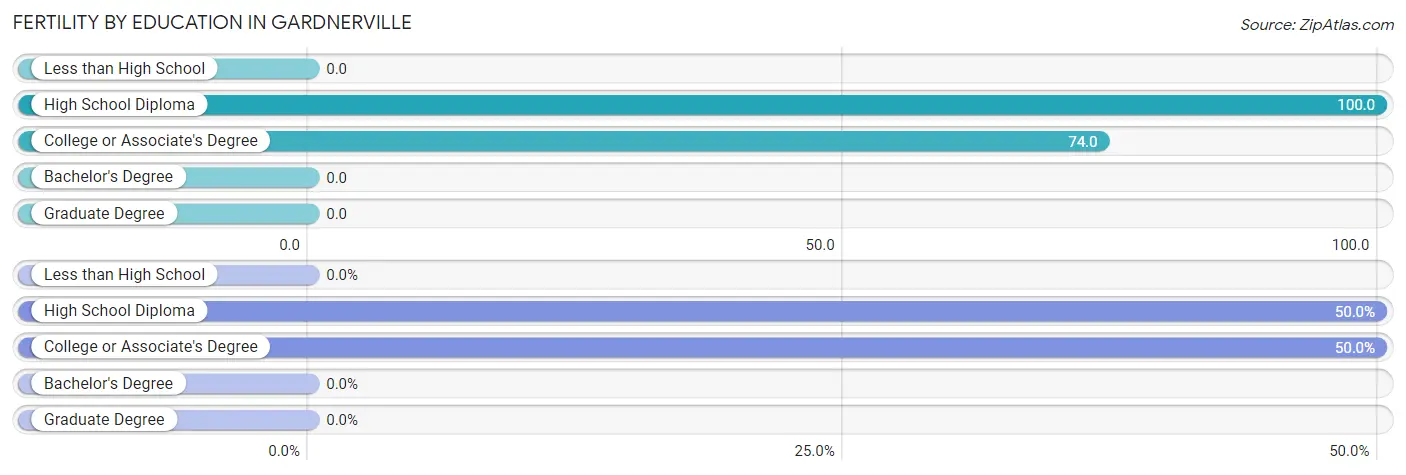
| Educational Attainment | Women with Births | Births / 1,000 Women |
| Less than High School | 0 (0.0%) | 0.0 |
| High School Diploma | 25 (50.0%) | 100.0 |
| College or Associate's Degree | 25 (50.0%) | 74.0 |
| Bachelor's Degree | 0 (0.0%) | 0.0 |
| Graduate Degree | 0 (0.0%) | 0.0 |
| Total | 50 (100.0%) | 50.0 |
Fertility by Education by Marriage Status in Gardnerville
52.0% of women with births in Gardnerville are unmarried. Women with the educational attainment of high school diploma are most likely to be married with 68.0% of them married at childbirth, while women with the educational attainment of college or associate's degree are least likely to be married with 72.0% of them unmarried at childbirth.
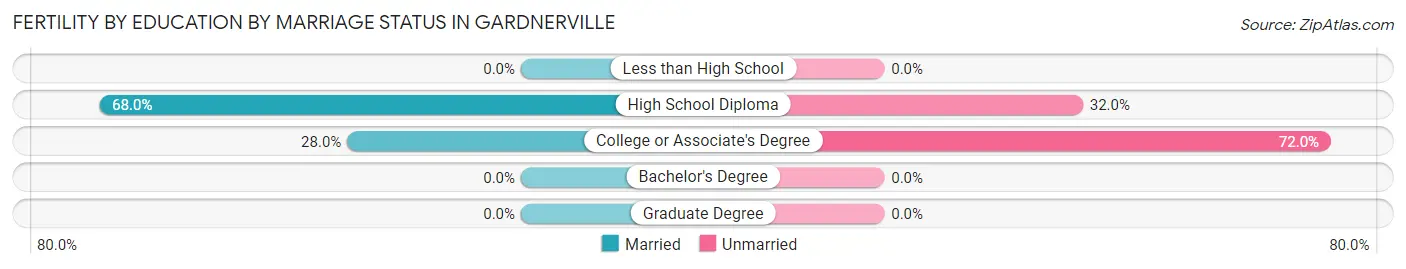
| Educational Attainment | Married | Unmarried |
| Less than High School | 0 (0.0%) | 0 (0.0%) |
| High School Diploma | 17 (68.0%) | 8 (32.0%) |
| College or Associate's Degree | 7 (28.0%) | 18 (72.0%) |
| Bachelor's Degree | 0 (0.0%) | 0 (0.0%) |
| Graduate Degree | 0 (0.0%) | 0 (0.0%) |
| Total | 24 (48.0%) | 26 (52.0%) |
Employment Characteristics in Gardnerville
Employment by Class of Employer in Gardnerville
Among the 2,864 employed individuals in Gardnerville, private company employees (1,947 | 68.0%), self-employed (not incorporated) (247 | 8.6%), and local government employees (208 | 7.3%) make up the most common classes of employment.
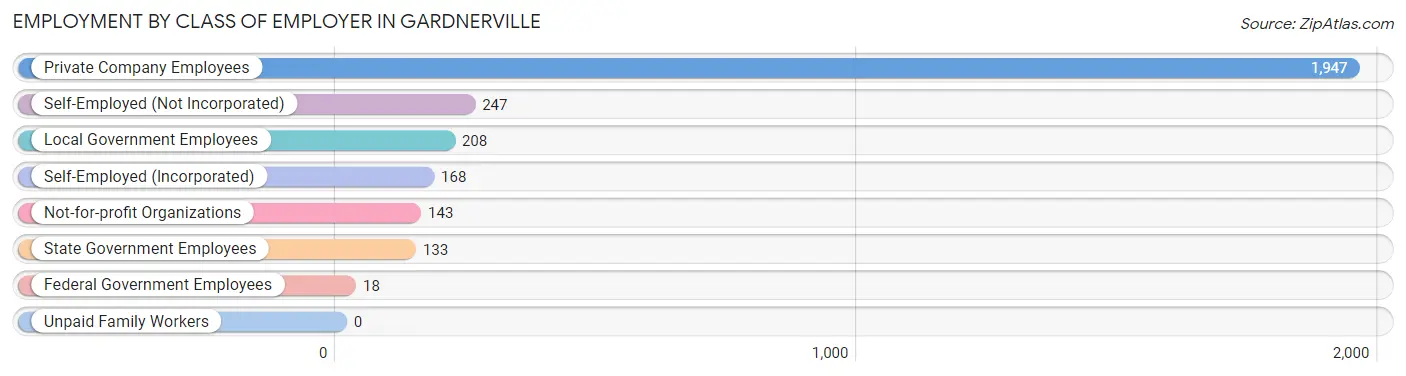
| Employer Class | # Employees | % Employees |
| Private Company Employees | 1,947 | 68.0% |
| Self-Employed (Incorporated) | 168 | 5.9% |
| Self-Employed (Not Incorporated) | 247 | 8.6% |
| Not-for-profit Organizations | 143 | 5.0% |
| Local Government Employees | 208 | 7.3% |
| State Government Employees | 133 | 4.6% |
| Federal Government Employees | 18 | 0.6% |
| Unpaid Family Workers | 0 | 0.0% |
| Total | 2,864 | 100.0% |
Employment Status by Age in Gardnerville
According to the labor force statistics for Gardnerville, out of the total population over 16 years of age (5,471), 55.9% or 3,058 individuals are in the labor force, with 4.5% or 138 of them unemployed. The age group with the highest labor force participation rate is 25 to 29 years, with 99.3% or 590 individuals in the labor force. Within the labor force, the 45 to 54 years age range has the highest percentage of unemployed individuals, with 19.1% or 98 of them being unemployed.
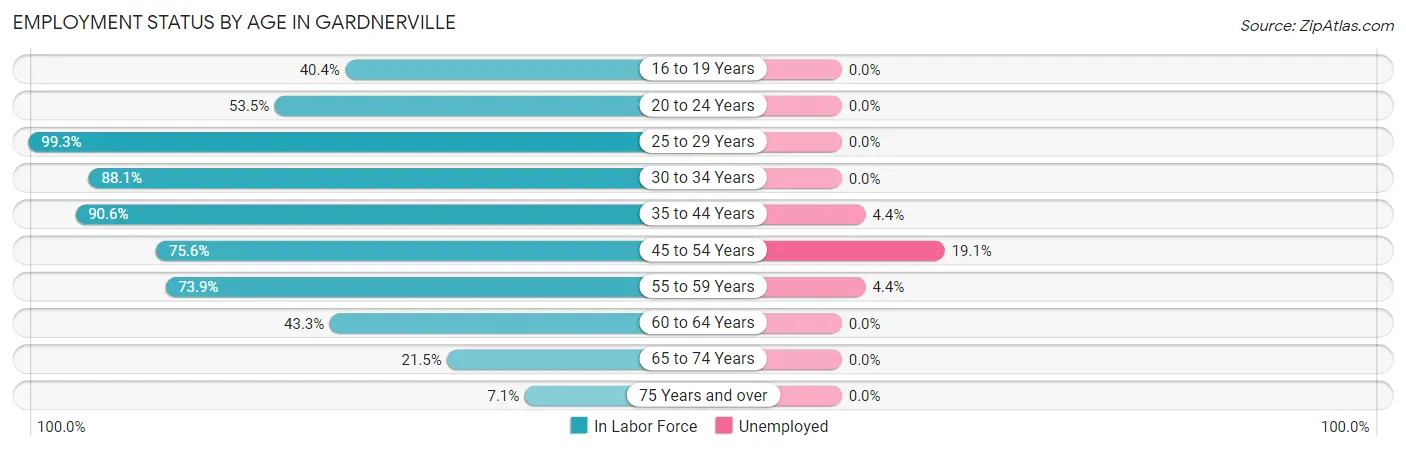
| Age Bracket | In Labor Force | Unemployed |
| 16 to 19 Years | 143 (40.4%) | 0 (0.0%) |
| 20 to 24 Years | 84 (53.5%) | 0 (0.0%) |
| 25 to 29 Years | 590 (99.3%) | 0 (0.0%) |
| 30 to 34 Years | 325 (88.1%) | 0 (0.0%) |
| 35 to 44 Years | 620 (90.6%) | 27 (4.4%) |
| 45 to 54 Years | 513 (75.6%) | 98 (19.1%) |
| 55 to 59 Years | 294 (73.9%) | 13 (4.4%) |
| 60 to 64 Years | 242 (43.3%) | 0 (0.0%) |
| 65 to 74 Years | 190 (21.5%) | 0 (0.0%) |
| 75 Years and over | 56 (7.1%) | 0 (0.0%) |
| Total | 3,058 (55.9%) | 138 (4.5%) |
Employment Status by Educational Attainment in Gardnerville
According to labor force statistics for Gardnerville, 78.7% of individuals (2,584) out of the total population between 25 and 64 years of age (3,283) are in the labor force, with 5.3% or 137 of them being unemployed. The group with the highest labor force participation rate are those with the educational attainment of less than high school, with 89.9% or 435 individuals in the labor force. Within the labor force, individuals with college / associate degree education have the highest percentage of unemployment, with 10.4% or 76 of them being unemployed.
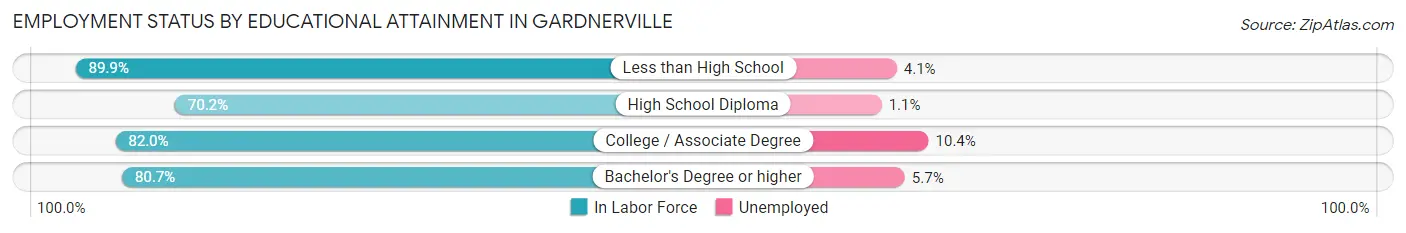
| Educational Attainment | In Labor Force | Unemployed |
| Less than High School | 435 (89.9%) | 20 (4.1%) |
| High School Diploma | 807 (70.2%) | 13 (1.1%) |
| College / Associate Degree | 733 (82.0%) | 93 (10.4%) |
| Bachelor's Degree or higher | 609 (80.7%) | 43 (5.7%) |
| Total | 2,584 (78.7%) | 174 (5.3%) |
Employment Occupations by Sex in Gardnerville
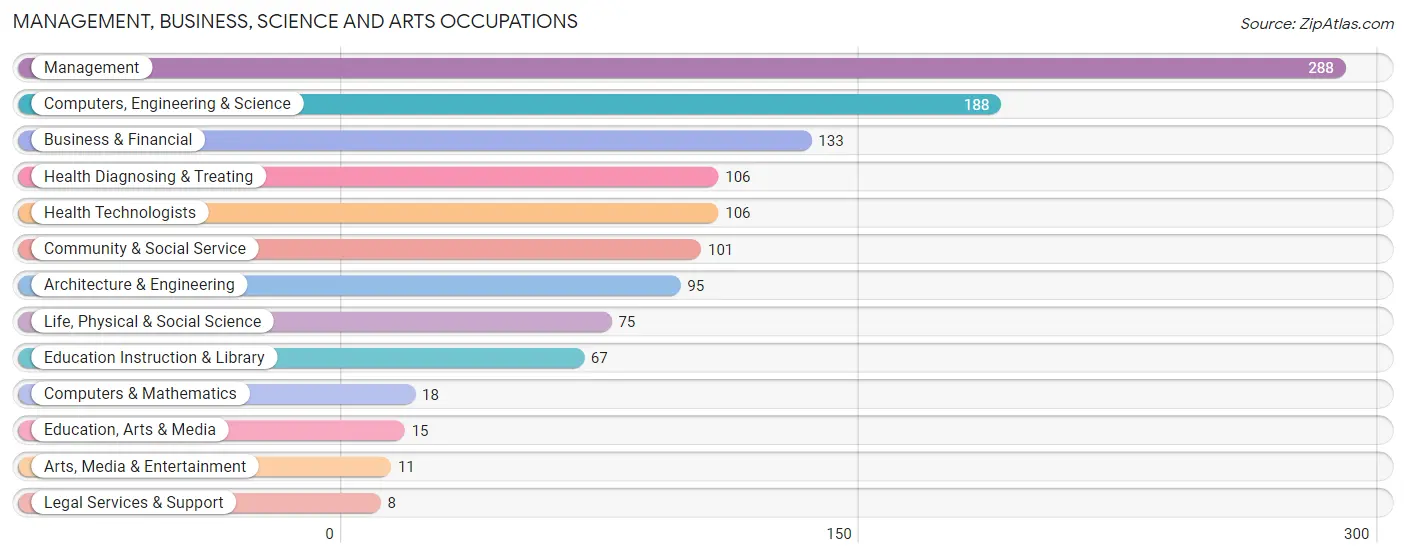
Management, Business, Science and Arts Occupations
The most common Management, Business, Science and Arts occupations in Gardnerville are Management (288 | 9.9%), Computers, Engineering & Science (188 | 6.4%), Business & Financial (133 | 4.6%), Health Diagnosing & Treating (106 | 3.6%), and Health Technologists (106 | 3.6%).
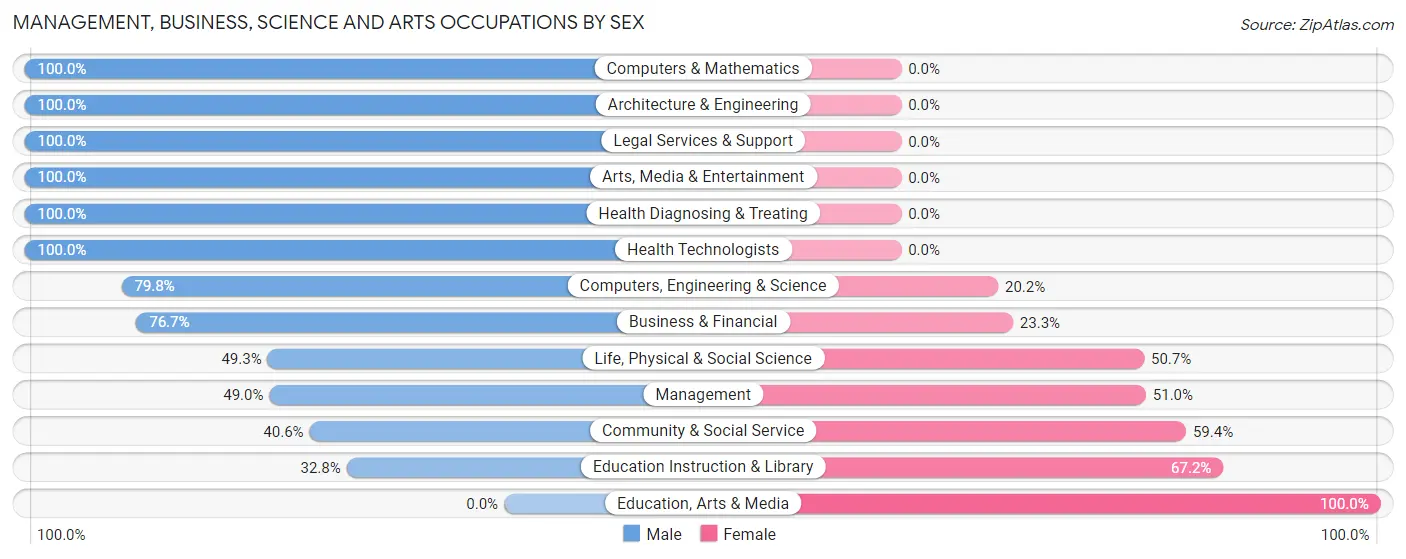
Management, Business, Science and Arts Occupations by Sex
Within the Management, Business, Science and Arts occupations in Gardnerville, the most male-oriented occupations are Computers & Mathematics (100.0%), Architecture & Engineering (100.0%), and Legal Services & Support (100.0%), while the most female-oriented occupations are Education, Arts & Media (100.0%), Education Instruction & Library (67.2%), and Community & Social Service (59.4%).
| Occupation | Male | Female |
| Management | 141 (49.0%) | 147 (51.0%) |
| Business & Financial | 102 (76.7%) | 31 (23.3%) |
| Computers, Engineering & Science | 150 (79.8%) | 38 (20.2%) |
| Computers & Mathematics | 18 (100.0%) | 0 (0.0%) |
| Architecture & Engineering | 95 (100.0%) | 0 (0.0%) |
| Life, Physical & Social Science | 37 (49.3%) | 38 (50.7%) |
| Community & Social Service | 41 (40.6%) | 60 (59.4%) |
| Education, Arts & Media | 0 (0.0%) | 15 (100.0%) |
| Legal Services & Support | 8 (100.0%) | 0 (0.0%) |
| Education Instruction & Library | 22 (32.8%) | 45 (67.2%) |
| Arts, Media & Entertainment | 11 (100.0%) | 0 (0.0%) |
| Health Diagnosing & Treating | 106 (100.0%) | 0 (0.0%) |
| Health Technologists | 106 (100.0%) | 0 (0.0%) |
| Total (Category) | 540 (66.2%) | 276 (33.8%) |
| Total (Overall) | 1,666 (57.1%) | 1,253 (42.9%) |
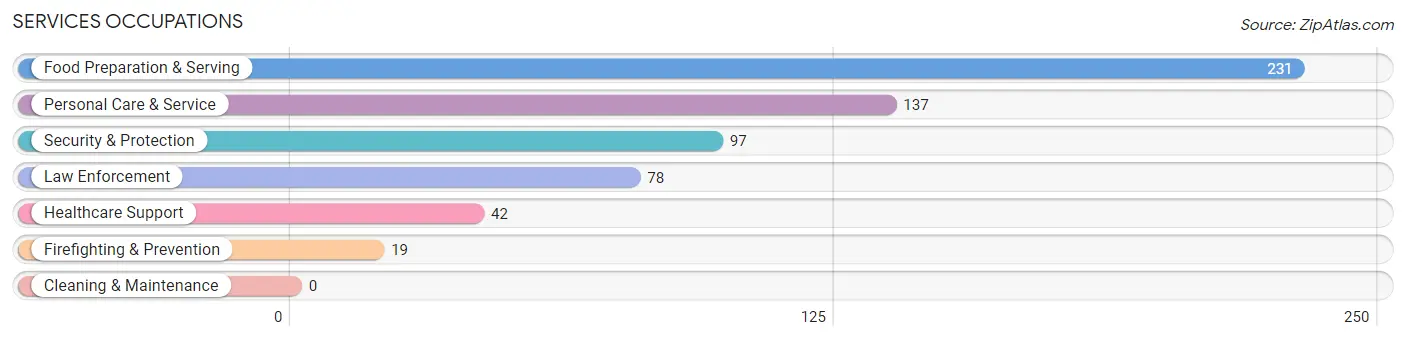
Services Occupations
The most common Services occupations in Gardnerville are Food Preparation & Serving (231 | 7.9%), Personal Care & Service (137 | 4.7%), Security & Protection (97 | 3.3%), Law Enforcement (78 | 2.7%), and Healthcare Support (42 | 1.4%).
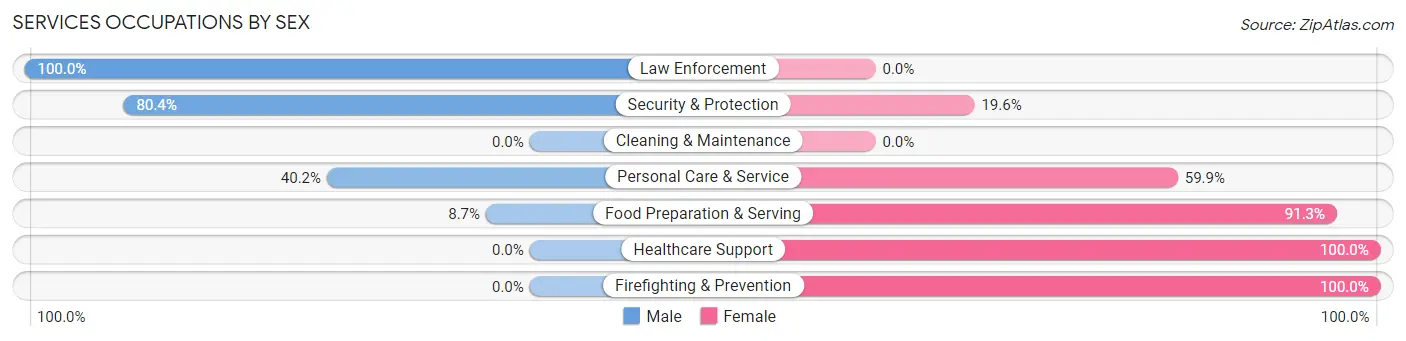
Services Occupations by Sex
Within the Services occupations in Gardnerville, the most male-oriented occupations are Law Enforcement (100.0%), Security & Protection (80.4%), and Personal Care & Service (40.2%), while the most female-oriented occupations are Healthcare Support (100.0%), Firefighting & Prevention (100.0%), and Food Preparation & Serving (91.3%).
| Occupation | Male | Female |
| Healthcare Support | 0 (0.0%) | 42 (100.0%) |
| Security & Protection | 78 (80.4%) | 19 (19.6%) |
| Firefighting & Prevention | 0 (0.0%) | 19 (100.0%) |
| Law Enforcement | 78 (100.0%) | 0 (0.0%) |
| Food Preparation & Serving | 20 (8.7%) | 211 (91.3%) |
| Cleaning & Maintenance | 0 (0.0%) | 0 (0.0%) |
| Personal Care & Service | 55 (40.2%) | 82 (59.9%) |
| Total (Category) | 153 (30.2%) | 354 (69.8%) |
| Total (Overall) | 1,666 (57.1%) | 1,253 (42.9%) |
Sales and Office Occupations
The most common Sales and Office occupations in Gardnerville are Sales & Related (398 | 13.6%), and Office & Administration (368 | 12.6%).
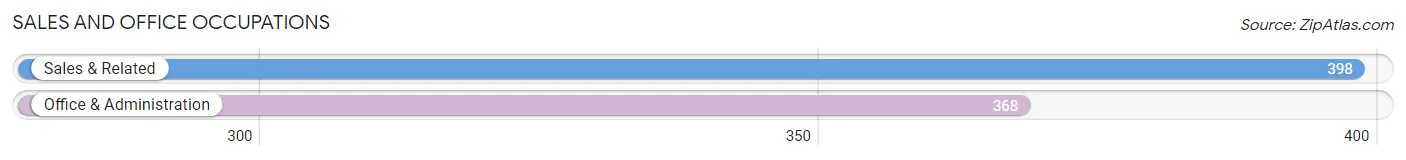
Sales and Office Occupations by Sex
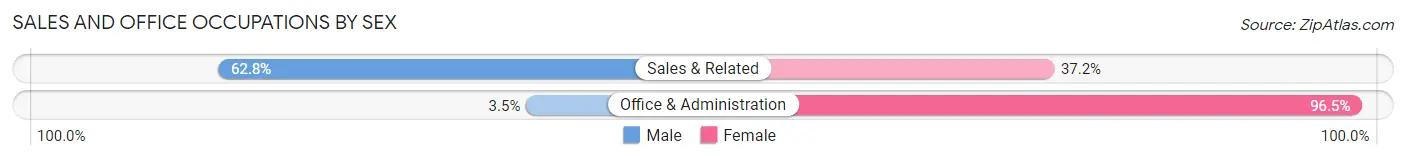
| Occupation | Male | Female |
| Sales & Related | 250 (62.8%) | 148 (37.2%) |
| Office & Administration | 13 (3.5%) | 355 (96.5%) |
| Total (Category) | 263 (34.3%) | 503 (65.7%) |
| Total (Overall) | 1,666 (57.1%) | 1,253 (42.9%) |
Natural Resources, Construction and Maintenance Occupations
The most common Natural Resources, Construction and Maintenance occupations in Gardnerville are Construction & Extraction (235 | 8.1%), and Installation, Maintenance & Repair (58 | 2.0%).
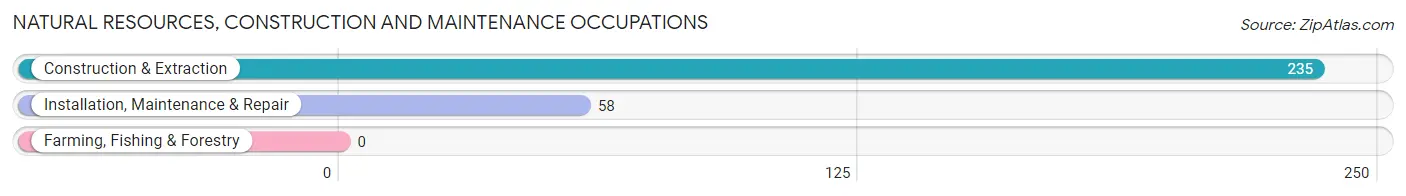
Natural Resources, Construction and Maintenance Occupations by Sex
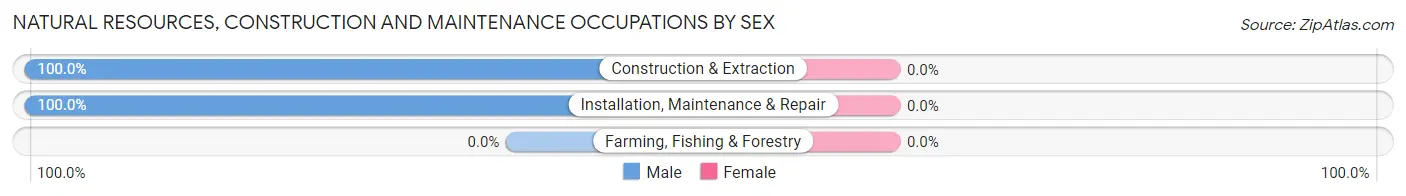
| Occupation | Male | Female |
| Farming, Fishing & Forestry | 0 (0.0%) | 0 (0.0%) |
| Construction & Extraction | 235 (100.0%) | 0 (0.0%) |
| Installation, Maintenance & Repair | 58 (100.0%) | 0 (0.0%) |
| Total (Category) | 293 (100.0%) | 0 (0.0%) |
| Total (Overall) | 1,666 (57.1%) | 1,253 (42.9%) |
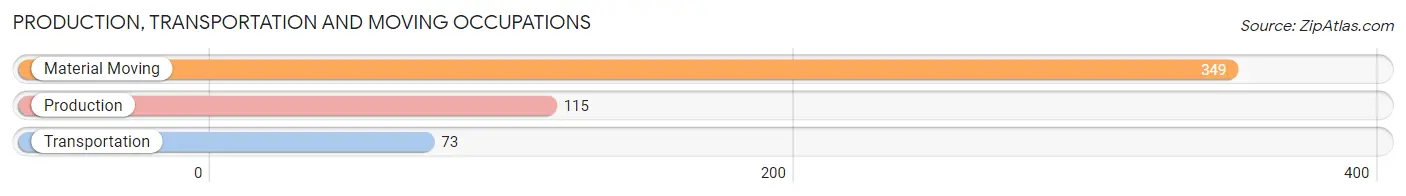
Production, Transportation and Moving Occupations
The most common Production, Transportation and Moving occupations in Gardnerville are Material Moving (349 | 12.0%), Production (115 | 3.9%), and Transportation (73 | 2.5%).
Production, Transportation and Moving Occupations by Sex
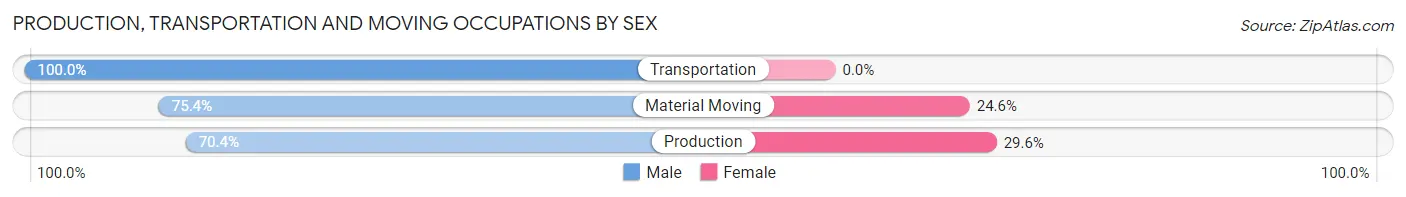
| Occupation | Male | Female |
| Production | 81 (70.4%) | 34 (29.6%) |
| Transportation | 73 (100.0%) | 0 (0.0%) |
| Material Moving | 263 (75.4%) | 86 (24.6%) |
| Total (Category) | 417 (77.6%) | 120 (22.4%) |
| Total (Overall) | 1,666 (57.1%) | 1,253 (42.9%) |
Employment Industries by Sex in Gardnerville
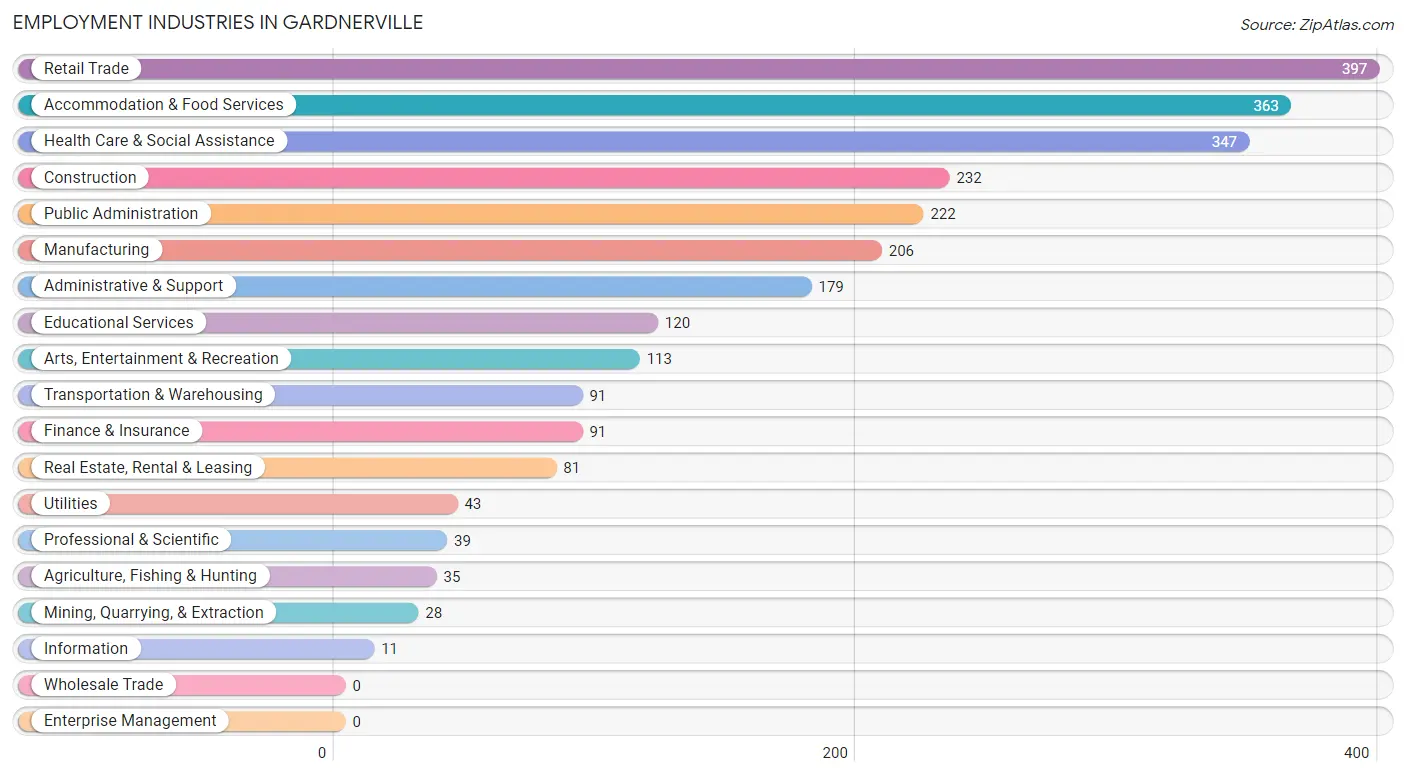
Employment Industries in Gardnerville
The major employment industries in Gardnerville include Retail Trade (397 | 13.6%), Accommodation & Food Services (363 | 12.4%), Health Care & Social Assistance (347 | 11.9%), Construction (232 | 8.0%), and Public Administration (222 | 7.6%).
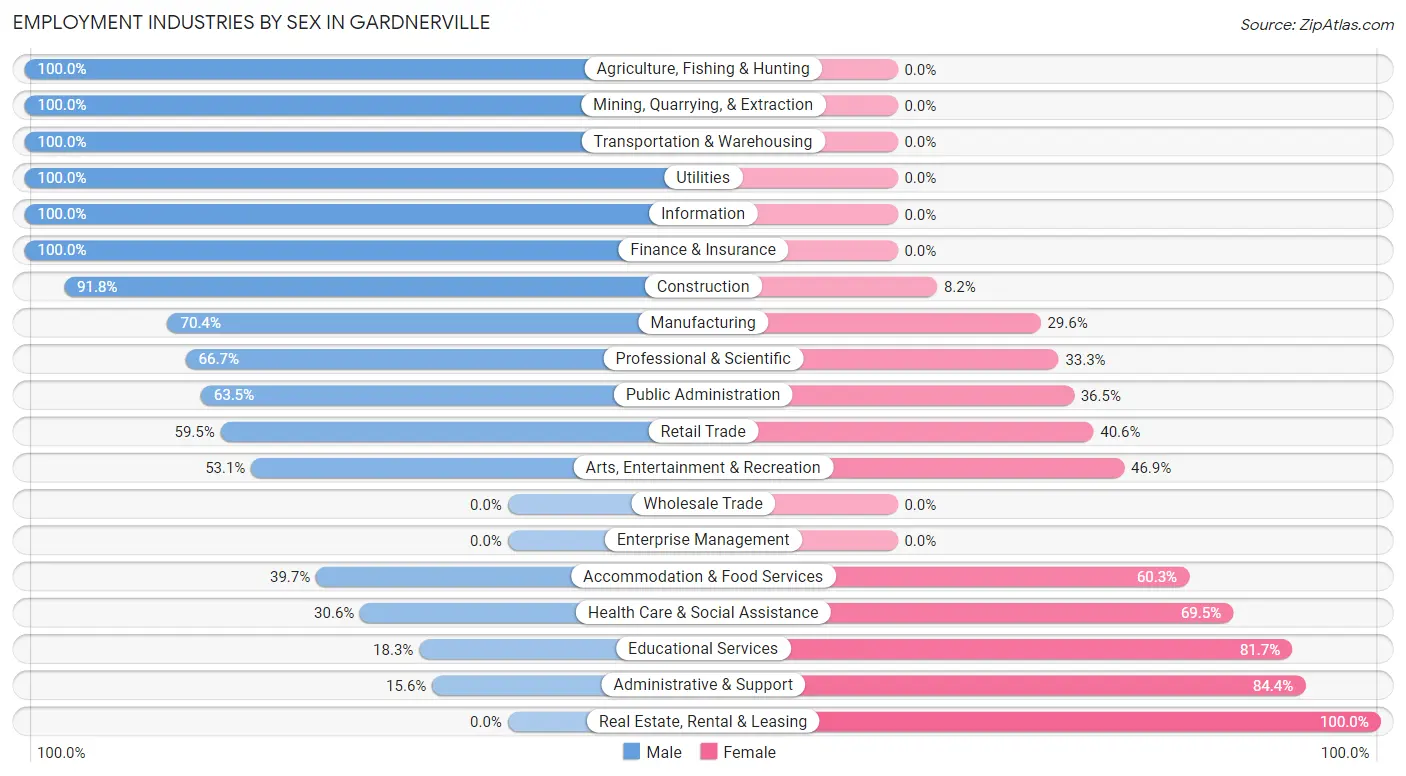
Employment Industries by Sex in Gardnerville
The Gardnerville industries that see more men than women are Agriculture, Fishing & Hunting (100.0%), Mining, Quarrying, & Extraction (100.0%), and Transportation & Warehousing (100.0%), whereas the industries that tend to have a higher number of women are Real Estate, Rental & Leasing (100.0%), Administrative & Support (84.4%), and Educational Services (81.7%).
| Industry | Male | Female |
| Agriculture, Fishing & Hunting | 35 (100.0%) | 0 (0.0%) |
| Mining, Quarrying, & Extraction | 28 (100.0%) | 0 (0.0%) |
| Construction | 213 (91.8%) | 19 (8.2%) |
| Manufacturing | 145 (70.4%) | 61 (29.6%) |
| Wholesale Trade | 0 (0.0%) | 0 (0.0%) |
| Retail Trade | 236 (59.5%) | 161 (40.6%) |
| Transportation & Warehousing | 91 (100.0%) | 0 (0.0%) |
| Utilities | 43 (100.0%) | 0 (0.0%) |
| Information | 11 (100.0%) | 0 (0.0%) |
| Finance & Insurance | 91 (100.0%) | 0 (0.0%) |
| Real Estate, Rental & Leasing | 0 (0.0%) | 81 (100.0%) |
| Professional & Scientific | 26 (66.7%) | 13 (33.3%) |
| Enterprise Management | 0 (0.0%) | 0 (0.0%) |
| Administrative & Support | 28 (15.6%) | 151 (84.4%) |
| Educational Services | 22 (18.3%) | 98 (81.7%) |
| Health Care & Social Assistance | 106 (30.5%) | 241 (69.5%) |
| Arts, Entertainment & Recreation | 60 (53.1%) | 53 (46.9%) |
| Accommodation & Food Services | 144 (39.7%) | 219 (60.3%) |
| Public Administration | 141 (63.5%) | 81 (36.5%) |
| Total | 1,666 (57.1%) | 1,253 (42.9%) |
Education in Gardnerville
School Enrollment in Gardnerville
The most common levels of schooling among the 871 students in Gardnerville are high school (350 | 40.2%), elementary school (221 | 25.4%), and kindergarten (127 | 14.6%).
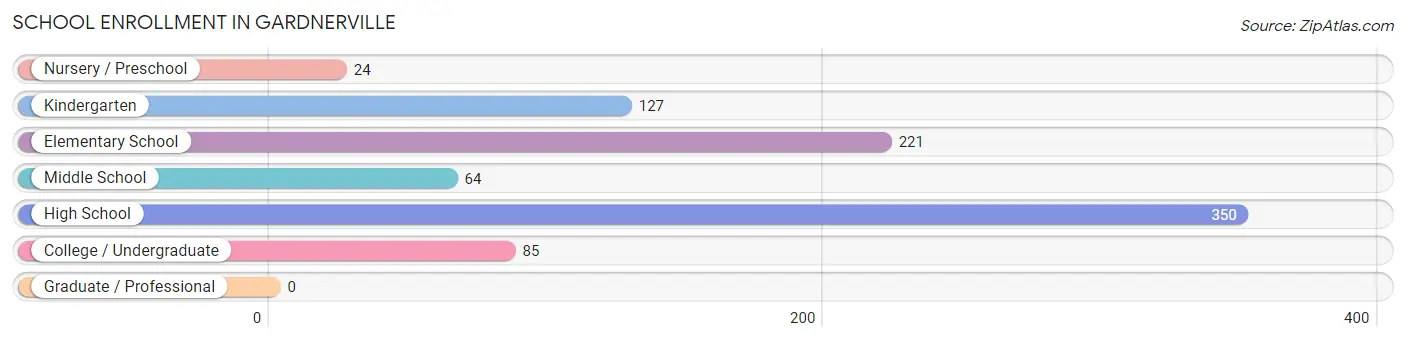
| School Level | # Students | % Students |
| Nursery / Preschool | 24 | 2.8% |
| Kindergarten | 127 | 14.6% |
| Elementary School | 221 | 25.4% |
| Middle School | 64 | 7.3% |
| High School | 350 | 40.2% |
| College / Undergraduate | 85 | 9.8% |
| Graduate / Professional | 0 | 0.0% |
| Total | 871 | 100.0% |
School Enrollment by Age by Funding Source in Gardnerville
Out of a total of 871 students who are enrolled in schools in Gardnerville, 25 (2.9%) attend a private institution, while the remaining 846 (97.1%) are enrolled in public schools. The age group of 3 to 4 year olds has the highest likelihood of being enrolled in private schools, with 12 (100.0% in the age bracket) enrolled. Conversely, the age group of 10 to 14 year olds has the lowest likelihood of being enrolled in a private school, with 98 (100.0% in the age bracket) attending a public institution.
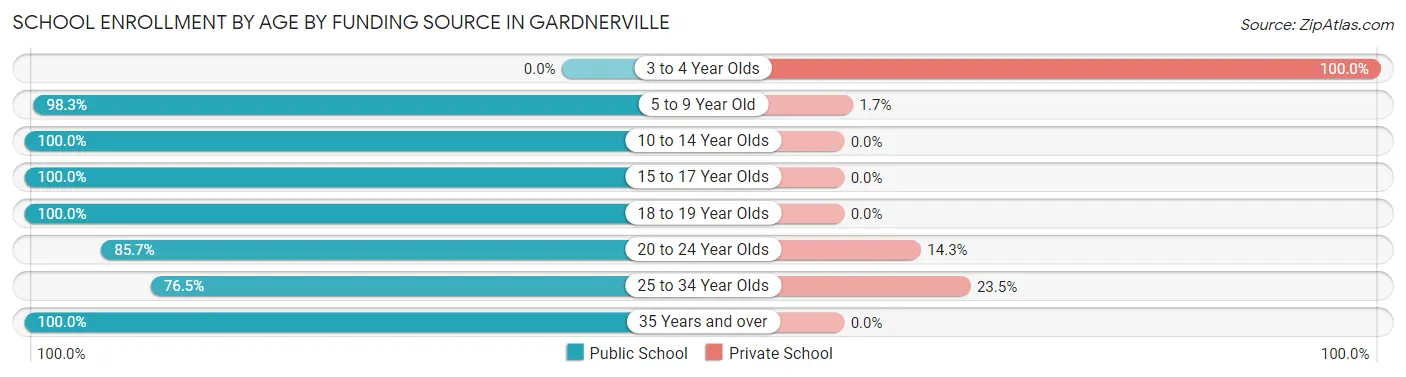
| Age Bracket | Public School | Private School |
| 3 to 4 Year Olds | 0 (0.0%) | 12 (100.0%) |
| 5 to 9 Year Old | 354 (98.3%) | 6 (1.7%) |
| 10 to 14 Year Olds | 98 (100.0%) | 0 (0.0%) |
| 15 to 17 Year Olds | 172 (100.0%) | 0 (0.0%) |
| 18 to 19 Year Olds | 157 (100.0%) | 0 (0.0%) |
| 20 to 24 Year Olds | 18 (85.7%) | 3 (14.3%) |
| 25 to 34 Year Olds | 13 (76.5%) | 4 (23.5%) |
| 35 Years and over | 34 (100.0%) | 0 (0.0%) |
| Total | 846 (97.1%) | 25 (2.9%) |
Educational Attainment by Field of Study in Gardnerville
Arts & humanities (354 | 24.1%), business (229 | 15.6%), bio, nature & agricultural (193 | 13.1%), education (167 | 11.4%), and social sciences (153 | 10.4%) are the most common fields of study among 1,470 individuals in Gardnerville who have obtained a bachelor's degree or higher.
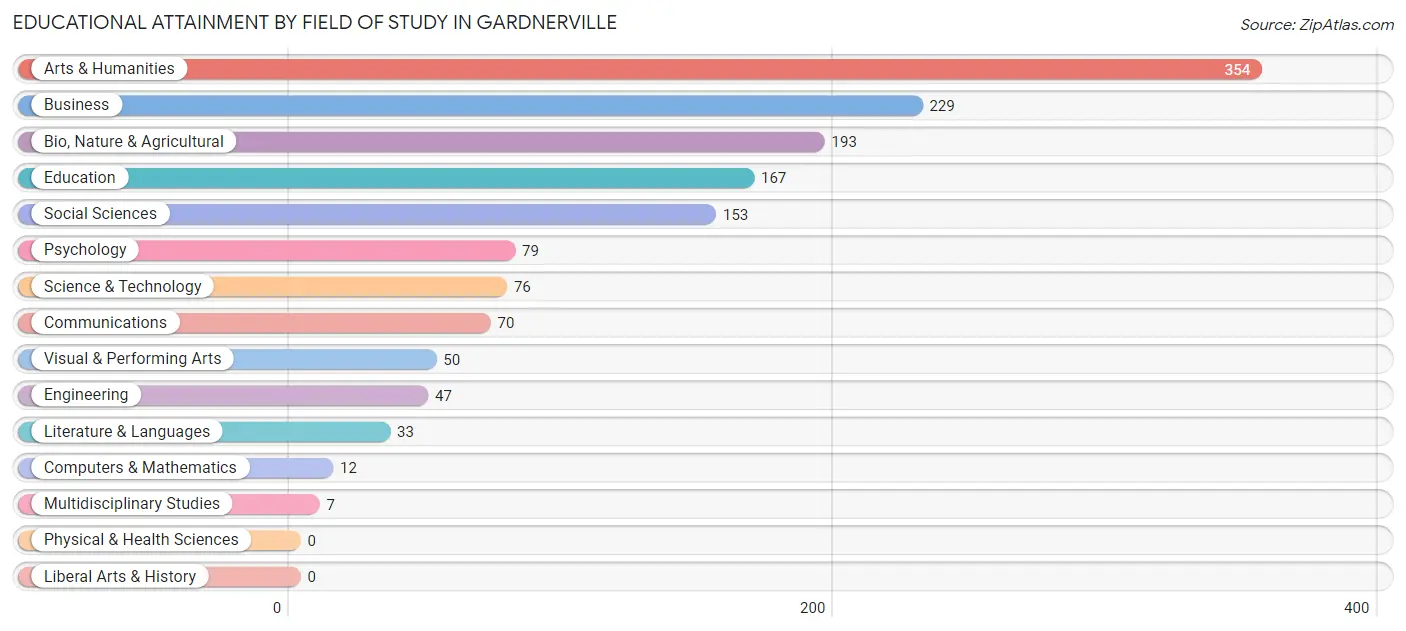
| Field of Study | # Graduates | % Graduates |
| Computers & Mathematics | 12 | 0.8% |
| Bio, Nature & Agricultural | 193 | 13.1% |
| Physical & Health Sciences | 0 | 0.0% |
| Psychology | 79 | 5.4% |
| Social Sciences | 153 | 10.4% |
| Engineering | 47 | 3.2% |
| Multidisciplinary Studies | 7 | 0.5% |
| Science & Technology | 76 | 5.2% |
| Business | 229 | 15.6% |
| Education | 167 | 11.4% |
| Literature & Languages | 33 | 2.2% |
| Liberal Arts & History | 0 | 0.0% |
| Visual & Performing Arts | 50 | 3.4% |
| Communications | 70 | 4.8% |
| Arts & Humanities | 354 | 24.1% |
| Total | 1,470 | 100.0% |
Transportation & Commute in Gardnerville
Vehicle Availability by Sex in Gardnerville
The most prevalent vehicle ownership categories in Gardnerville are males with 2 vehicles (601, accounting for 37.3%) and females with 2 vehicles (537, making up 48.0%).
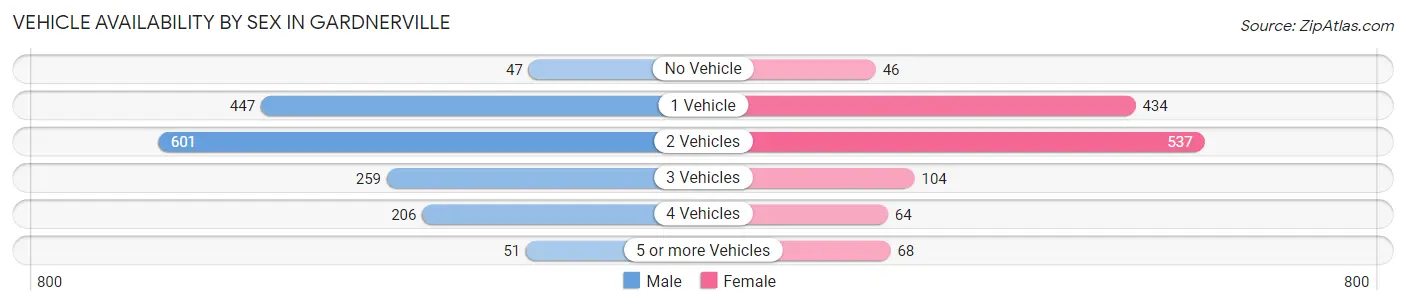
| Vehicles Available | Male | Female |
| No Vehicle | 47 (2.9%) | 46 (3.7%) |
| 1 Vehicle | 447 (27.8%) | 434 (34.6%) |
| 2 Vehicles | 601 (37.3%) | 537 (42.9%) |
| 3 Vehicles | 259 (16.1%) | 104 (8.3%) |
| 4 Vehicles | 206 (12.8%) | 64 (5.1%) |
| 5 or more Vehicles | 51 (3.2%) | 68 (5.4%) |
| Total | 1,611 (100.0%) | 1,253 (100.0%) |
Commute Time in Gardnerville
The most frequently occuring commute durations in Gardnerville are 10 to 14 minutes (639 commuters, 23.9%), 5 to 9 minutes (501 commuters, 18.7%), and 30 to 34 minutes (341 commuters, 12.8%).
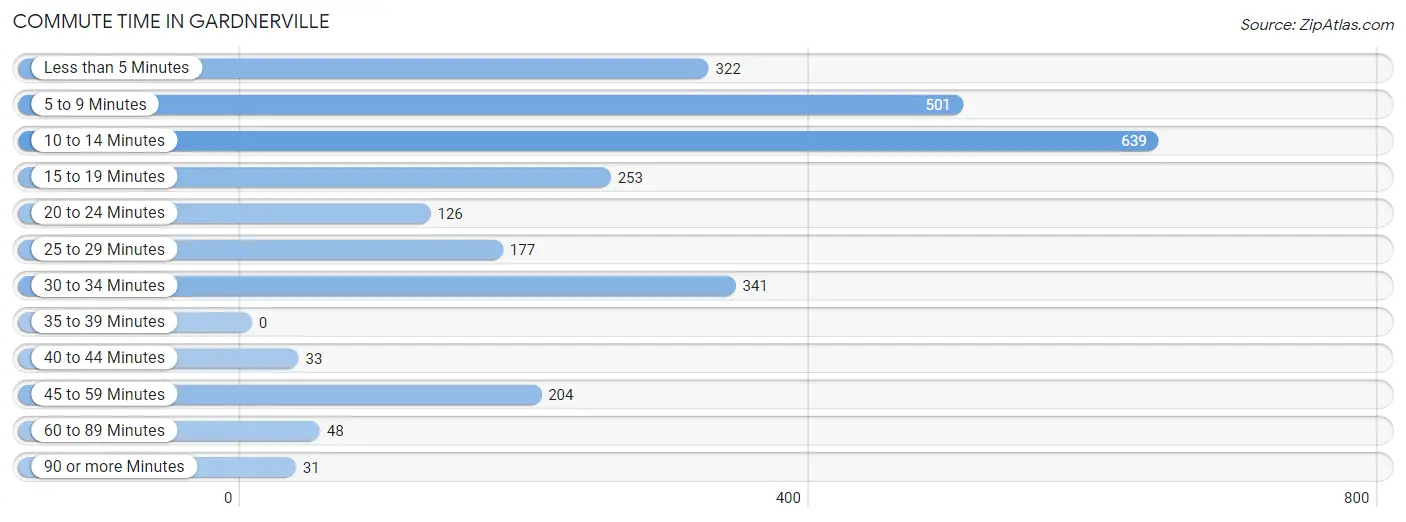
| Commute Time | # Commuters | % Commuters |
| Less than 5 Minutes | 322 | 12.0% |
| 5 to 9 Minutes | 501 | 18.7% |
| 10 to 14 Minutes | 639 | 23.9% |
| 15 to 19 Minutes | 253 | 9.5% |
| 20 to 24 Minutes | 126 | 4.7% |
| 25 to 29 Minutes | 177 | 6.6% |
| 30 to 34 Minutes | 341 | 12.8% |
| 35 to 39 Minutes | 0 | 0.0% |
| 40 to 44 Minutes | 33 | 1.2% |
| 45 to 59 Minutes | 204 | 7.6% |
| 60 to 89 Minutes | 48 | 1.8% |
| 90 or more Minutes | 31 | 1.2% |
Commute Time by Sex in Gardnerville
The most common commute times in Gardnerville are 10 to 14 minutes (399 commuters, 25.6%) for males and less than 5 minutes (245 commuters, 21.9%) for females.
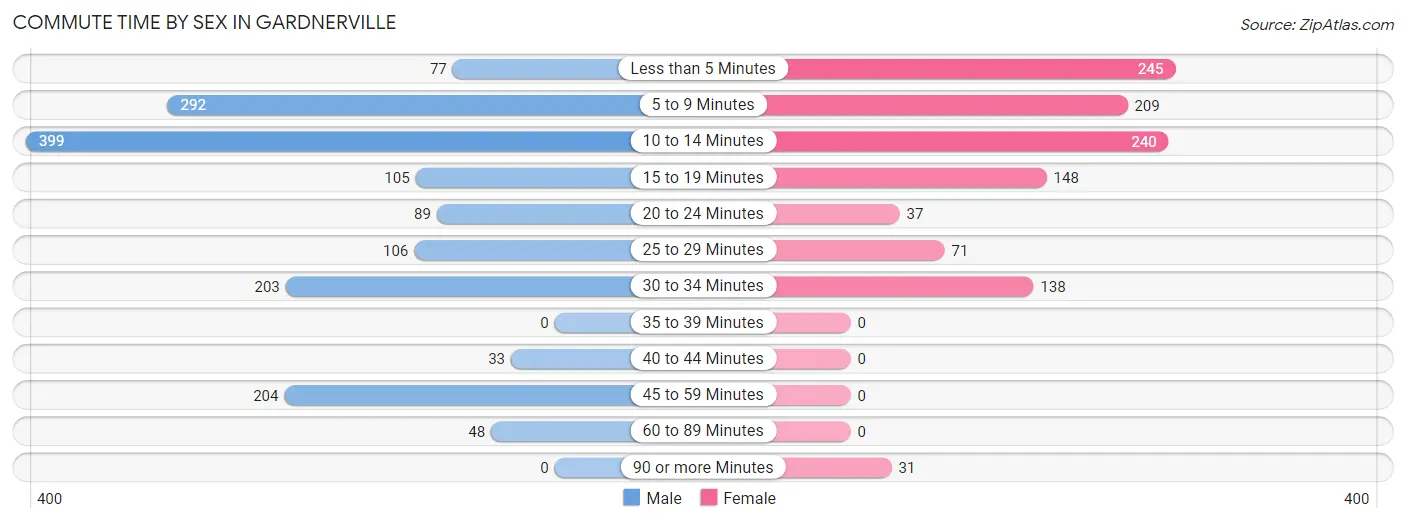
| Commute Time | Male | Female |
| Less than 5 Minutes | 77 (5.0%) | 245 (21.9%) |
| 5 to 9 Minutes | 292 (18.8%) | 209 (18.7%) |
| 10 to 14 Minutes | 399 (25.6%) | 240 (21.4%) |
| 15 to 19 Minutes | 105 (6.8%) | 148 (13.2%) |
| 20 to 24 Minutes | 89 (5.7%) | 37 (3.3%) |
| 25 to 29 Minutes | 106 (6.8%) | 71 (6.3%) |
| 30 to 34 Minutes | 203 (13.1%) | 138 (12.3%) |
| 35 to 39 Minutes | 0 (0.0%) | 0 (0.0%) |
| 40 to 44 Minutes | 33 (2.1%) | 0 (0.0%) |
| 45 to 59 Minutes | 204 (13.1%) | 0 (0.0%) |
| 60 to 89 Minutes | 48 (3.1%) | 0 (0.0%) |
| 90 or more Minutes | 0 (0.0%) | 31 (2.8%) |
Time of Departure to Work by Sex in Gardnerville
The most frequent times of departure to work in Gardnerville are 9:00 AM to 9:59 AM (248, 15.9%) for males and 9:00 AM to 9:59 AM (271, 24.2%) for females.
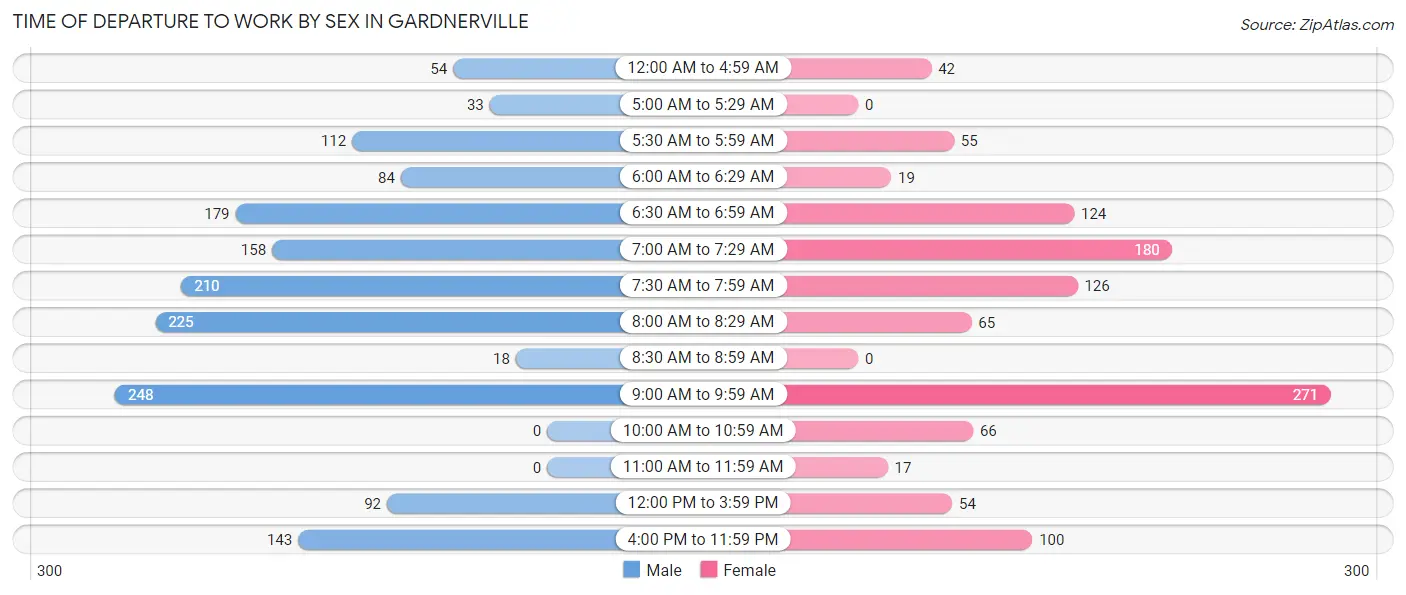
| Time of Departure | Male | Female |
| 12:00 AM to 4:59 AM | 54 (3.5%) | 42 (3.7%) |
| 5:00 AM to 5:29 AM | 33 (2.1%) | 0 (0.0%) |
| 5:30 AM to 5:59 AM | 112 (7.2%) | 55 (4.9%) |
| 6:00 AM to 6:29 AM | 84 (5.4%) | 19 (1.7%) |
| 6:30 AM to 6:59 AM | 179 (11.5%) | 124 (11.1%) |
| 7:00 AM to 7:29 AM | 158 (10.2%) | 180 (16.1%) |
| 7:30 AM to 7:59 AM | 210 (13.5%) | 126 (11.3%) |
| 8:00 AM to 8:29 AM | 225 (14.5%) | 65 (5.8%) |
| 8:30 AM to 8:59 AM | 18 (1.2%) | 0 (0.0%) |
| 9:00 AM to 9:59 AM | 248 (15.9%) | 271 (24.2%) |
| 10:00 AM to 10:59 AM | 0 (0.0%) | 66 (5.9%) |
| 11:00 AM to 11:59 AM | 0 (0.0%) | 17 (1.5%) |
| 12:00 PM to 3:59 PM | 92 (5.9%) | 54 (4.8%) |
| 4:00 PM to 11:59 PM | 143 (9.2%) | 100 (8.9%) |
| Total | 1,556 (100.0%) | 1,119 (100.0%) |
Housing Occupancy in Gardnerville
Occupancy by Ownership in Gardnerville
Of the total 2,793 dwellings in Gardnerville, owner-occupied units account for 1,474 (52.8%), while renter-occupied units make up 1,319 (47.2%).
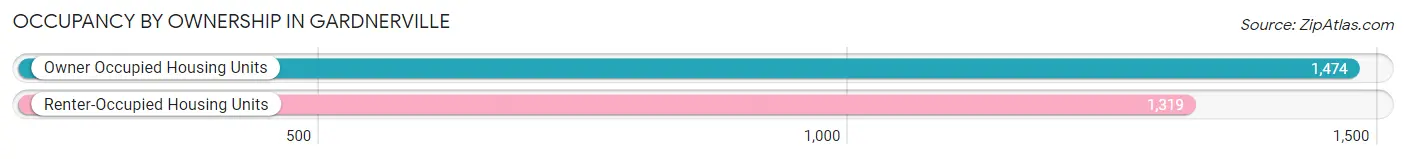
| Occupancy | # Housing Units | % Housing Units |
| Owner Occupied Housing Units | 1,474 | 52.8% |
| Renter-Occupied Housing Units | 1,319 | 47.2% |
| Total Occupied Housing Units | 2,793 | 100.0% |
Occupancy by Household Size in Gardnerville
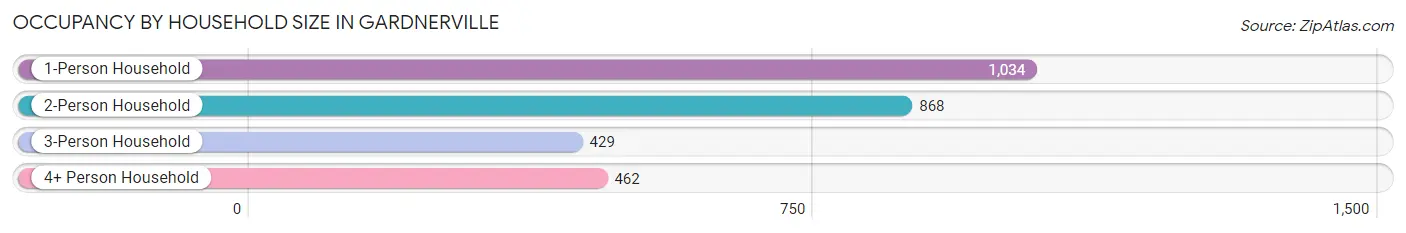
| Household Size | # Housing Units | % Housing Units |
| 1-Person Household | 1,034 | 37.0% |
| 2-Person Household | 868 | 31.1% |
| 3-Person Household | 429 | 15.4% |
| 4+ Person Household | 462 | 16.5% |
| Total Housing Units | 2,793 | 100.0% |
Occupancy by Ownership by Household Size in Gardnerville
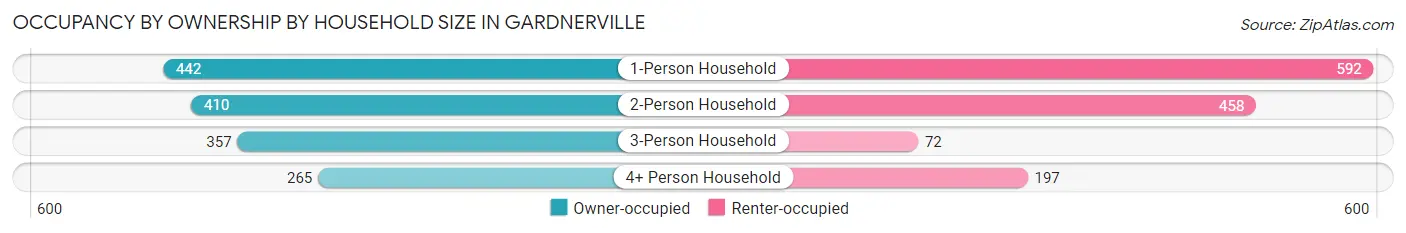
| Household Size | Owner-occupied | Renter-occupied |
| 1-Person Household | 442 (42.7%) | 592 (57.3%) |
| 2-Person Household | 410 (47.2%) | 458 (52.8%) |
| 3-Person Household | 357 (83.2%) | 72 (16.8%) |
| 4+ Person Household | 265 (57.4%) | 197 (42.6%) |
| Total Housing Units | 1,474 (52.8%) | 1,319 (47.2%) |
Occupancy by Educational Attainment in Gardnerville
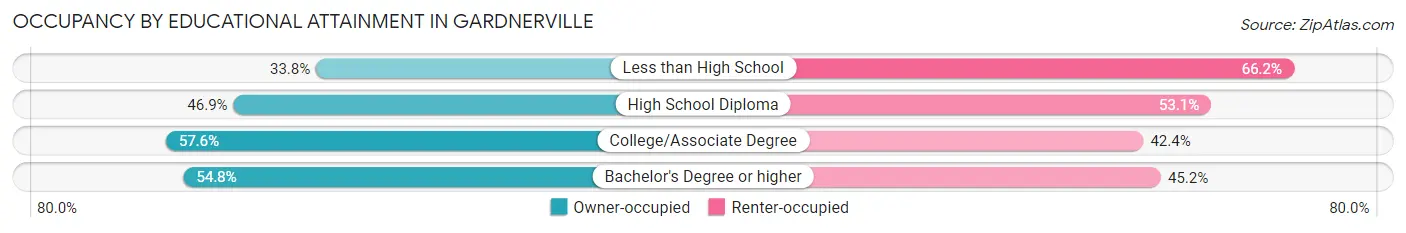
| Household Size | Owner-occupied | Renter-occupied |
| Less than High School | 51 (33.8%) | 100 (66.2%) |
| High School Diploma | 338 (46.9%) | 383 (53.1%) |
| College/Associate Degree | 663 (57.6%) | 488 (42.4%) |
| Bachelor's Degree or higher | 422 (54.8%) | 348 (45.2%) |
Occupancy by Age of Householder in Gardnerville
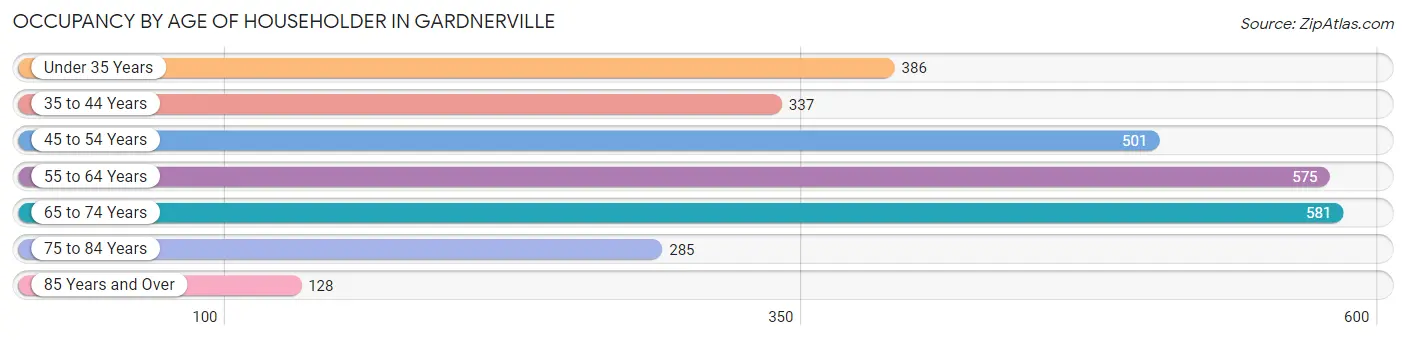
| Age Bracket | # Households | % Households |
| Under 35 Years | 386 | 13.8% |
| 35 to 44 Years | 337 | 12.1% |
| 45 to 54 Years | 501 | 17.9% |
| 55 to 64 Years | 575 | 20.6% |
| 65 to 74 Years | 581 | 20.8% |
| 75 to 84 Years | 285 | 10.2% |
| 85 Years and Over | 128 | 4.6% |
| Total | 2,793 | 100.0% |
Housing Finances in Gardnerville
Median Income by Occupancy in Gardnerville
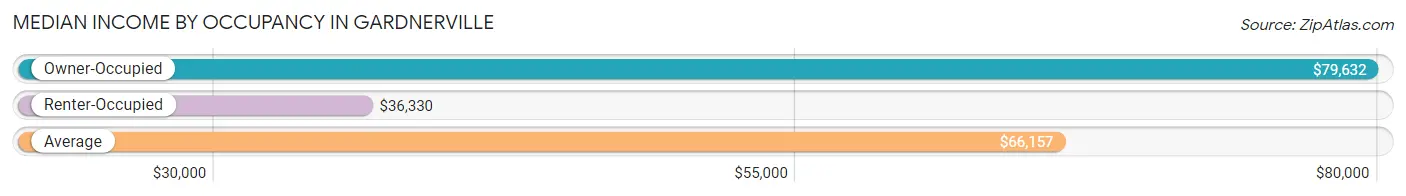
| Occupancy Type | # Households | Median Income |
| Owner-Occupied | 1,474 (52.8%) | $79,632 |
| Renter-Occupied | 1,319 (47.2%) | $36,330 |
| Average | 2,793 (100.0%) | $66,157 |
Occupancy by Householder Income Bracket in Gardnerville
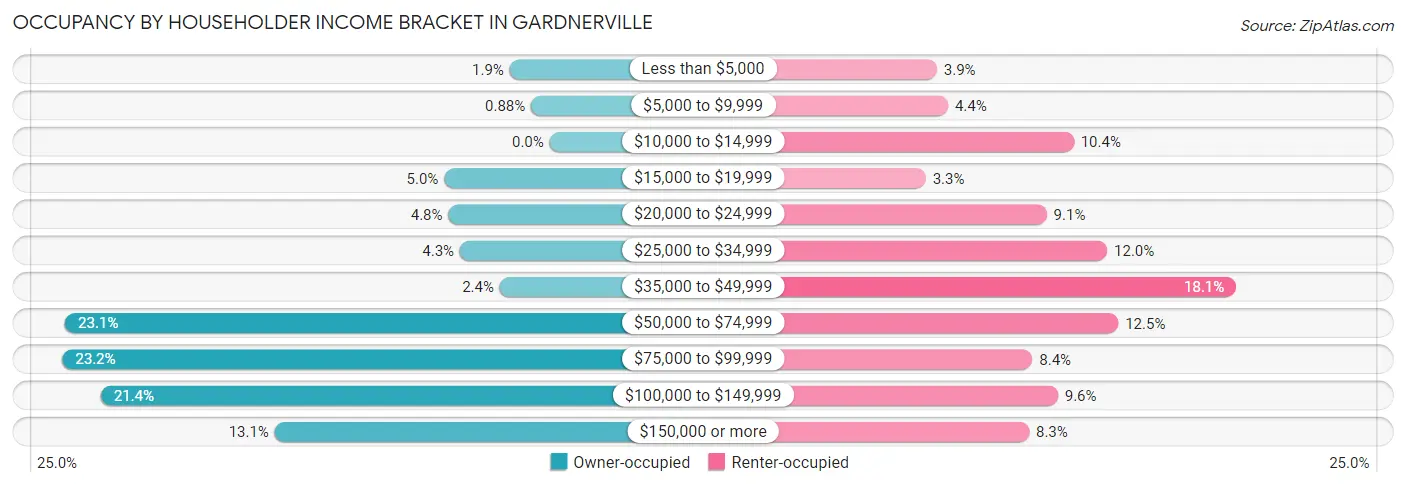
| Income Bracket | Owner-occupied | Renter-occupied |
| Less than $5,000 | 28 (1.9%) | 51 (3.9%) |
| $5,000 to $9,999 | 13 (0.9%) | 58 (4.4%) |
| $10,000 to $14,999 | 0 (0.0%) | 137 (10.4%) |
| $15,000 to $19,999 | 74 (5.0%) | 44 (3.3%) |
| $20,000 to $24,999 | 71 (4.8%) | 120 (9.1%) |
| $25,000 to $34,999 | 63 (4.3%) | 158 (12.0%) |
| $35,000 to $49,999 | 35 (2.4%) | 239 (18.1%) |
| $50,000 to $74,999 | 340 (23.1%) | 165 (12.5%) |
| $75,000 to $99,999 | 342 (23.2%) | 111 (8.4%) |
| $100,000 to $149,999 | 315 (21.4%) | 127 (9.6%) |
| $150,000 or more | 193 (13.1%) | 109 (8.3%) |
| Total | 1,474 (100.0%) | 1,319 (100.0%) |
Monthly Housing Cost Tiers in Gardnerville
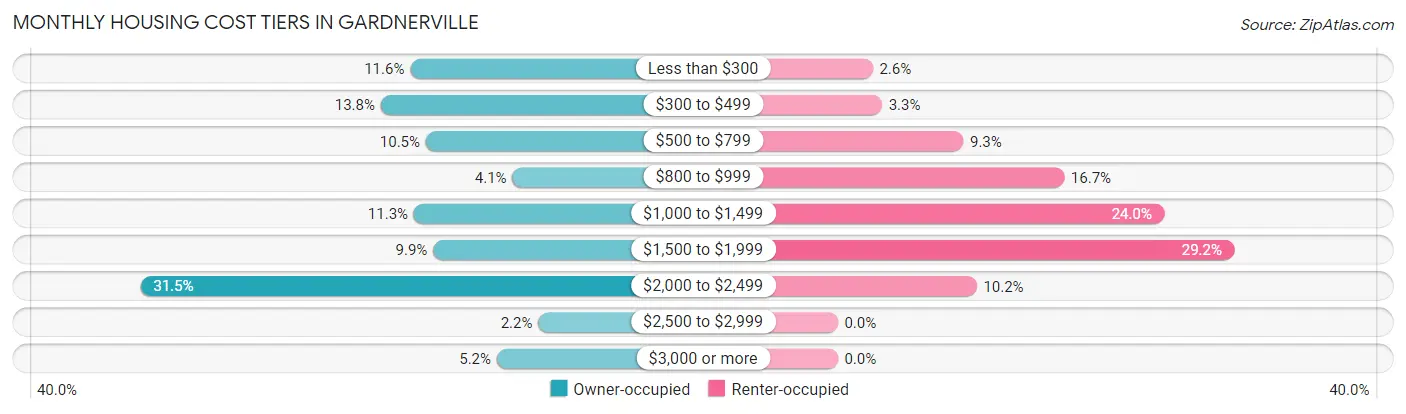
| Monthly Cost | Owner-occupied | Renter-occupied |
| Less than $300 | 171 (11.6%) | 34 (2.6%) |
| $300 to $499 | 203 (13.8%) | 43 (3.3%) |
| $500 to $799 | 154 (10.4%) | 122 (9.2%) |
| $800 to $999 | 60 (4.1%) | 220 (16.7%) |
| $1,000 to $1,499 | 167 (11.3%) | 317 (24.0%) |
| $1,500 to $1,999 | 146 (9.9%) | 385 (29.2%) |
| $2,000 to $2,499 | 464 (31.5%) | 135 (10.2%) |
| $2,500 to $2,999 | 32 (2.2%) | 0 (0.0%) |
| $3,000 or more | 77 (5.2%) | 0 (0.0%) |
| Total | 1,474 (100.0%) | 1,319 (100.0%) |
Physical Housing Characteristics in Gardnerville
Housing Structures in Gardnerville
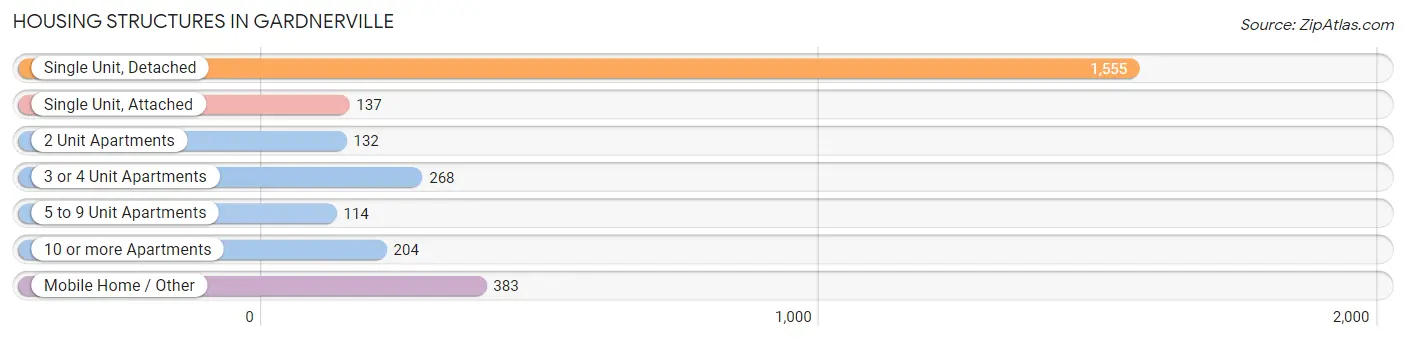
| Structure Type | # Housing Units | % Housing Units |
| Single Unit, Detached | 1,555 | 55.7% |
| Single Unit, Attached | 137 | 4.9% |
| 2 Unit Apartments | 132 | 4.7% |
| 3 or 4 Unit Apartments | 268 | 9.6% |
| 5 to 9 Unit Apartments | 114 | 4.1% |
| 10 or more Apartments | 204 | 7.3% |
| Mobile Home / Other | 383 | 13.7% |
| Total | 2,793 | 100.0% |
Housing Structures by Occupancy in Gardnerville
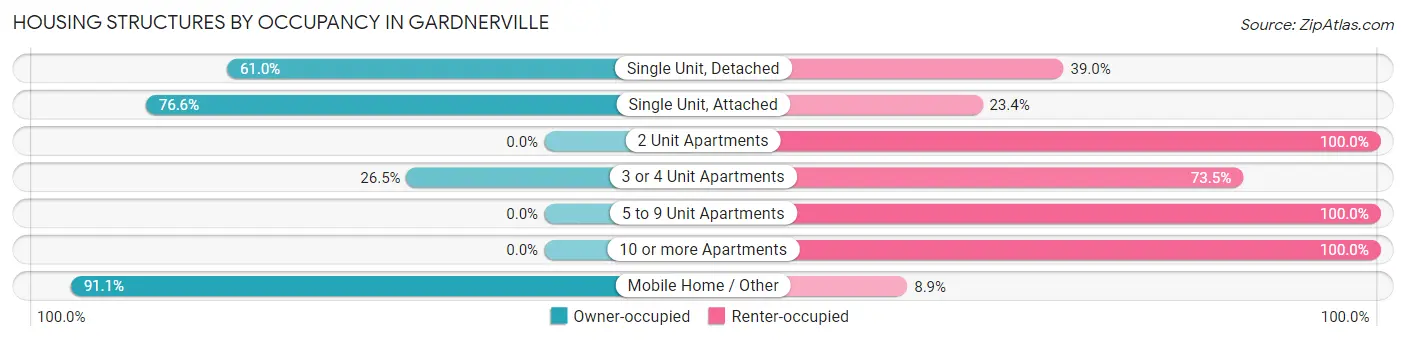
| Structure Type | Owner-occupied | Renter-occupied |
| Single Unit, Detached | 949 (61.0%) | 606 (39.0%) |
| Single Unit, Attached | 105 (76.6%) | 32 (23.4%) |
| 2 Unit Apartments | 0 (0.0%) | 132 (100.0%) |
| 3 or 4 Unit Apartments | 71 (26.5%) | 197 (73.5%) |
| 5 to 9 Unit Apartments | 0 (0.0%) | 114 (100.0%) |
| 10 or more Apartments | 0 (0.0%) | 204 (100.0%) |
| Mobile Home / Other | 349 (91.1%) | 34 (8.9%) |
| Total | 1,474 (52.8%) | 1,319 (47.2%) |
Housing Structures by Number of Rooms in Gardnerville
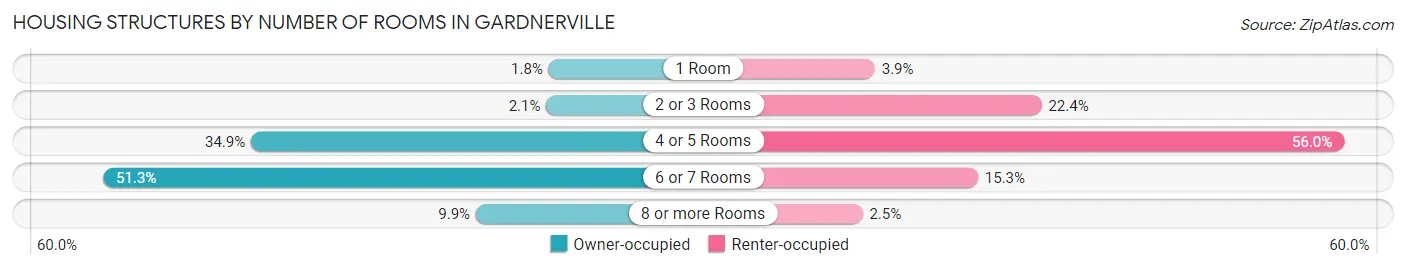
| Number of Rooms | Owner-occupied | Renter-occupied |
| 1 Room | 27 (1.8%) | 51 (3.9%) |
| 2 or 3 Rooms | 31 (2.1%) | 295 (22.4%) |
| 4 or 5 Rooms | 514 (34.9%) | 738 (55.9%) |
| 6 or 7 Rooms | 756 (51.3%) | 202 (15.3%) |
| 8 or more Rooms | 146 (9.9%) | 33 (2.5%) |
| Total | 1,474 (100.0%) | 1,319 (100.0%) |
Housing Structure by Heating Type in Gardnerville
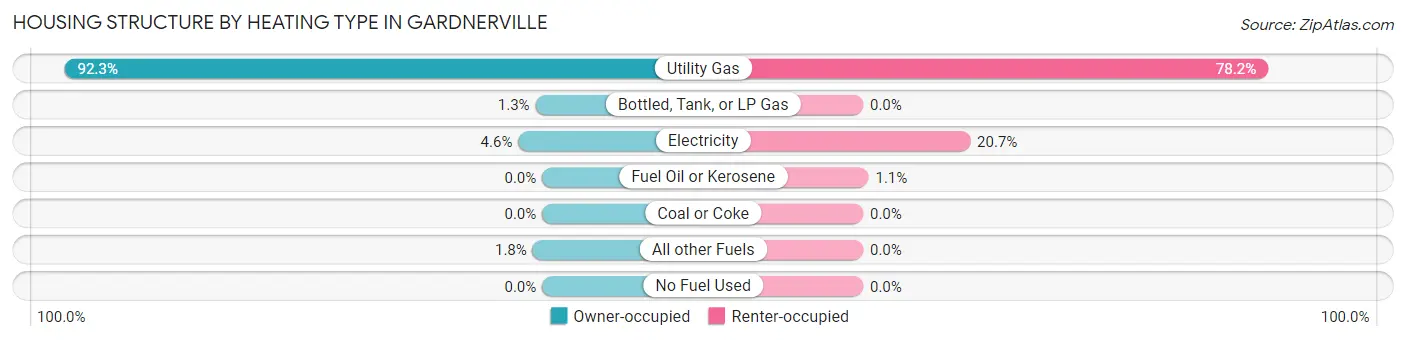
| Heating Type | Owner-occupied | Renter-occupied |
| Utility Gas | 1,360 (92.3%) | 1,032 (78.2%) |
| Bottled, Tank, or LP Gas | 19 (1.3%) | 0 (0.0%) |
| Electricity | 68 (4.6%) | 273 (20.7%) |
| Fuel Oil or Kerosene | 0 (0.0%) | 14 (1.1%) |
| Coal or Coke | 0 (0.0%) | 0 (0.0%) |
| All other Fuels | 27 (1.8%) | 0 (0.0%) |
| No Fuel Used | 0 (0.0%) | 0 (0.0%) |
| Total | 1,474 (100.0%) | 1,319 (100.0%) |
Household Vehicle Usage in Gardnerville
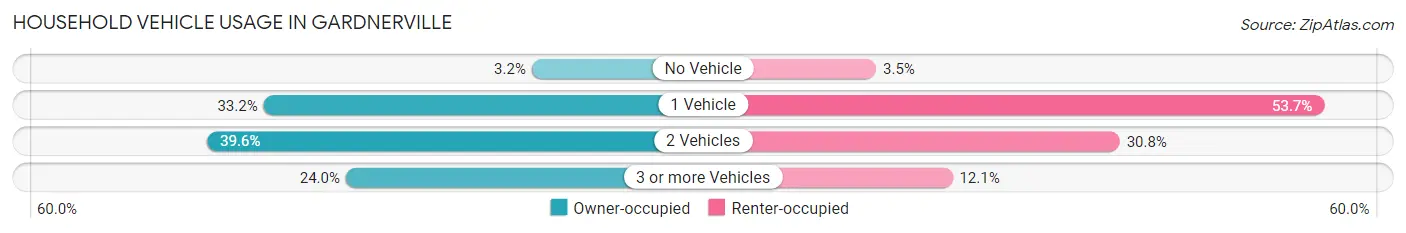
| Vehicles per Household | Owner-occupied | Renter-occupied |
| No Vehicle | 47 (3.2%) | 46 (3.5%) |
| 1 Vehicle | 490 (33.2%) | 708 (53.7%) |
| 2 Vehicles | 583 (39.6%) | 406 (30.8%) |
| 3 or more Vehicles | 354 (24.0%) | 159 (12.0%) |
| Total | 1,474 (100.0%) | 1,319 (100.0%) |
Real Estate & Mortgages in Gardnerville
Real Estate and Mortgage Overview in Gardnerville
| Characteristic | Without Mortgage | With Mortgage |
| Housing Units | 560 | 914 |
| Median Property Value | $218,400 | $441,500 |
| Median Household Income | $76,111 | $74 |
| Monthly Housing Costs | $398 | $77 |
| Real Estate Taxes | $1,213 | $14 |
Property Value by Mortgage Status in Gardnerville
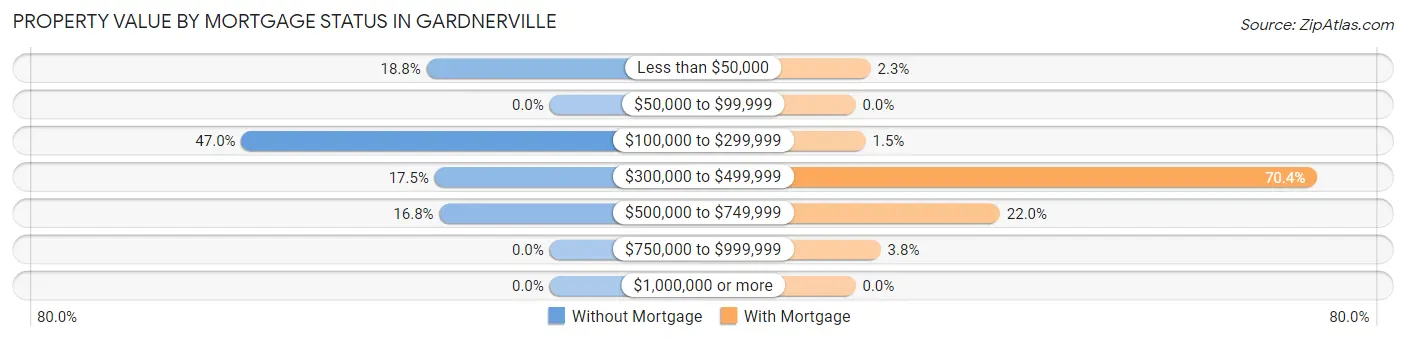
| Property Value | Without Mortgage | With Mortgage |
| Less than $50,000 | 105 (18.8%) | 21 (2.3%) |
| $50,000 to $99,999 | 0 (0.0%) | 0 (0.0%) |
| $100,000 to $299,999 | 263 (47.0%) | 14 (1.5%) |
| $300,000 to $499,999 | 98 (17.5%) | 643 (70.4%) |
| $500,000 to $749,999 | 94 (16.8%) | 201 (22.0%) |
| $750,000 to $999,999 | 0 (0.0%) | 35 (3.8%) |
| $1,000,000 or more | 0 (0.0%) | 0 (0.0%) |
| Total | 560 (100.0%) | 914 (100.0%) |
Household Income by Mortgage Status in Gardnerville
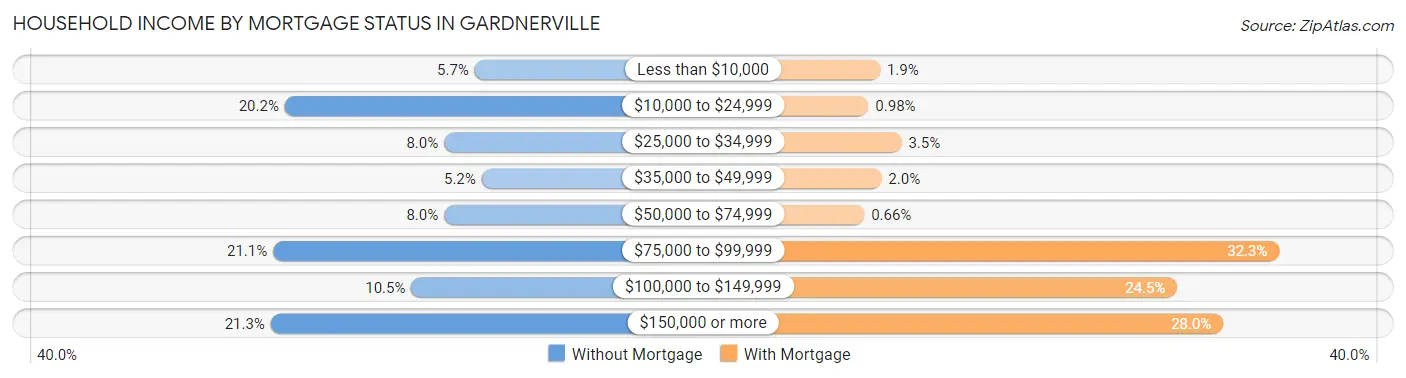
| Household Income | Without Mortgage | With Mortgage |
| Less than $10,000 | 32 (5.7%) | 17 (1.9%) |
| $10,000 to $24,999 | 113 (20.2%) | 9 (1.0%) |
| $25,000 to $34,999 | 45 (8.0%) | 32 (3.5%) |
| $35,000 to $49,999 | 29 (5.2%) | 18 (2.0%) |
| $50,000 to $74,999 | 45 (8.0%) | 6 (0.7%) |
| $75,000 to $99,999 | 118 (21.1%) | 295 (32.3%) |
| $100,000 to $149,999 | 59 (10.5%) | 224 (24.5%) |
| $150,000 or more | 119 (21.2%) | 256 (28.0%) |
| Total | 560 (100.0%) | 914 (100.0%) |
Property Value to Household Income Ratio in Gardnerville
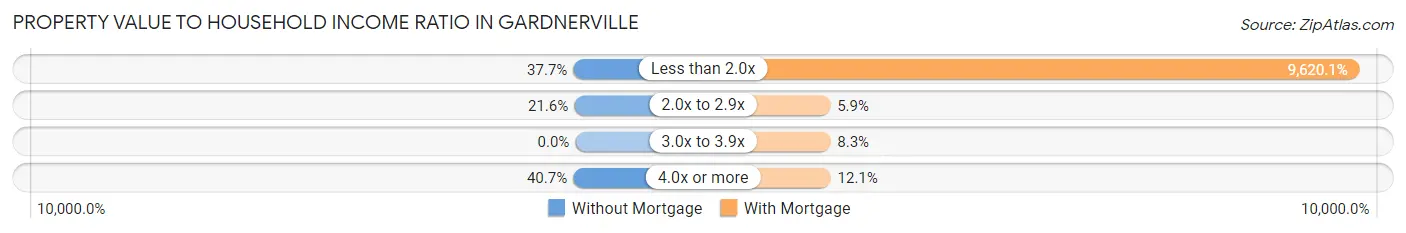
| Value-to-Income Ratio | Without Mortgage | With Mortgage |
| Less than 2.0x | 211 (37.7%) | 87,928 (9,620.1%) |
| 2.0x to 2.9x | 121 (21.6%) | 54 (5.9%) |
| 3.0x to 3.9x | 0 (0.0%) | 76 (8.3%) |
| 4.0x or more | 228 (40.7%) | 111 (12.1%) |
| Total | 560 (100.0%) | 914 (100.0%) |
Real Estate Taxes by Mortgage Status in Gardnerville
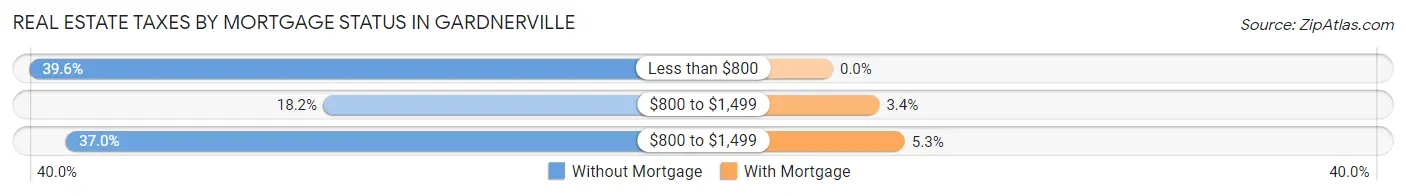
| Property Taxes | Without Mortgage | With Mortgage |
| Less than $800 | 222 (39.6%) | 0 (0.0%) |
| $800 to $1,499 | 102 (18.2%) | 31 (3.4%) |
| $800 to $1,499 | 207 (37.0%) | 48 (5.2%) |
| Total | 560 (100.0%) | 914 (100.0%) |
Health & Disability in Gardnerville
Health Insurance Coverage by Age in Gardnerville
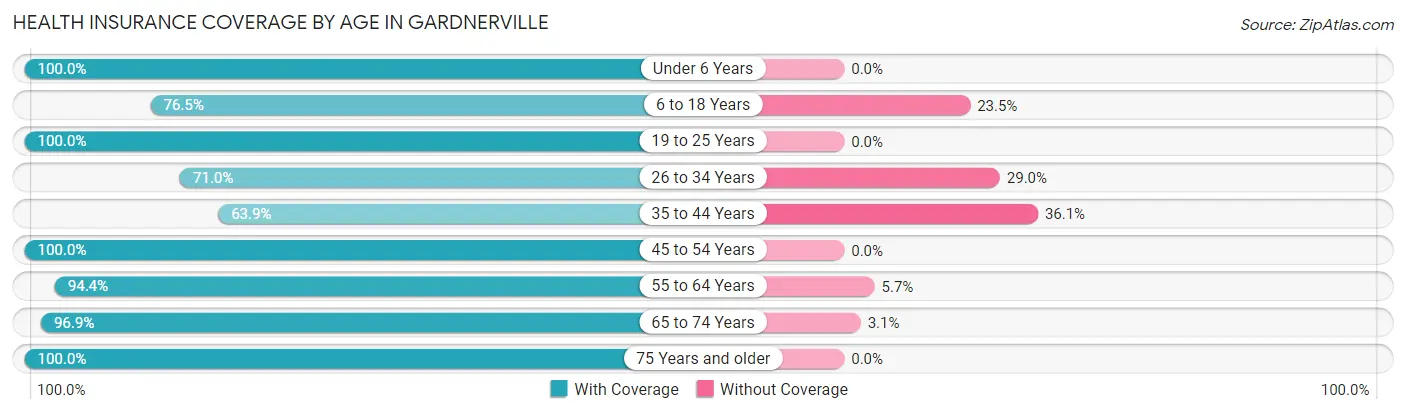
| Age Bracket | With Coverage | Without Coverage |
| Under 6 Years | 237 (100.0%) | 0 (0.0%) |
| 6 to 18 Years | 515 (76.5%) | 158 (23.5%) |
| 19 to 25 Years | 428 (100.0%) | 0 (0.0%) |
| 26 to 34 Years | 558 (71.0%) | 228 (29.0%) |
| 35 to 44 Years | 437 (63.9%) | 247 (36.1%) |
| 45 to 54 Years | 648 (100.0%) | 0 (0.0%) |
| 55 to 64 Years | 901 (94.4%) | 54 (5.7%) |
| 65 to 74 Years | 854 (96.9%) | 27 (3.1%) |
| 75 Years and older | 772 (100.0%) | 0 (0.0%) |
| Total | 5,350 (88.2%) | 714 (11.8%) |
Health Insurance Coverage by Citizenship Status in Gardnerville
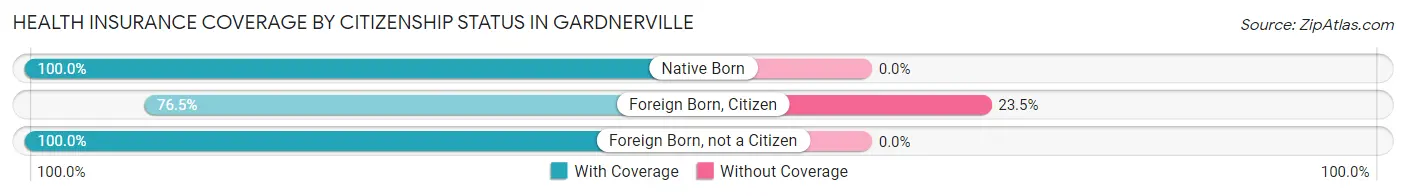
| Citizenship Status | With Coverage | Without Coverage |
| Native Born | 237 (100.0%) | 0 (0.0%) |
| Foreign Born, Citizen | 515 (76.5%) | 158 (23.5%) |
| Foreign Born, not a Citizen | 428 (100.0%) | 0 (0.0%) |
Health Insurance Coverage by Household Income in Gardnerville
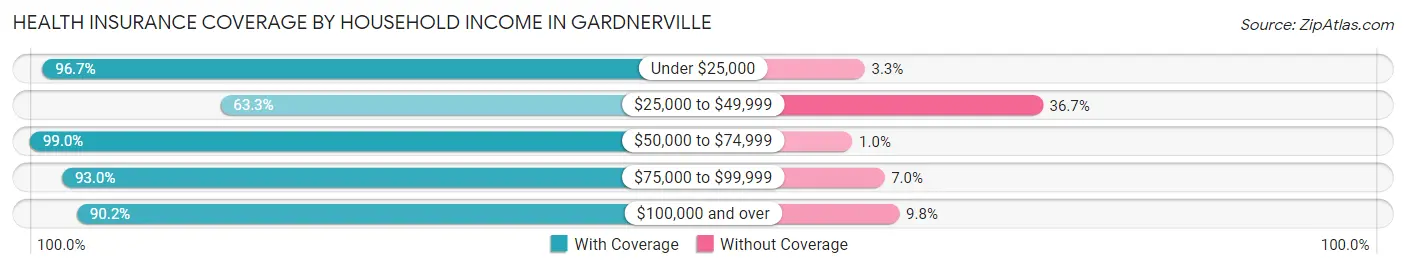
| Household Income | With Coverage | Without Coverage |
| Under $25,000 | 786 (96.7%) | 27 (3.3%) |
| $25,000 to $49,999 | 694 (63.3%) | 402 (36.7%) |
| $50,000 to $74,999 | 893 (99.0%) | 9 (1.0%) |
| $75,000 to $99,999 | 1,247 (93.0%) | 94 (7.0%) |
| $100,000 and over | 1,673 (90.2%) | 182 (9.8%) |
Public vs Private Health Insurance Coverage by Age in Gardnerville
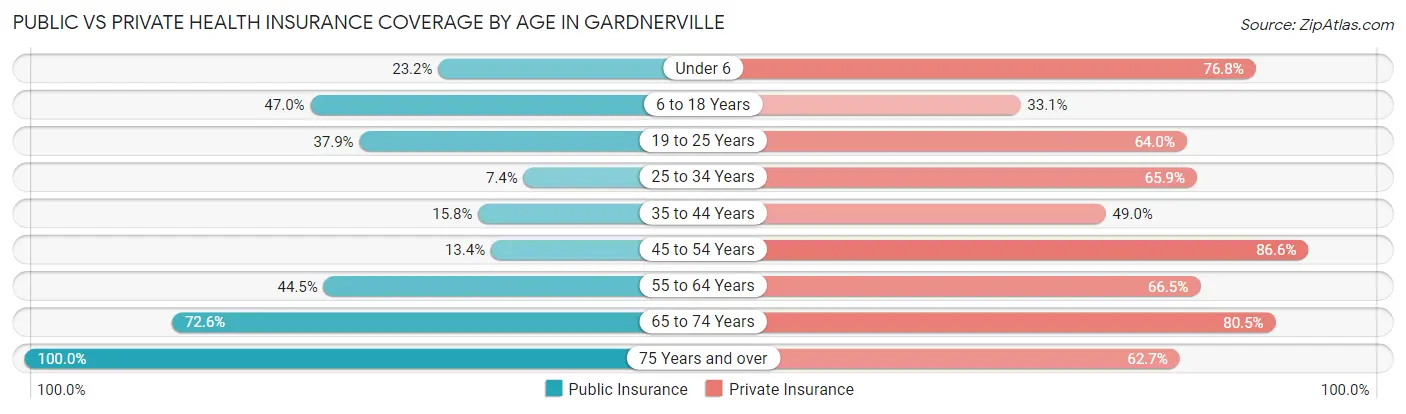
| Age Bracket | Public Insurance | Private Insurance |
| Under 6 | 55 (23.2%) | 182 (76.8%) |
| 6 to 18 Years | 316 (46.9%) | 223 (33.1%) |
| 19 to 25 Years | 162 (37.9%) | 274 (64.0%) |
| 25 to 34 Years | 58 (7.4%) | 518 (65.9%) |
| 35 to 44 Years | 108 (15.8%) | 335 (49.0%) |
| 45 to 54 Years | 87 (13.4%) | 561 (86.6%) |
| 55 to 64 Years | 425 (44.5%) | 635 (66.5%) |
| 65 to 74 Years | 640 (72.6%) | 709 (80.5%) |
| 75 Years and over | 772 (100.0%) | 484 (62.7%) |
| Total | 2,623 (43.3%) | 3,921 (64.7%) |
Disability Status by Sex by Age in Gardnerville
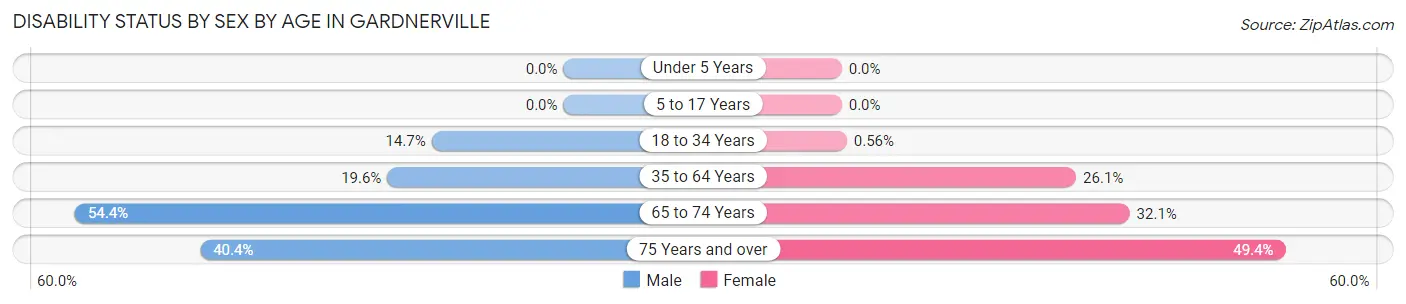
| Age Bracket | Male | Female |
| Under 5 Years | 0 (0.0%) | 0 (0.0%) |
| 5 to 17 Years | 0 (0.0%) | 0 (0.0%) |
| 18 to 34 Years | 112 (14.7%) | 3 (0.6%) |
| 35 to 64 Years | 248 (19.6%) | 267 (26.1%) |
| 65 to 74 Years | 223 (54.4%) | 151 (32.1%) |
| 75 Years and over | 110 (40.4%) | 247 (49.4%) |
Disability Class by Sex by Age in Gardnerville
Disability Class: Hearing Difficulty
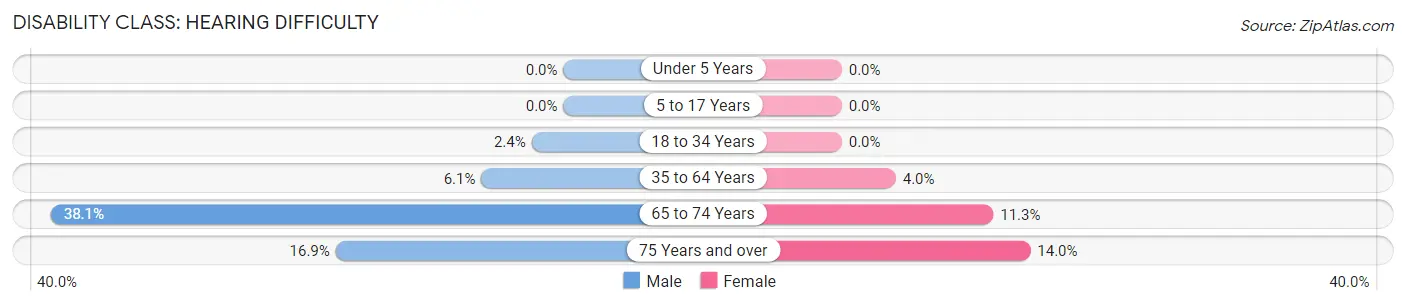
| Age Bracket | Male | Female |
| Under 5 Years | 0 (0.0%) | 0 (0.0%) |
| 5 to 17 Years | 0 (0.0%) | 0 (0.0%) |
| 18 to 34 Years | 18 (2.4%) | 0 (0.0%) |
| 35 to 64 Years | 77 (6.1%) | 41 (4.0%) |
| 65 to 74 Years | 156 (38.1%) | 53 (11.3%) |
| 75 Years and over | 46 (16.9%) | 70 (14.0%) |
Disability Class: Vision Difficulty
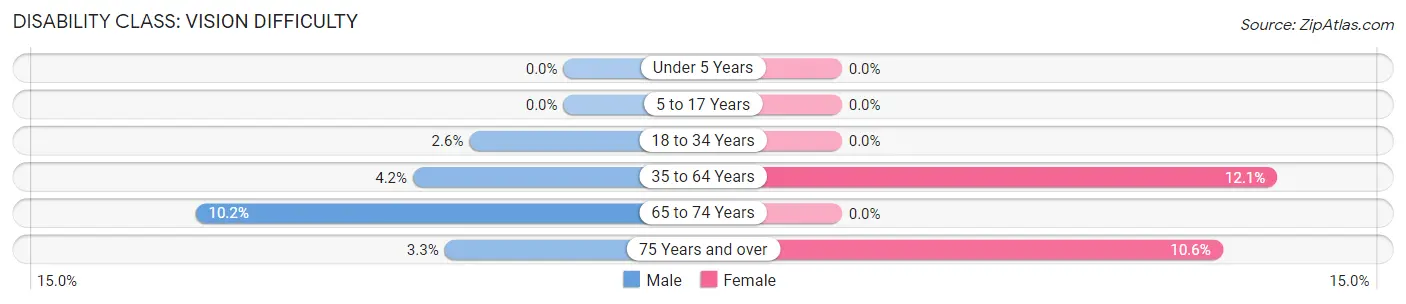
| Age Bracket | Male | Female |
| Under 5 Years | 0 (0.0%) | 0 (0.0%) |
| 5 to 17 Years | 0 (0.0%) | 0 (0.0%) |
| 18 to 34 Years | 20 (2.6%) | 0 (0.0%) |
| 35 to 64 Years | 53 (4.2%) | 124 (12.1%) |
| 65 to 74 Years | 42 (10.2%) | 0 (0.0%) |
| 75 Years and over | 9 (3.3%) | 53 (10.6%) |
Disability Class: Cognitive Difficulty
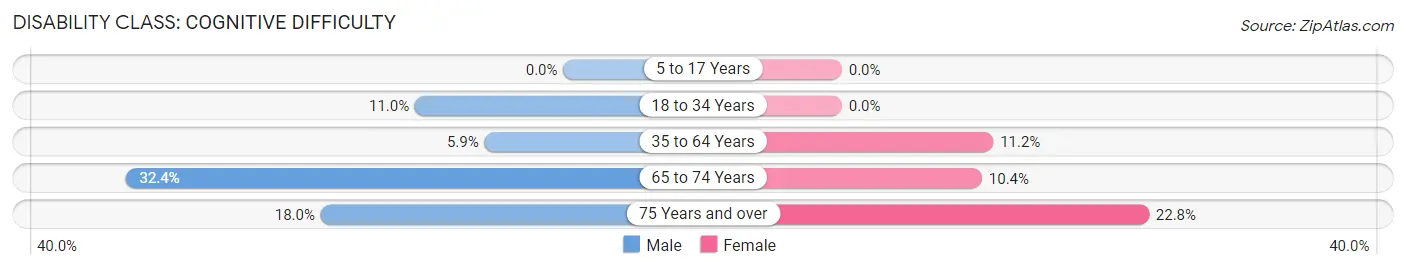
| Age Bracket | Male | Female |
| 5 to 17 Years | 0 (0.0%) | 0 (0.0%) |
| 18 to 34 Years | 84 (11.0%) | 0 (0.0%) |
| 35 to 64 Years | 74 (5.9%) | 115 (11.2%) |
| 65 to 74 Years | 133 (32.4%) | 49 (10.4%) |
| 75 Years and over | 49 (18.0%) | 114 (22.8%) |
Disability Class: Ambulatory Difficulty
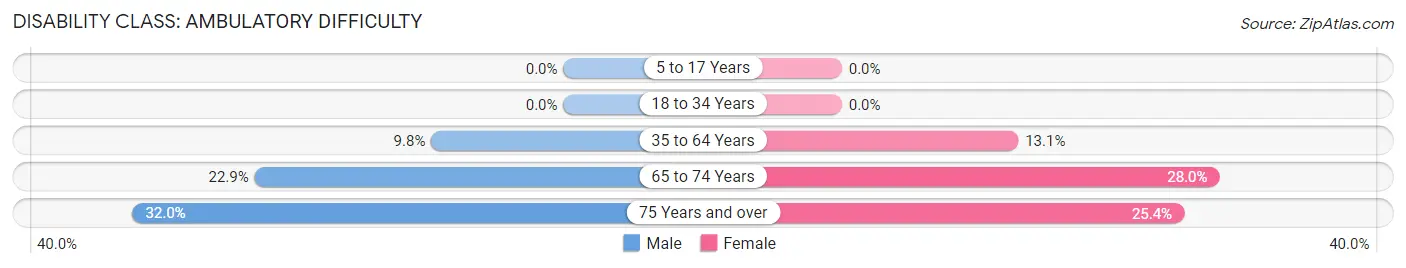
| Age Bracket | Male | Female |
| 5 to 17 Years | 0 (0.0%) | 0 (0.0%) |
| 18 to 34 Years | 0 (0.0%) | 0 (0.0%) |
| 35 to 64 Years | 124 (9.8%) | 134 (13.1%) |
| 65 to 74 Years | 94 (22.9%) | 132 (28.0%) |
| 75 Years and over | 87 (32.0%) | 127 (25.4%) |
Disability Class: Self-Care Difficulty
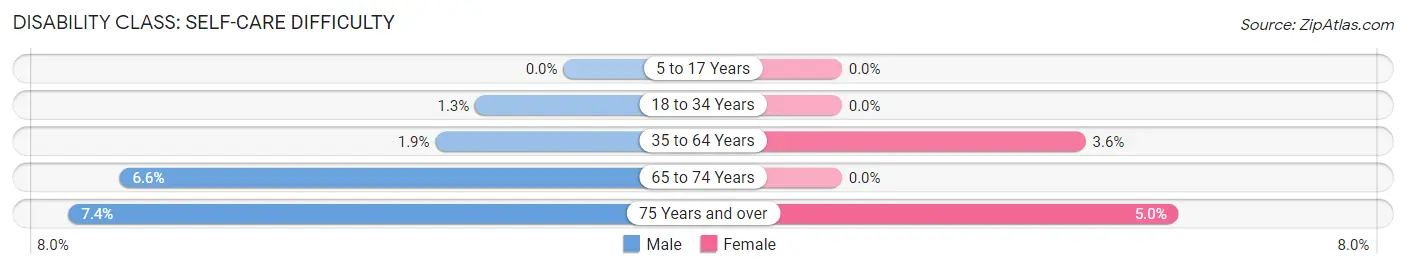
| Age Bracket | Male | Female |
| 5 to 17 Years | 0 (0.0%) | 0 (0.0%) |
| 18 to 34 Years | 10 (1.3%) | 0 (0.0%) |
| 35 to 64 Years | 24 (1.9%) | 37 (3.6%) |
| 65 to 74 Years | 27 (6.6%) | 0 (0.0%) |
| 75 Years and over | 20 (7.3%) | 25 (5.0%) |
Technology Access in Gardnerville
Computing Device Access in Gardnerville
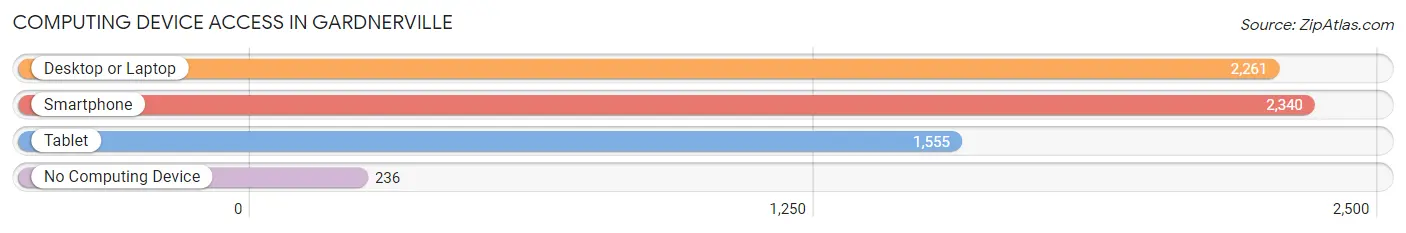
| Device Type | # Households | % Households |
| Desktop or Laptop | 2,261 | 80.9% |
| Smartphone | 2,340 | 83.8% |
| Tablet | 1,555 | 55.7% |
| No Computing Device | 236 | 8.5% |
| Total | 2,793 | 100.0% |
Internet Access in Gardnerville
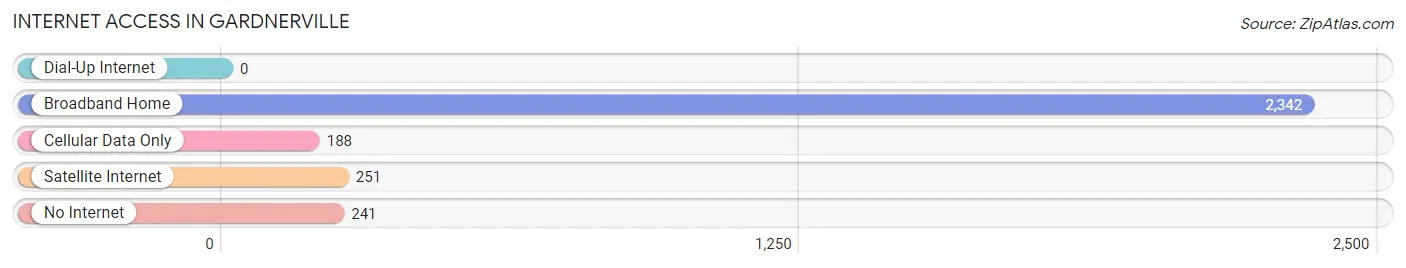
| Internet Type | # Households | % Households |
| Dial-Up Internet | 0 | 0.0% |
| Broadband Home | 2,342 | 83.9% |
| Cellular Data Only | 188 | 6.7% |
| Satellite Internet | 251 | 9.0% |
| No Internet | 241 | 8.6% |
| Total | 2,793 | 100.0% |
Gardnerville Summary
Gardnerville is a census-designated place (CDP) located in Douglas County, Nevada, United States. The population was 5,656 at the 2010 census. It is part of the Carson City Metropolitan Statistical Area.
History
Gardnerville was founded in 1879 by John Gardnerville, a rancher from California. He purchased a large tract of land in the area and began to develop it for agricultural purposes. The town was originally called Gardnerville Rancho, but the name was shortened to Gardnerville in 1882.
Gardnerville was incorporated in 1906 and has since grown to become the largest town in Douglas County. The town has a rich history, with many of its original buildings still standing. The town was the site of the first Nevada State Fair in 1885, and the first Nevada State Prison in 1887.
Geography
Gardnerville is located at the base of the Sierra Nevada mountain range in western Nevada. It is situated at the intersection of US Highway 395 and State Route 88. The town is located approximately 20 miles south of Carson City and 30 miles north of Lake Tahoe.
The town is surrounded by the Carson Valley, which is a large agricultural area. The Carson River runs through the valley, providing irrigation for the area's farms and ranches.
The town has a total area of 4 2 square miles all of which is land
Economy
Gardnerville is a small town with a diverse economy. The town is home to a variety of businesses, including retail stores, restaurants, and professional services. The town is also home to several manufacturing companies, including a furniture factory and a printing company.
The town is also home to several casinos, which provide a significant source of revenue for the town. The casinos are located on the south end of town, near the intersection of US Highway 395 and State Route 88.
Demographics
As of the 2010 census, there were 5,656 people, 2,072 households, and 1,521 families residing in the town. The population density was 1,346.2 people per square mile. The racial makeup of the town was 87.3% White, 0.7% African American, 0.7% Native American, 0.9% Asian, 0.1% Pacific Islander, 8.2% from other races, and 2.2% from two or more races. Hispanic or Latino of any race were 16.3% of the population.
The median income for a household in the town was $50,938, and the median income for a family was $60,938. Males had a median income of $41,938 versus $30,938 for females. The per capita income for the town was $23,938. About 6.2% of families and 8.2% of the population were below the poverty line, including 10.2% of those under age 18 and 6.2% of those age 65 or over.
Common Questions
What is Per Capita Income in Gardnerville?
Per Capita income in Gardnerville is $34,288.
What is the Median Family Income in Gardnerville?
Median Family Income in Gardnerville is $79,823.
What is the Median Household income in Gardnerville?
Median Household Income in Gardnerville is $66,157.
What is Income or Wage Gap in Gardnerville?
Income or Wage Gap in Gardnerville is 42.9%.
Women in Gardnerville earn 57.1 cents for every dollar earned by a man.
What is Inequality or Gini Index in Gardnerville?
Inequality or Gini Index in Gardnerville is 0.42.
What is the Total Population of Gardnerville?
Total Population of Gardnerville is 6,147.
What is the Total Male Population of Gardnerville?
Total Male Population of Gardnerville is 3,393.
What is the Total Female Population of Gardnerville?
Total Female Population of Gardnerville is 2,754.
What is the Ratio of Males per 100 Females in Gardnerville?
There are 123.20 Males per 100 Females in Gardnerville.
What is the Ratio of Females per 100 Males in Gardnerville?
There are 81.17 Females per 100 Males in Gardnerville.
What is the Median Population Age in Gardnerville?
Median Population Age in Gardnerville is 49.0 Years.
What is the Average Family Size in Gardnerville
Average Family Size in Gardnerville is 2.9 People.
What is the Average Household Size in Gardnerville
Average Household Size in Gardnerville is 2.1 People.
How Large is the Labor Force in Gardnerville?
There are 3,058 People in the Labor Forcein in Gardnerville.
What is the Percentage of People in the Labor Force in Gardnerville?
55.9% of People are in the Labor Force in Gardnerville.
What is the Unemployment Rate in Gardnerville?
Unemployment Rate in Gardnerville is 4.5%.