Zip Codes with the Highest Percentage of Households with Income Below $10,000 in Carson City, NV
RELATED REPORTS & OPTIONS
Household Income | $0-10k
Carson City
Compare Zip Codes
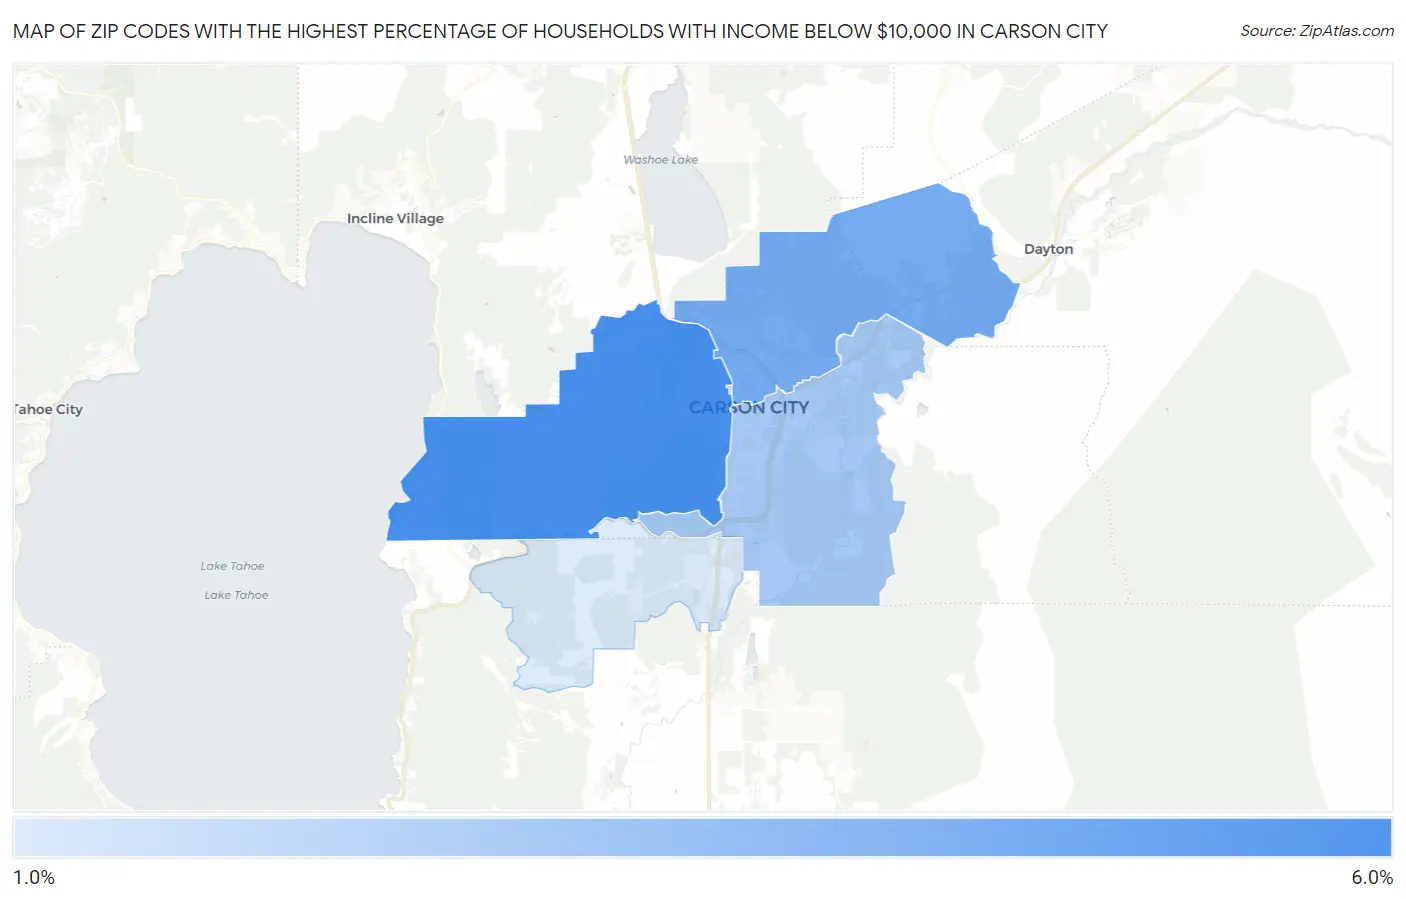
Map of Zip Codes with the Highest Percentage of Households with Income Below $10,000 in Carson City
1.6%
5.4%
Zip Codes with the Highest Percentage of Households with Income Below $10,000 in Carson City, NV
| Zip Code | Households with Income < $10k | vs State | vs National | |
| 1. | 89703 | 5.4% | 5.4%(=0.000)#54 | 4.9%(+0.500)#10,538 |
| 2. | 89706 | 4.2% | 5.4%(-1.20)#83 | 4.9%(-0.700)#14,532 |
| 3. | 89701 | 3.0% | 5.4%(-2.40)#110 | 4.9%(-1.90)#19,358 |
| 4. | 89705 | 1.6% | 5.4%(-3.80)#133 | 4.9%(-3.30)#25,195 |
1
Common Questions
What are the Top 3 Zip Codes with the Highest Percentage of Households with Income Below $10,000 in Carson City, NV?
Top 3 Zip Codes with the Highest Percentage of Households with Income Below $10,000 in Carson City, NV are:
What zip code has the Highest Percentage of Households with Income Below $10,000 in Carson City, NV?
89703 has the Highest Percentage of Households with Income Below $10,000 in Carson City, NV with 5.4%.
What is the Percentage of Households with Income Below $10,000 in Nevada?
Percentage of Households with Income Below $10,000 in Nevada is 5.4%.
What is the Percentage of Households with Income Below $10,000 in the United States?
Percentage of Households with Income Below $10,000 in the United States is 4.9%.