Minden, NV Map & Demographics
Minden Map
Minden Overview
$43,921
PER CAPITA INCOME
$105,833
AVG FAMILY INCOME
$87,778
AVG HOUSEHOLD INCOME
32.6%
WAGE / INCOME GAP [ % ]
67.4¢/ $1
WAGE / INCOME GAP [ $ ]
0.40
INEQUALITY / GINI INDEX
3,140
TOTAL POPULATION
1,530
MALE POPULATION
1,610
FEMALE POPULATION
95.03
MALES / 100 FEMALES
105.23
FEMALES / 100 MALES
51.0
MEDIAN AGE
2.8
AVG FAMILY SIZE
2.4
AVG HOUSEHOLD SIZE
1,491
LABOR FORCE [ PEOPLE ]
55.1%
PERCENT IN LABOR FORCE
0.5%
UNEMPLOYMENT RATE
Minden Zip Codes
Minden Area Codes
Income in Minden
Income Overview in Minden
Per Capita Income in Minden is $43,921, while median incomes of families and households are $105,833 and $87,778 respectively.
| Characteristic | Number | Measure |
| Per Capita Income | 3,140 | $43,921 |
| Median Family Income | 920 | $105,833 |
| Mean Family Income | 920 | $116,254 |
| Median Household Income | 1,304 | $87,778 |
| Mean Household Income | 1,304 | $99,603 |
| Income Deficit | 920 | $0 |
| Wage / Income Gap (%) | 3,140 | 32.55% |
| Wage / Income Gap ($) | 3,140 | 67.45¢ per $1 |
| Gini / Inequality Index | 3,140 | 0.40 |
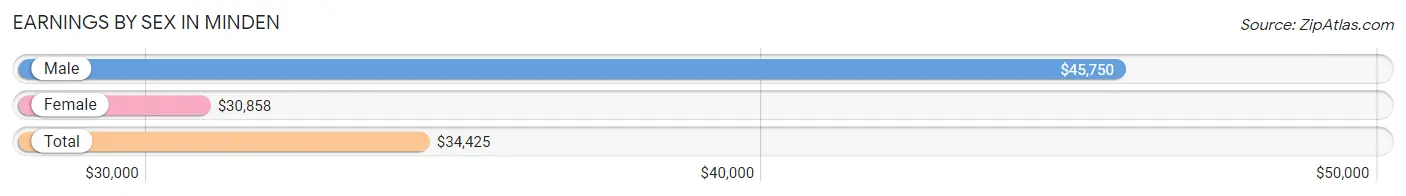
Earnings by Sex in Minden
Average Earnings in Minden are $34,425, $45,750 for men and $30,858 for women, a difference of 32.6%.
| Sex | Number | Average Earnings |
| Male | 812 (52.0%) | $45,750 |
| Female | 748 (47.9%) | $30,858 |
| Total | 1,560 (100.0%) | $34,425 |
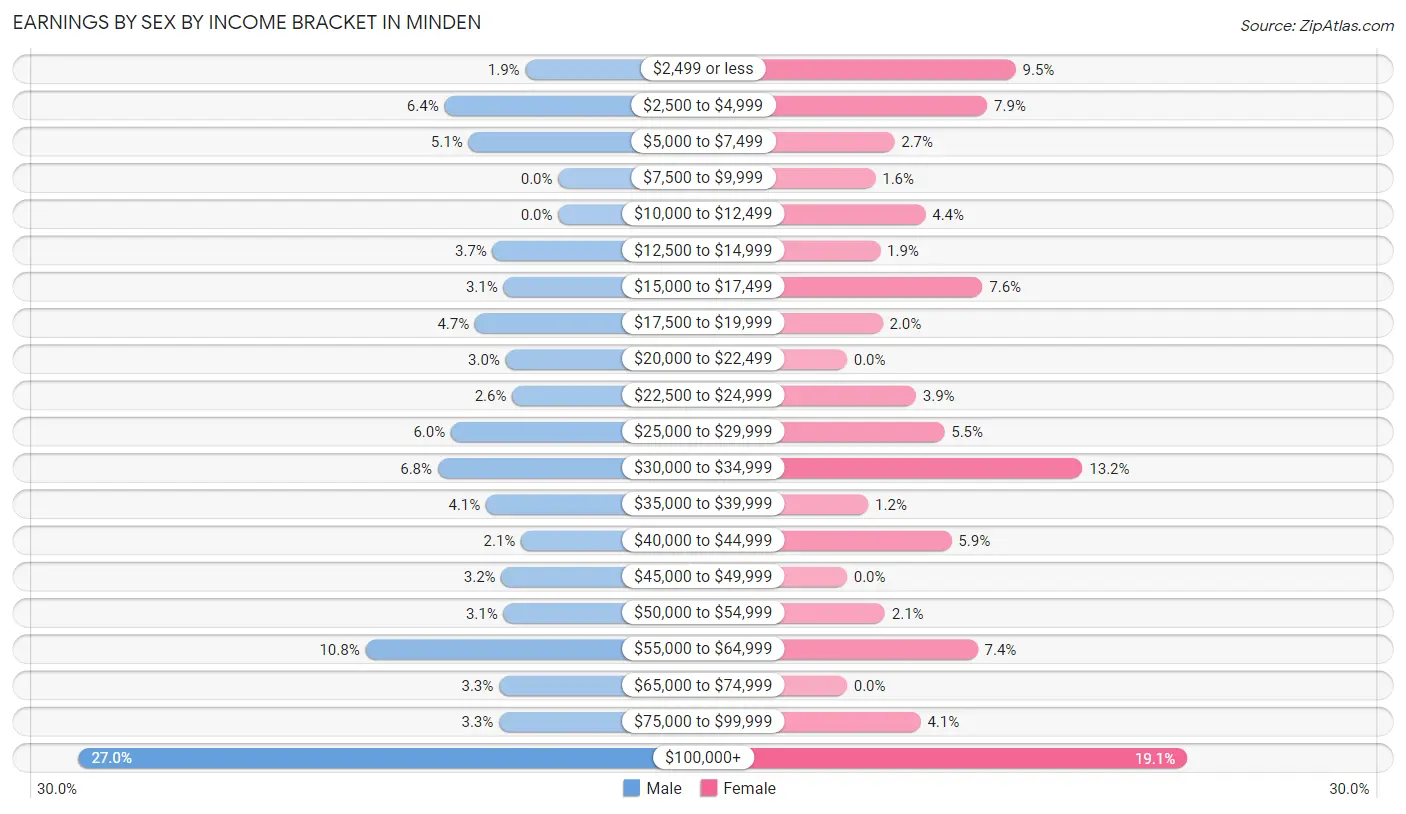
Earnings by Sex by Income Bracket in Minden
The most common earnings brackets in Minden are $100,000+ for men (219 | 27.0%) and $100,000+ for women (143 | 19.1%).
| Income | Male | Female |
| $2,499 or less | 15 (1.8%) | 71 (9.5%) |
| $2,500 to $4,999 | 52 (6.4%) | 59 (7.9%) |
| $5,000 to $7,499 | 41 (5.1%) | 20 (2.7%) |
| $7,500 to $9,999 | 0 (0.0%) | 12 (1.6%) |
| $10,000 to $12,499 | 0 (0.0%) | 33 (4.4%) |
| $12,500 to $14,999 | 30 (3.7%) | 14 (1.9%) |
| $15,000 to $17,499 | 25 (3.1%) | 57 (7.6%) |
| $17,500 to $19,999 | 38 (4.7%) | 15 (2.0%) |
| $20,000 to $22,499 | 24 (3.0%) | 0 (0.0%) |
| $22,500 to $24,999 | 21 (2.6%) | 29 (3.9%) |
| $25,000 to $29,999 | 49 (6.0%) | 41 (5.5%) |
| $30,000 to $34,999 | 55 (6.8%) | 99 (13.2%) |
| $35,000 to $39,999 | 33 (4.1%) | 9 (1.2%) |
| $40,000 to $44,999 | 17 (2.1%) | 44 (5.9%) |
| $45,000 to $49,999 | 26 (3.2%) | 0 (0.0%) |
| $50,000 to $54,999 | 25 (3.1%) | 16 (2.1%) |
| $55,000 to $64,999 | 88 (10.8%) | 55 (7.3%) |
| $65,000 to $74,999 | 27 (3.3%) | 0 (0.0%) |
| $75,000 to $99,999 | 27 (3.3%) | 31 (4.1%) |
| $100,000+ | 219 (27.0%) | 143 (19.1%) |
| Total | 812 (100.0%) | 748 (100.0%) |
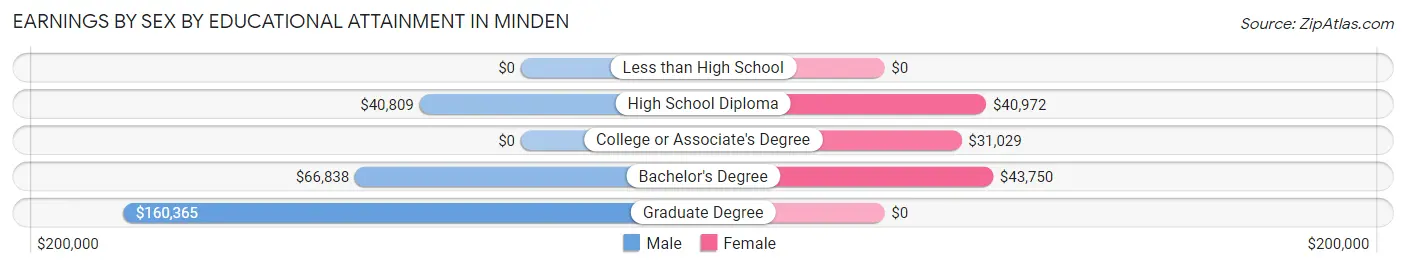
Earnings by Sex by Educational Attainment in Minden
Average earnings in Minden are $51,818 for men and $34,297 for women, a difference of 33.8%. Men with an educational attainment of graduate degree enjoy the highest average annual earnings of $160,365, while those with high school diploma education earn the least with $40,809. Women with an educational attainment of bachelor's degree earn the most with the average annual earnings of $43,750, while those with college or associate's degree education have the smallest earnings of $31,029.
| Educational Attainment | Male Income | Female Income |
| Less than High School | - | - |
| High School Diploma | $40,809 | $40,972 |
| College or Associate's Degree | - | - |
| Bachelor's Degree | $66,838 | $43,750 |
| Graduate Degree | $160,365 | $0 |
| Total | $51,818 | $34,297 |
Family Income in Minden
Family Income Brackets in Minden
According to the Minden family income data, there are 246 families falling into the $100,000 to $149,999 income range, which is the most common income bracket and makes up 26.7% of all families.
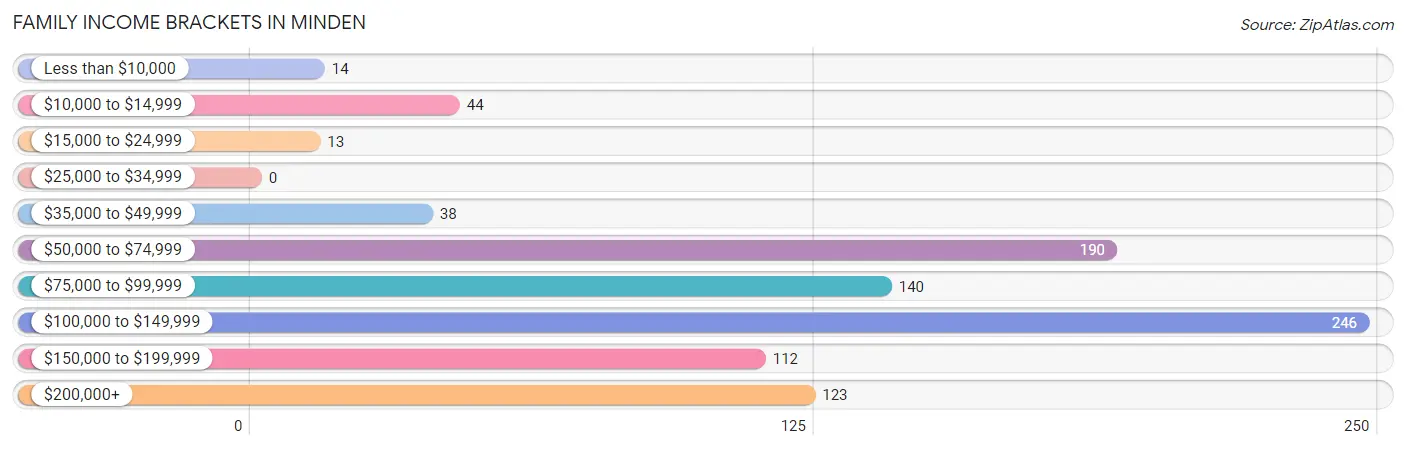
| Income Bracket | # Families | % Families |
| Less than $10,000 | 14 | 1.5% |
| $10,000 to $14,999 | 44 | 4.8% |
| $15,000 to $24,999 | 13 | 1.4% |
| $25,000 to $34,999 | 0 | 0.0% |
| $35,000 to $49,999 | 38 | 4.1% |
| $50,000 to $74,999 | 190 | 20.7% |
| $75,000 to $99,999 | 140 | 15.2% |
| $100,000 to $149,999 | 246 | 26.7% |
| $150,000 to $199,999 | 112 | 12.2% |
| $200,000+ | 123 | 13.4% |
Family Income by Famaliy Size in Minden
5-person families (29 | 3.2%) account for the highest median family income in Minden with $196,705 per family, while 2-person families (638 | 69.4%) have the highest median income of $49,554 per family member.
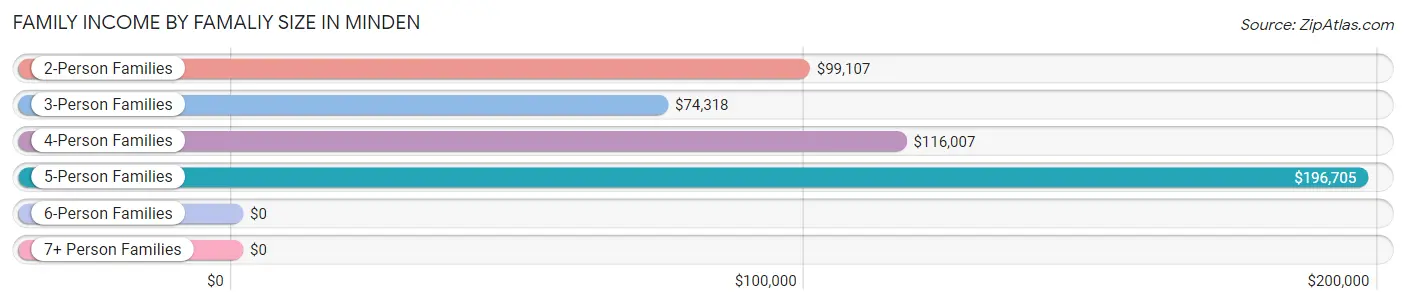
| Income Bracket | # Families | Median Income |
| 2-Person Families | 638 (69.4%) | $99,107 |
| 3-Person Families | 112 (12.2%) | $74,318 |
| 4-Person Families | 141 (15.3%) | $116,007 |
| 5-Person Families | 29 (3.2%) | $196,705 |
| 6-Person Families | 0 (0.0%) | $0 |
| 7+ Person Families | 0 (0.0%) | $0 |
| Total | 920 (100.0%) | $105,833 |
Family Income by Number of Earners in Minden
The median family income in Minden is $105,833, with families comprising 3+ earners (56) having the highest median family income of $136,786, while families with no earners (247) have the lowest median family income of $95,583, accounting for 6.1% and 26.9% of families, respectively.
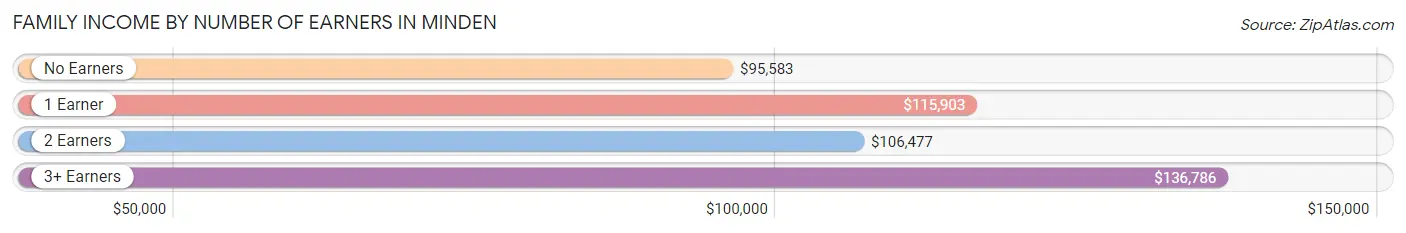
| Number of Earners | # Families | Median Income |
| No Earners | 247 (26.9%) | $95,583 |
| 1 Earner | 270 (29.3%) | $115,903 |
| 2 Earners | 347 (37.7%) | $106,477 |
| 3+ Earners | 56 (6.1%) | $136,786 |
| Total | 920 (100.0%) | $105,833 |
Household Income in Minden
Household Income Brackets in Minden
With 304 households falling in the category, the $100,000 to $149,999 income range is the most frequent in Minden, accounting for 23.3% of all households. In contrast, only 44 households (3.4%) fall into the $10,000 to $14,999 income bracket, making it the least populous group.
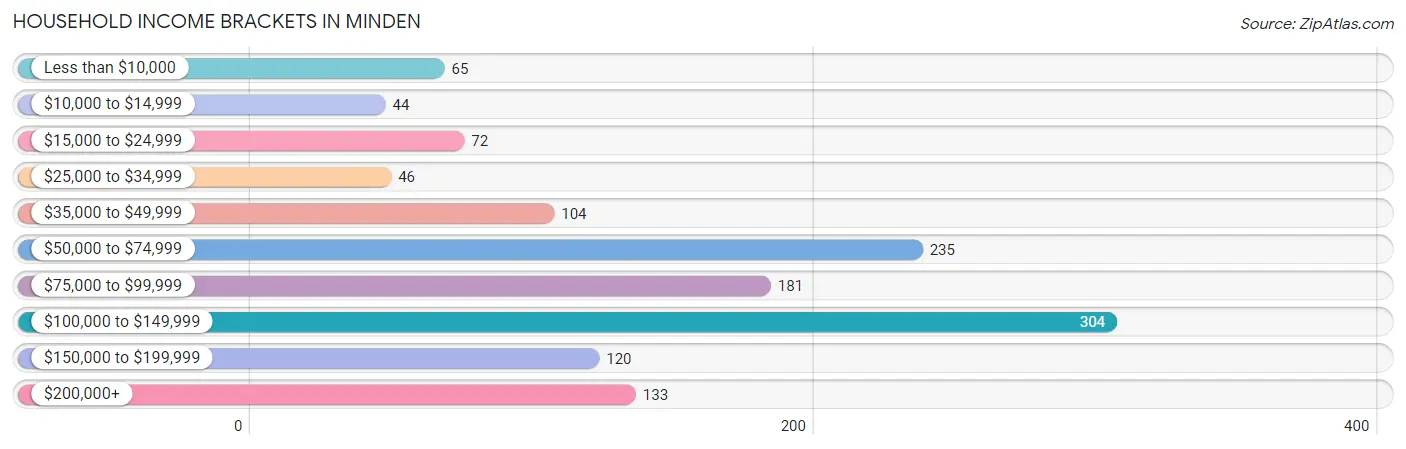
| Income Bracket | # Households | % Households |
| Less than $10,000 | 65 | 5.0% |
| $10,000 to $14,999 | 44 | 3.4% |
| $15,000 to $24,999 | 72 | 5.5% |
| $25,000 to $34,999 | 46 | 3.5% |
| $35,000 to $49,999 | 104 | 8.0% |
| $50,000 to $74,999 | 235 | 18.0% |
| $75,000 to $99,999 | 181 | 13.9% |
| $100,000 to $149,999 | 304 | 23.3% |
| $150,000 to $199,999 | 120 | 9.2% |
| $200,000+ | 133 | 10.2% |
Household Income by Householder Age in Minden
The median household income in Minden is $87,778, with the highest median household income of $118,906 found in the 45 to 64 years age bracket for the primary householder. A total of 417 households (32.0%) fall into this category. Meanwhile, the 15 to 24 years age bracket for the primary householder has the lowest median household income of $0, with 13 households (1.0%) in this group.
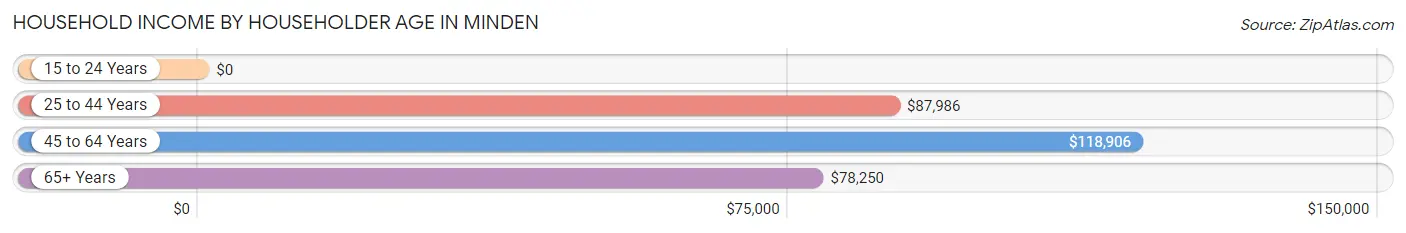
| Income Bracket | # Households | Median Income |
| 15 to 24 Years | 13 (1.0%) | $0 |
| 25 to 44 Years | 281 (21.5%) | $87,986 |
| 45 to 64 Years | 417 (32.0%) | $118,906 |
| 65+ Years | 593 (45.5%) | $78,250 |
| Total | 1,304 (100.0%) | $87,778 |
Poverty in Minden
Income Below Poverty by Sex and Age in Minden
With 8.3% poverty level for males and 10.3% for females among the residents of Minden, 55 to 64 year old males and 15 year old females are the most vulnerable to poverty, with 67 males (27.6%) and 22 females (75.9%) in their respective age groups living below the poverty level.
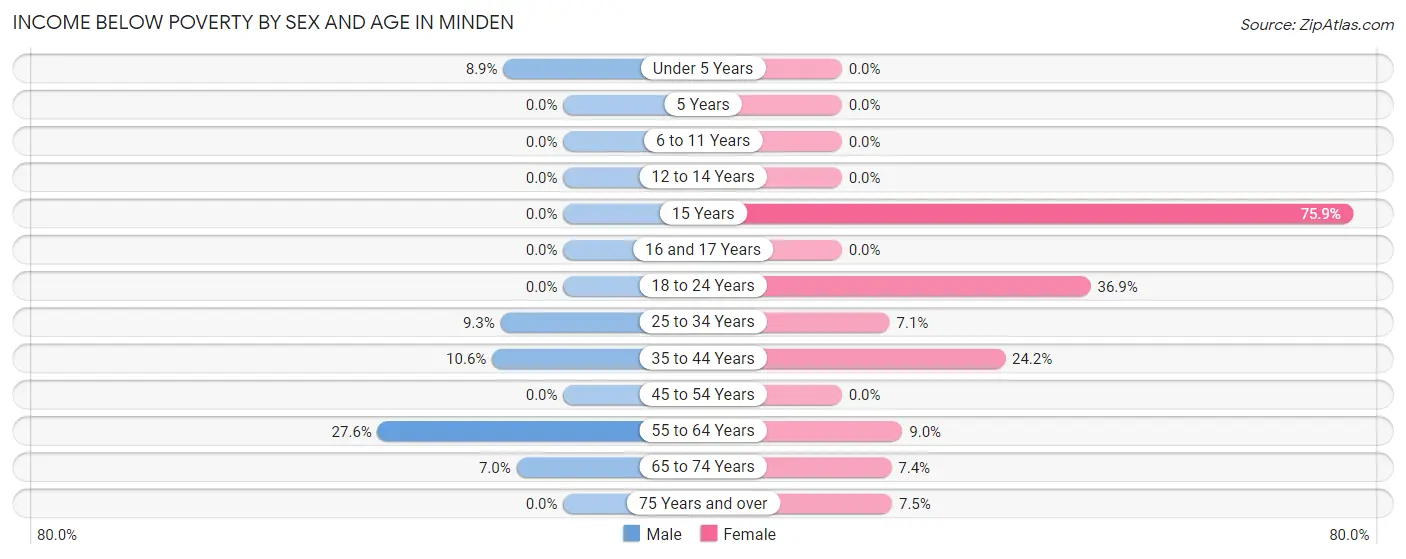
| Age Bracket | Male | Female |
| Under 5 Years | 9 (8.9%) | 0 (0.0%) |
| 5 Years | 0 (0.0%) | 0 (0.0%) |
| 6 to 11 Years | 0 (0.0%) | 0 (0.0%) |
| 12 to 14 Years | 0 (0.0%) | 0 (0.0%) |
| 15 Years | 0 (0.0%) | 22 (75.9%) |
| 16 and 17 Years | 0 (0.0%) | 0 (0.0%) |
| 18 to 24 Years | 0 (0.0%) | 41 (36.9%) |
| 25 to 34 Years | 18 (9.3%) | 12 (7.1%) |
| 35 to 44 Years | 13 (10.6%) | 32 (24.2%) |
| 45 to 54 Years | 0 (0.0%) | 0 (0.0%) |
| 55 to 64 Years | 67 (27.6%) | 24 (9.0%) |
| 65 to 74 Years | 18 (7.0%) | 17 (7.4%) |
| 75 Years and over | 0 (0.0%) | 17 (7.5%) |
| Total | 125 (8.3%) | 165 (10.3%) |
Income Above Poverty by Sex and Age in Minden
According to the poverty statistics in Minden, males aged 5 years and females aged under 5 years are the age groups that are most secure financially, with 100.0% of males and 100.0% of females in these age groups living above the poverty line.
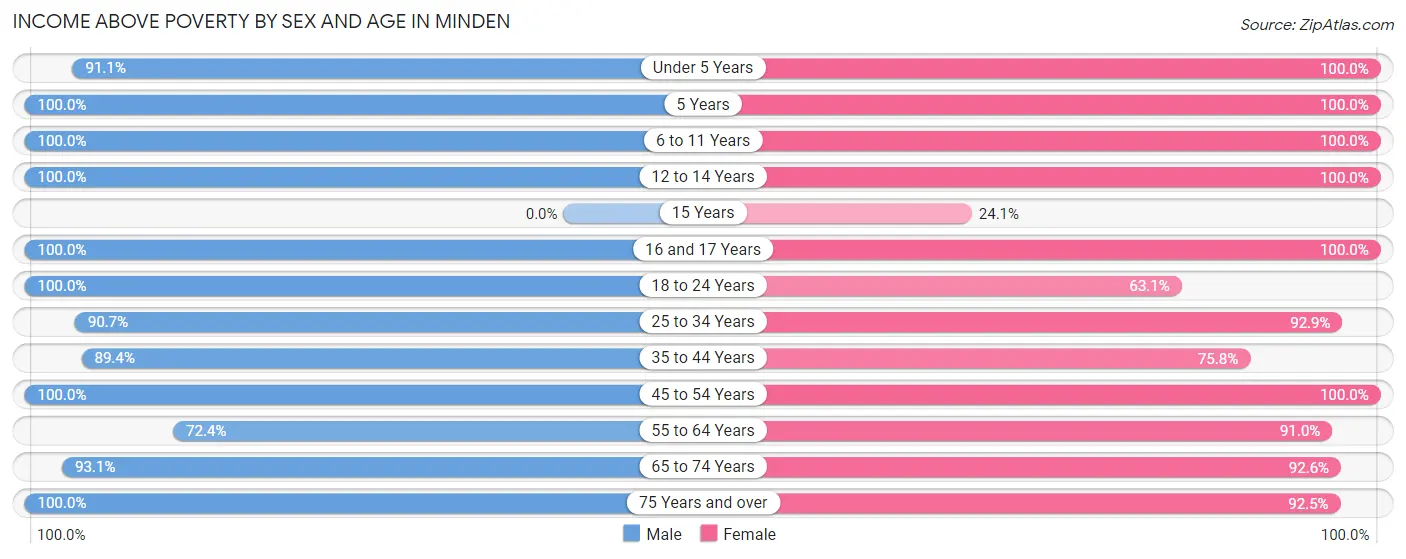
| Age Bracket | Male | Female |
| Under 5 Years | 92 (91.1%) | 124 (100.0%) |
| 5 Years | 30 (100.0%) | 14 (100.0%) |
| 6 to 11 Years | 62 (100.0%) | 41 (100.0%) |
| 12 to 14 Years | 8 (100.0%) | 25 (100.0%) |
| 15 Years | 0 (0.0%) | 7 (24.1%) |
| 16 and 17 Years | 32 (100.0%) | 39 (100.0%) |
| 18 to 24 Years | 26 (100.0%) | 70 (63.1%) |
| 25 to 34 Years | 175 (90.7%) | 157 (92.9%) |
| 35 to 44 Years | 110 (89.4%) | 100 (75.8%) |
| 45 to 54 Years | 224 (100.0%) | 186 (100.0%) |
| 55 to 64 Years | 176 (72.4%) | 243 (91.0%) |
| 65 to 74 Years | 241 (93.0%) | 214 (92.6%) |
| 75 Years and over | 197 (100.0%) | 211 (92.5%) |
| Total | 1,373 (91.7%) | 1,431 (89.7%) |
Income Below Poverty Among Married-Couple Families in Minden
The poverty statistics for married-couple families in Minden show that 5.4% or 44 of the total 815 families live below the poverty line. Families with no children have the highest poverty rate of 7.0%, comprising of 44 families. On the other hand, families with 1 or 2 children have the lowest poverty rate of 0.0%, which includes 0 families.
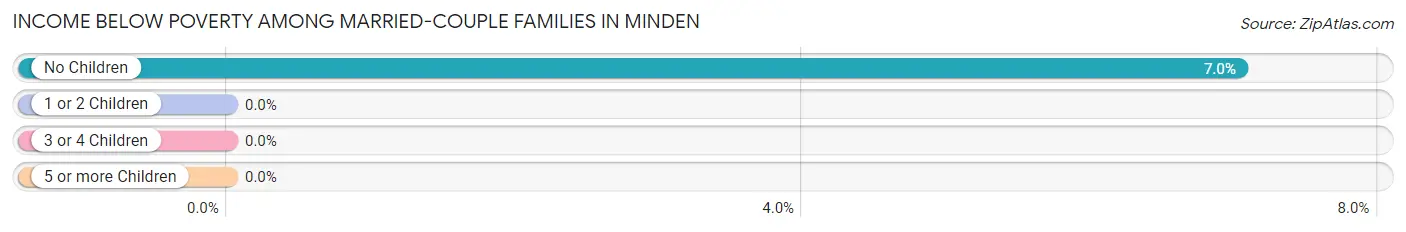
| Children | Above Poverty | Below Poverty |
| No Children | 582 (93.0%) | 44 (7.0%) |
| 1 or 2 Children | 189 (100.0%) | 0 (0.0%) |
| 3 or 4 Children | 0 (0.0%) | 0 (0.0%) |
| 5 or more Children | 0 (0.0%) | 0 (0.0%) |
| Total | 771 (94.6%) | 44 (5.4%) |
Income Below Poverty Among Single-Parent Households in Minden
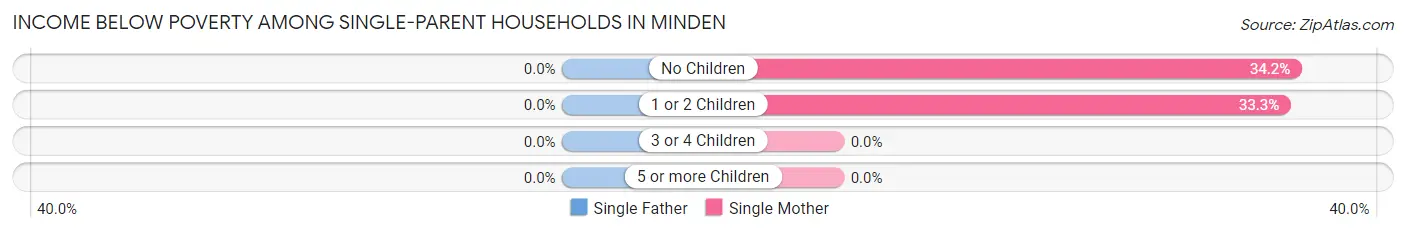
| Children | Single Father | Single Mother |
| No Children | 0 (0.0%) | 14 (34.2%) |
| 1 or 2 Children | 0 (0.0%) | 13 (33.3%) |
| 3 or 4 Children | 0 (0.0%) | 0 (0.0%) |
| 5 or more Children | 0 (0.0%) | 0 (0.0%) |
| Total | 0 (0.0%) | 27 (33.8%) |
Income Below Poverty Among Married-Couple vs Single-Parent Households in Minden
The poverty data for Minden shows that 44 of the married-couple family households (5.4%) and 27 of the single-parent households (25.7%) are living below the poverty level. Within the married-couple family households, those with no children have the highest poverty rate, with 44 households (7.0%) falling below the poverty line. Among the single-parent households, those with no children have the highest poverty rate, with 14 household (27.5%) living below poverty.
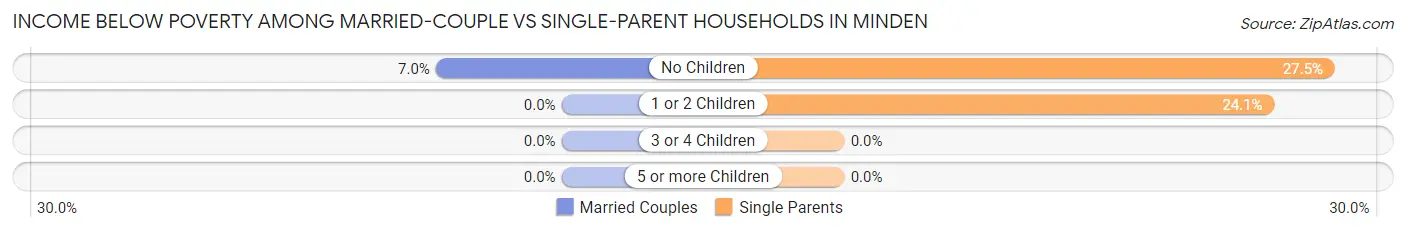
| Children | Married-Couple Families | Single-Parent Households |
| No Children | 44 (7.0%) | 14 (27.5%) |
| 1 or 2 Children | 0 (0.0%) | 13 (24.1%) |
| 3 or 4 Children | 0 (0.0%) | 0 (0.0%) |
| 5 or more Children | 0 (0.0%) | 0 (0.0%) |
| Total | 44 (5.4%) | 27 (25.7%) |
Race in Minden
The most populous races in Minden are White / Caucasian (2,892 | 92.1%), Hispanic or Latino (263 | 8.4%), and Two or more Races (179 | 5.7%).
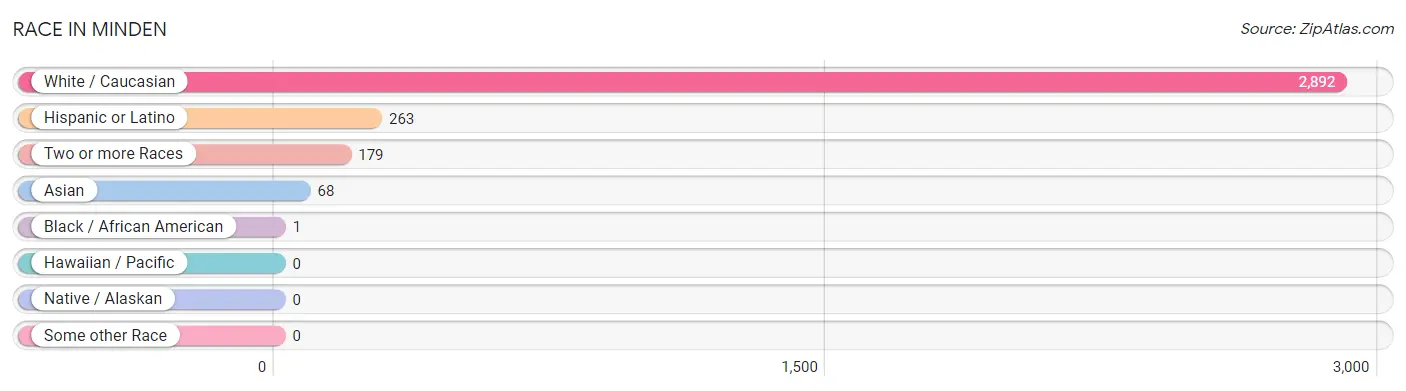
| Race | # Population | % Population |
| Asian | 68 | 2.2% |
| Black / African American | 1 | 0.0% |
| Hawaiian / Pacific | 0 | 0.0% |
| Hispanic or Latino | 263 | 8.4% |
| Native / Alaskan | 0 | 0.0% |
| White / Caucasian | 2,892 | 92.1% |
| Two or more Races | 179 | 5.7% |
| Some other Race | 0 | 0.0% |
| Total | 3,140 | 100.0% |
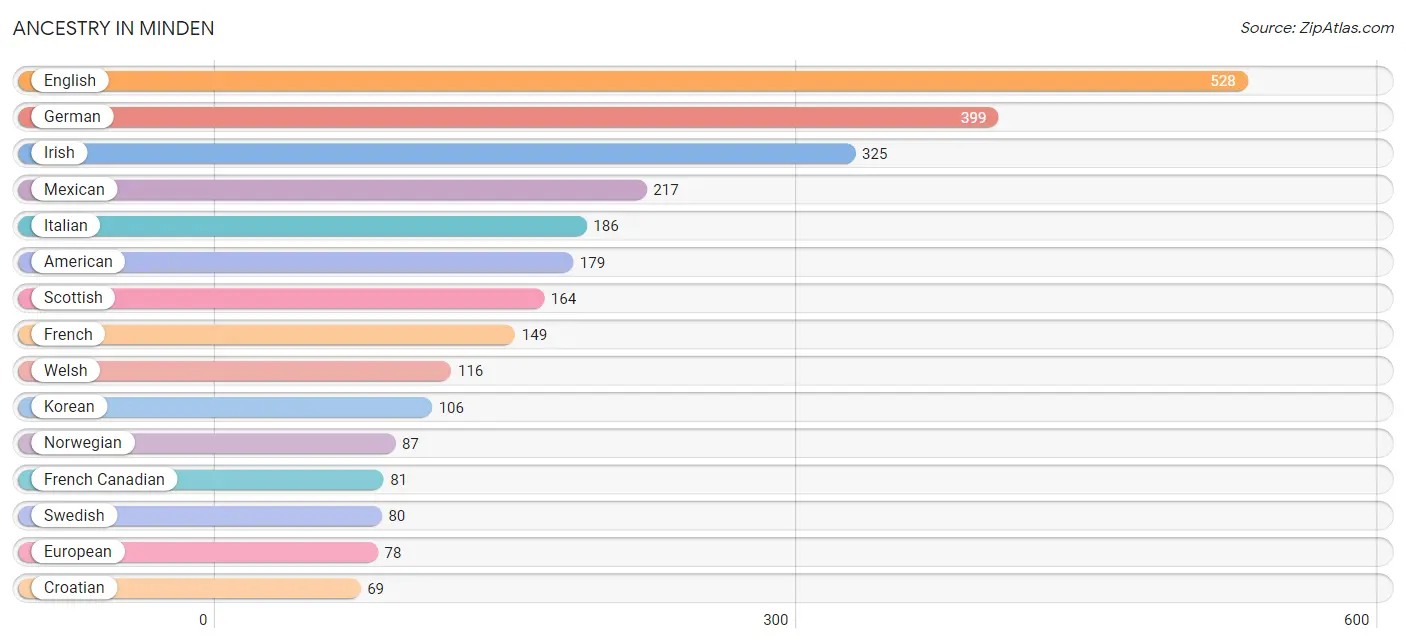
Ancestry in Minden
The most populous ancestries reported in Minden are English (528 | 16.8%), German (399 | 12.7%), Irish (325 | 10.3%), Mexican (217 | 6.9%), and Italian (186 | 5.9%), together accounting for 52.7% of all Minden residents.
| Ancestry | # Population | % Population |
| American | 179 | 5.7% |
| Armenian | 12 | 0.4% |
| Australian | 10 | 0.3% |
| Austrian | 24 | 0.8% |
| Basque | 10 | 0.3% |
| Belgian | 28 | 0.9% |
| Bhutanese | 14 | 0.4% |
| Blackfeet | 11 | 0.4% |
| Brazilian | 17 | 0.5% |
| British | 7 | 0.2% |
| Canadian | 8 | 0.3% |
| Central American | 16 | 0.5% |
| Cherokee | 11 | 0.4% |
| Croatian | 69 | 2.2% |
| Czechoslovakian | 2 | 0.1% |
| Danish | 17 | 0.5% |
| Dutch | 46 | 1.5% |
| English | 528 | 16.8% |
| European | 78 | 2.5% |
| French | 149 | 4.8% |
| French Canadian | 81 | 2.6% |
| German | 399 | 12.7% |
| Greek | 22 | 0.7% |
| Honduran | 16 | 0.5% |
| Hungarian | 11 | 0.4% |
| Irish | 325 | 10.3% |
| Israeli | 17 | 0.5% |
| Italian | 186 | 5.9% |
| Korean | 106 | 3.4% |
| Mexican | 217 | 6.9% |
| Northern European | 18 | 0.6% |
| Norwegian | 87 | 2.8% |
| Polish | 48 | 1.5% |
| Portuguese | 17 | 0.5% |
| Puerto Rican | 30 | 1.0% |
| Russian | 15 | 0.5% |
| Scandinavian | 36 | 1.1% |
| Scotch-Irish | 47 | 1.5% |
| Scottish | 164 | 5.2% |
| Serbian | 22 | 0.7% |
| Slovak | 2 | 0.1% |
| Swedish | 80 | 2.5% |
| Welsh | 116 | 3.7% |
| Yugoslavian | 9 | 0.3% | View All 44 Rows |
Immigrants in Minden
The most numerous immigrant groups reported in Minden came from Canada (54 | 1.7%), Latin America (24 | 0.8%), Australia (19 | 0.6%), Oceania (19 | 0.6%), and Asia (17 | 0.5%), together accounting for 4.2% of all Minden residents.
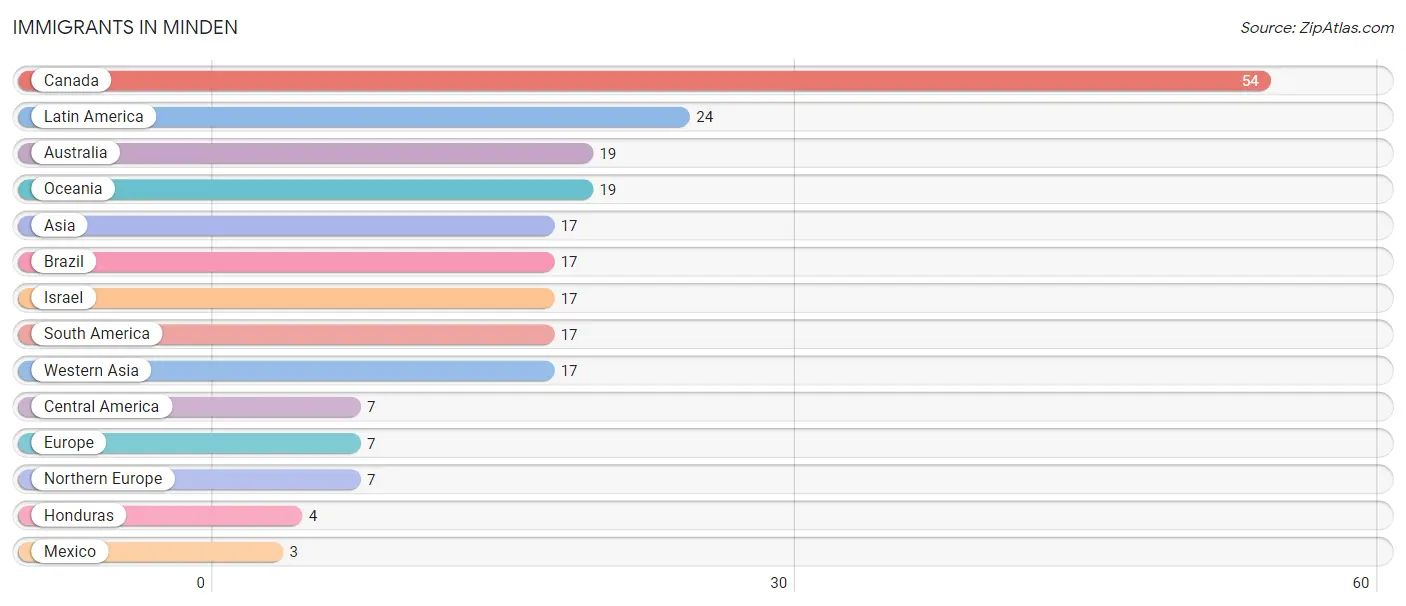
| Immigration Origin | # Population | % Population |
| Asia | 17 | 0.5% |
| Australia | 19 | 0.6% |
| Brazil | 17 | 0.5% |
| Canada | 54 | 1.7% |
| Central America | 7 | 0.2% |
| Europe | 7 | 0.2% |
| Honduras | 4 | 0.1% |
| Israel | 17 | 0.5% |
| Latin America | 24 | 0.8% |
| Mexico | 3 | 0.1% |
| Northern Europe | 7 | 0.2% |
| Oceania | 19 | 0.6% |
| South America | 17 | 0.5% |
| Western Asia | 17 | 0.5% | View All 14 Rows |
Sex and Age in Minden
Sex and Age in Minden
The most populous age groups in Minden are 45 to 49 Years (145 | 9.5%) for men and 60 to 64 Years (216 | 13.4%) for women.
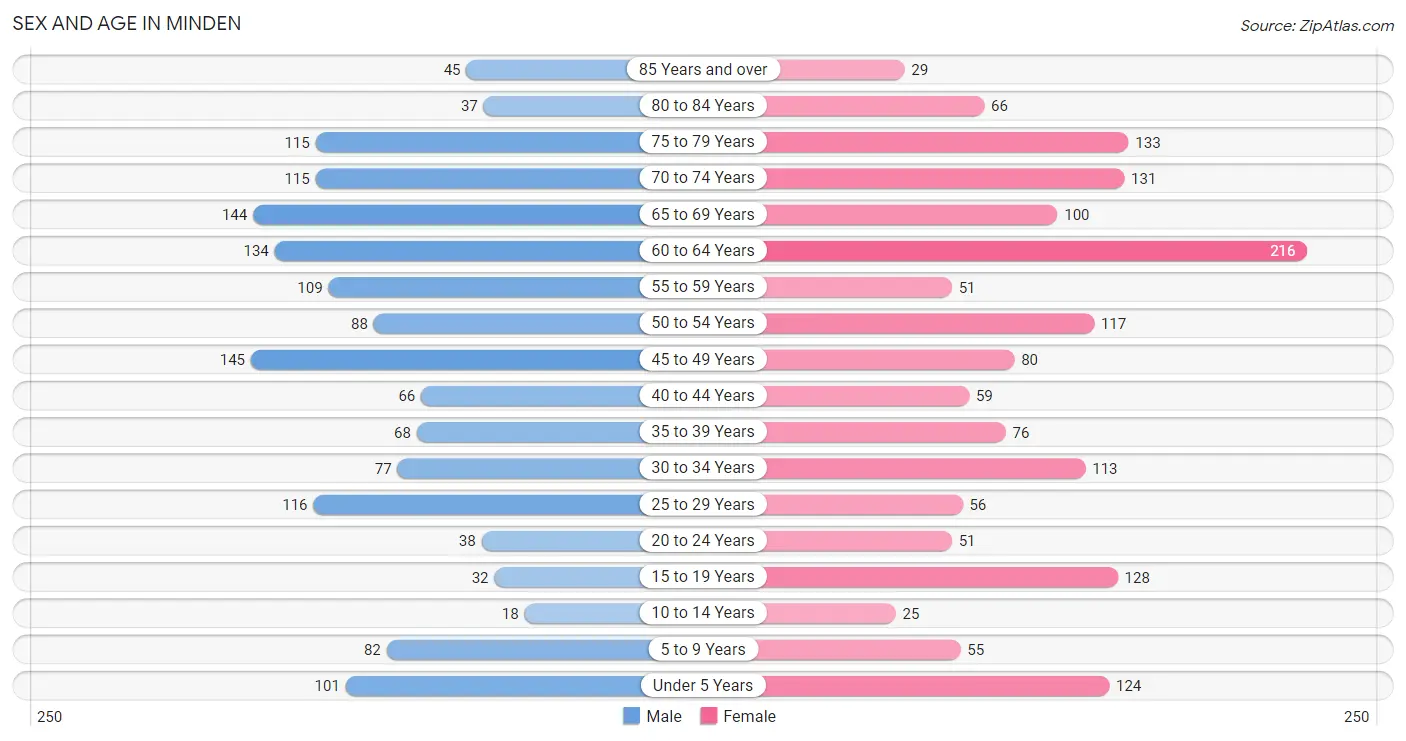
| Age Bracket | Male | Female |
| Under 5 Years | 101 (6.6%) | 124 (7.7%) |
| 5 to 9 Years | 82 (5.4%) | 55 (3.4%) |
| 10 to 14 Years | 18 (1.2%) | 25 (1.5%) |
| 15 to 19 Years | 32 (2.1%) | 128 (8.0%) |
| 20 to 24 Years | 38 (2.5%) | 51 (3.2%) |
| 25 to 29 Years | 116 (7.6%) | 56 (3.5%) |
| 30 to 34 Years | 77 (5.0%) | 113 (7.0%) |
| 35 to 39 Years | 68 (4.4%) | 76 (4.7%) |
| 40 to 44 Years | 66 (4.3%) | 59 (3.7%) |
| 45 to 49 Years | 145 (9.5%) | 80 (5.0%) |
| 50 to 54 Years | 88 (5.8%) | 117 (7.3%) |
| 55 to 59 Years | 109 (7.1%) | 51 (3.2%) |
| 60 to 64 Years | 134 (8.8%) | 216 (13.4%) |
| 65 to 69 Years | 144 (9.4%) | 100 (6.2%) |
| 70 to 74 Years | 115 (7.5%) | 131 (8.1%) |
| 75 to 79 Years | 115 (7.5%) | 133 (8.3%) |
| 80 to 84 Years | 37 (2.4%) | 66 (4.1%) |
| 85 Years and over | 45 (2.9%) | 29 (1.8%) |
| Total | 1,530 (100.0%) | 1,610 (100.0%) |
Families and Households in Minden
Median Family Size in Minden
The median family size in Minden is 2.78 persons per family, with single female/mother families (80 | 8.7%) accounting for the largest median family size of 3.16 persons per family. On the other hand, single male/father families (25 | 2.7%) represent the smallest median family size with 2.16 persons per family.
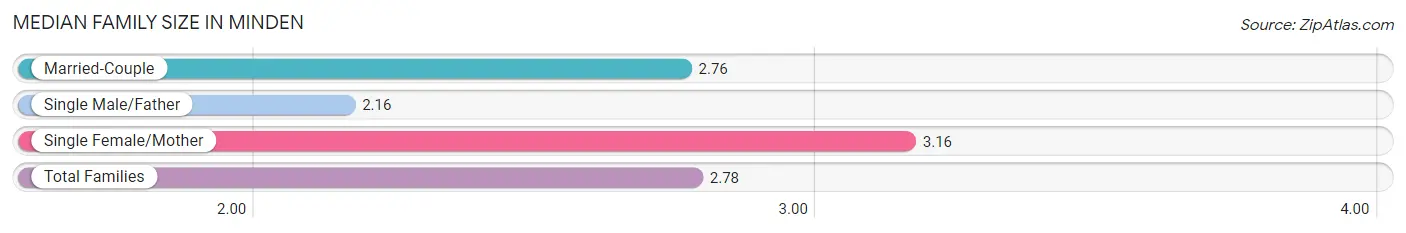
| Family Type | # Families | Family Size |
| Married-Couple | 815 (88.6%) | 2.76 |
| Single Male/Father | 25 (2.7%) | 2.16 |
| Single Female/Mother | 80 (8.7%) | 3.16 |
| Total Families | 920 (100.0%) | 2.78 |
Median Household Size in Minden
The median household size in Minden is 2.37 persons per household, with single male/father households (25 | 1.9%) accounting for the largest median household size of 3.76 persons per household. non-family households (384 | 29.4%) represent the smallest median household size with 1.20 persons per household.
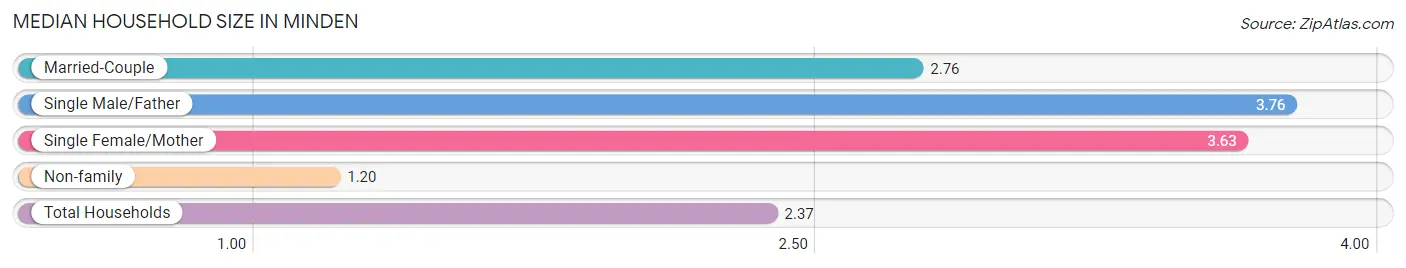
| Household Type | # Households | Household Size |
| Married-Couple | 815 (62.5%) | 2.76 |
| Single Male/Father | 25 (1.9%) | 3.76 |
| Single Female/Mother | 80 (6.1%) | 3.63 |
| Non-family | 384 (29.4%) | 1.20 |
| Total Households | 1,304 (100.0%) | 2.37 |
Household Size by Marriage Status in Minden
Out of a total of 1,304 households in Minden, 920 (70.6%) are family households, while 384 (29.4%) are nonfamily households. The most numerous type of family households are 2-person households, comprising 623, and the most common type of nonfamily households are 1-person households, comprising 325.
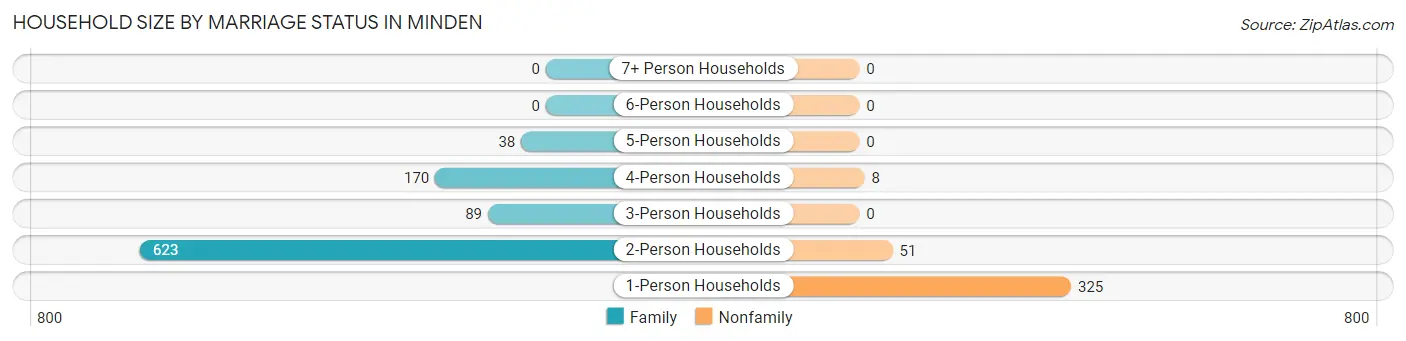
| Household Size | Family Households | Nonfamily Households |
| 1-Person Households | - | 325 (24.9%) |
| 2-Person Households | 623 (47.8%) | 51 (3.9%) |
| 3-Person Households | 89 (6.8%) | 0 (0.0%) |
| 4-Person Households | 170 (13.0%) | 8 (0.6%) |
| 5-Person Households | 38 (2.9%) | 0 (0.0%) |
| 6-Person Households | 0 (0.0%) | 0 (0.0%) |
| 7+ Person Households | 0 (0.0%) | 0 (0.0%) |
| Total | 920 (70.6%) | 384 (29.4%) |
Female Fertility in Minden
Fertility by Age in Minden
Average fertility rate in Minden is 24.0 births per 1,000 women. Women in the age bracket of 20 to 34 years have the highest fertility rate with 68.0 births per 1,000 women. Women in the age bracket of 20 to 34 years acount for 100.0% of all women with births.
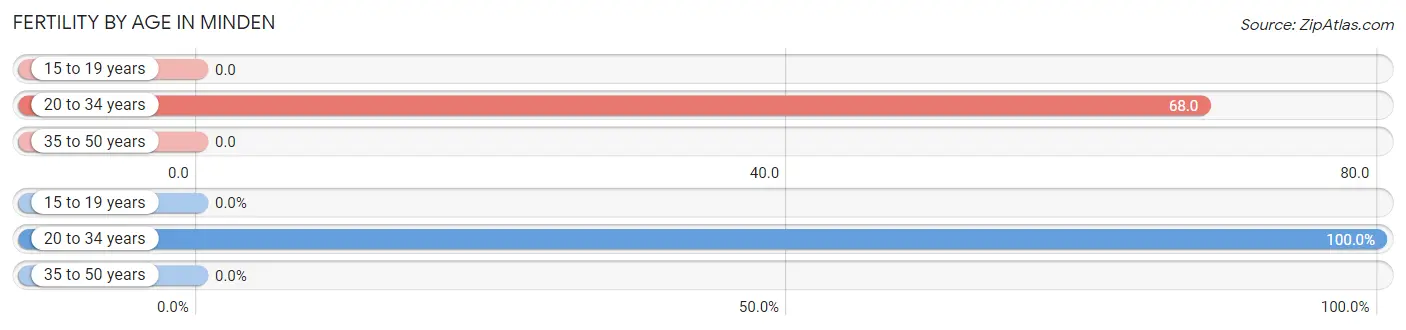
| Age Bracket | Women with Births | Births / 1,000 Women |
| 15 to 19 years | 0 (0.0%) | 0.0 |
| 20 to 34 years | 15 (100.0%) | 68.0 |
| 35 to 50 years | 0 (0.0%) | 0.0 |
| Total | 15 (100.0%) | 24.0 |
Fertility by Age by Marriage Status in Minden
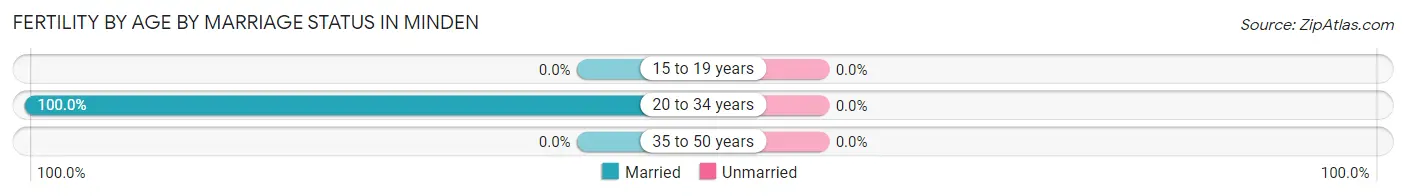
| Age Bracket | Married | Unmarried |
| 15 to 19 years | 0 (0.0%) | 0 (0.0%) |
| 20 to 34 years | 15 (100.0%) | 0 (0.0%) |
| 35 to 50 years | 0 (0.0%) | 0 (0.0%) |
| Total | 15 (100.0%) | 0 (0.0%) |
Fertility by Education in Minden
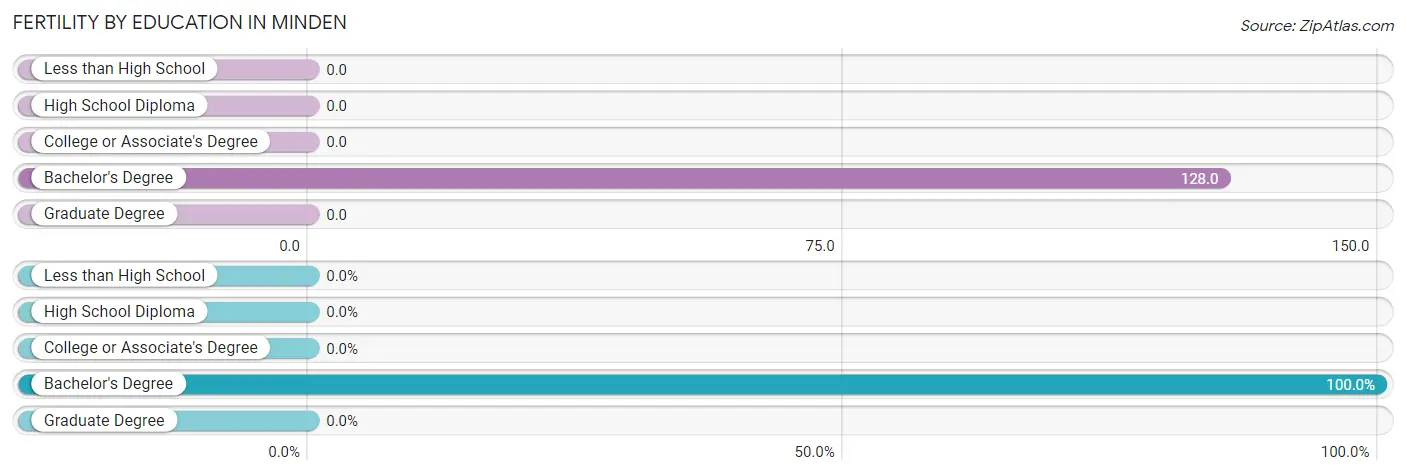
| Educational Attainment | Women with Births | Births / 1,000 Women |
| Less than High School | 0 (0.0%) | 0.0 |
| High School Diploma | 0 (0.0%) | 0.0 |
| College or Associate's Degree | 0 (0.0%) | 0.0 |
| Bachelor's Degree | 15 (100.0%) | 128.0 |
| Graduate Degree | 0 (0.0%) | 0.0 |
| Total | 15 (100.0%) | 24.0 |
Fertility by Education by Marriage Status in Minden
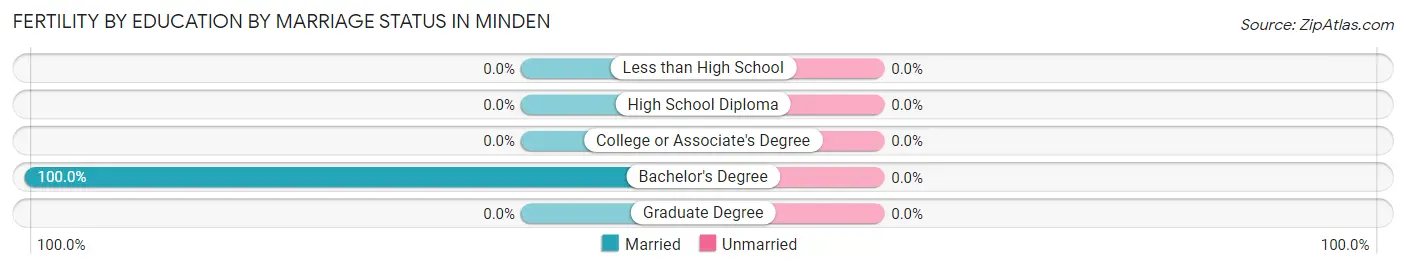
| Educational Attainment | Married | Unmarried |
| Less than High School | 0 (0.0%) | 0 (0.0%) |
| High School Diploma | 0 (0.0%) | 0 (0.0%) |
| College or Associate's Degree | 0 (0.0%) | 0 (0.0%) |
| Bachelor's Degree | 15 (100.0%) | 0 (0.0%) |
| Graduate Degree | 0 (0.0%) | 0 (0.0%) |
| Total | 15 (100.0%) | 0 (0.0%) |
Employment Characteristics in Minden
Employment by Class of Employer in Minden
Among the 1,435 employed individuals in Minden, private company employees (891 | 62.1%), local government employees (316 | 22.0%), and self-employed (not incorporated) (78 | 5.4%) make up the most common classes of employment.
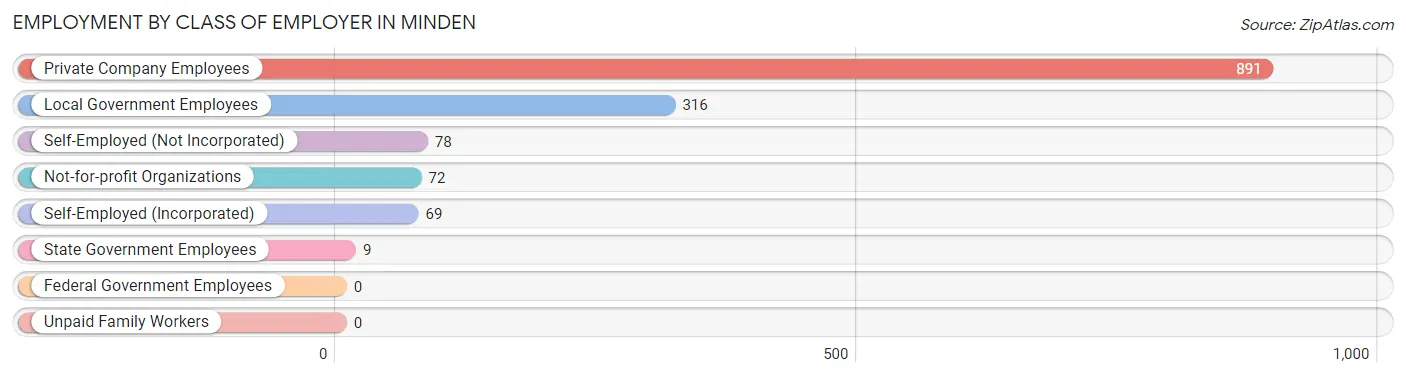
| Employer Class | # Employees | % Employees |
| Private Company Employees | 891 | 62.1% |
| Self-Employed (Incorporated) | 69 | 4.8% |
| Self-Employed (Not Incorporated) | 78 | 5.4% |
| Not-for-profit Organizations | 72 | 5.0% |
| Local Government Employees | 316 | 22.0% |
| State Government Employees | 9 | 0.6% |
| Federal Government Employees | 0 | 0.0% |
| Unpaid Family Workers | 0 | 0.0% |
| Total | 1,435 | 100.0% |
Employment Status by Age in Minden
According to the labor force statistics for Minden, out of the total population over 16 years of age (2,706), 55.1% or 1,491 individuals are in the labor force, with 0.5% or 7 of them unemployed. The age group with the highest labor force participation rate is 16 to 19 years, with 87.8% or 115 individuals in the labor force. Within the labor force, the 60 to 64 years age range has the highest percentage of unemployed individuals, with 3.4% or 8 of them being unemployed.
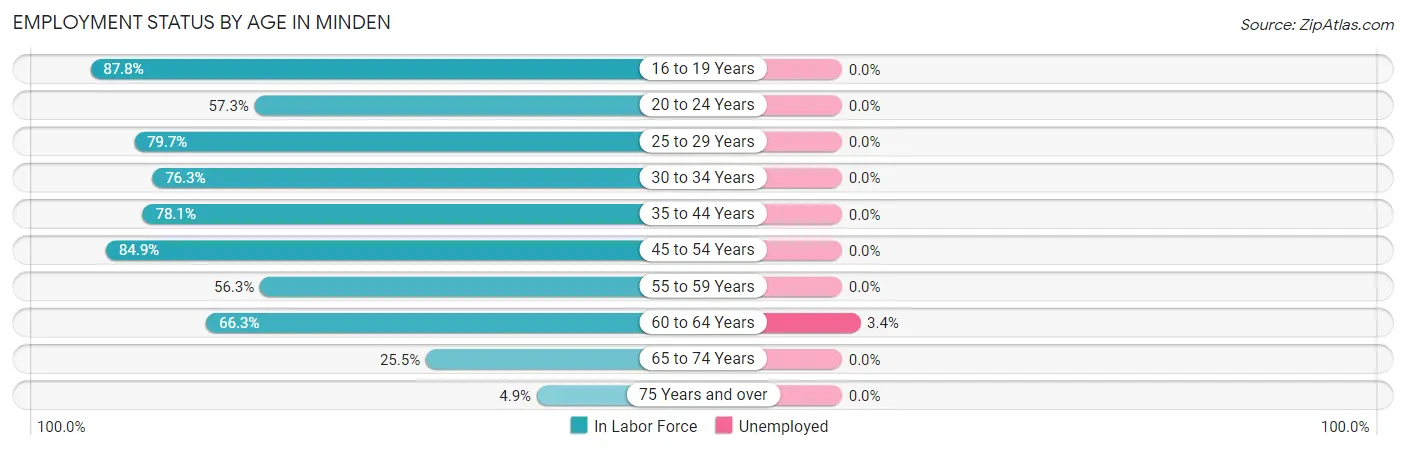
| Age Bracket | In Labor Force | Unemployed |
| 16 to 19 Years | 115 (87.8%) | 0 (0.0%) |
| 20 to 24 Years | 51 (57.3%) | 0 (0.0%) |
| 25 to 29 Years | 137 (79.7%) | 0 (0.0%) |
| 30 to 34 Years | 145 (76.3%) | 0 (0.0%) |
| 35 to 44 Years | 210 (78.1%) | 0 (0.0%) |
| 45 to 54 Years | 365 (84.9%) | 0 (0.0%) |
| 55 to 59 Years | 90 (56.3%) | 0 (0.0%) |
| 60 to 64 Years | 232 (66.3%) | 8 (3.4%) |
| 65 to 74 Years | 125 (25.5%) | 0 (0.0%) |
| 75 Years and over | 21 (4.9%) | 0 (0.0%) |
| Total | 1,491 (55.1%) | 7 (0.5%) |
Employment Status by Educational Attainment in Minden
According to labor force statistics for Minden, 75.0% of individuals (1,178) out of the total population between 25 and 64 years of age (1,571) are in the labor force, with 0.7% or 8 of them being unemployed. The group with the highest labor force participation rate are those with the educational attainment of bachelor's degree or higher, with 80.9% or 456 individuals in the labor force. Within the labor force, individuals with college / associate degree education have the highest percentage of unemployment, with 1.8% or 8 of them being unemployed.
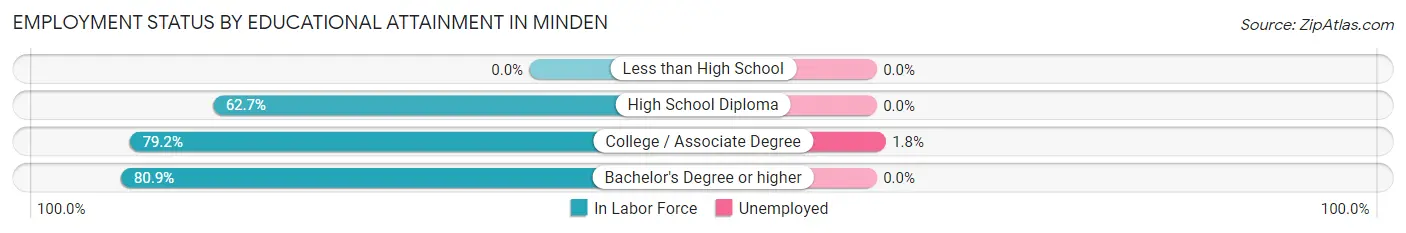
| Educational Attainment | In Labor Force | Unemployed |
| Less than High School | 0 (0.0%) | 0 (0.0%) |
| High School Diploma | 274 (62.7%) | 0 (0.0%) |
| College / Associate Degree | 449 (79.2%) | 10 (1.8%) |
| Bachelor's Degree or higher | 456 (80.9%) | 0 (0.0%) |
| Total | 1,178 (75.0%) | 11 (0.7%) |
Employment Occupations by Sex in Minden
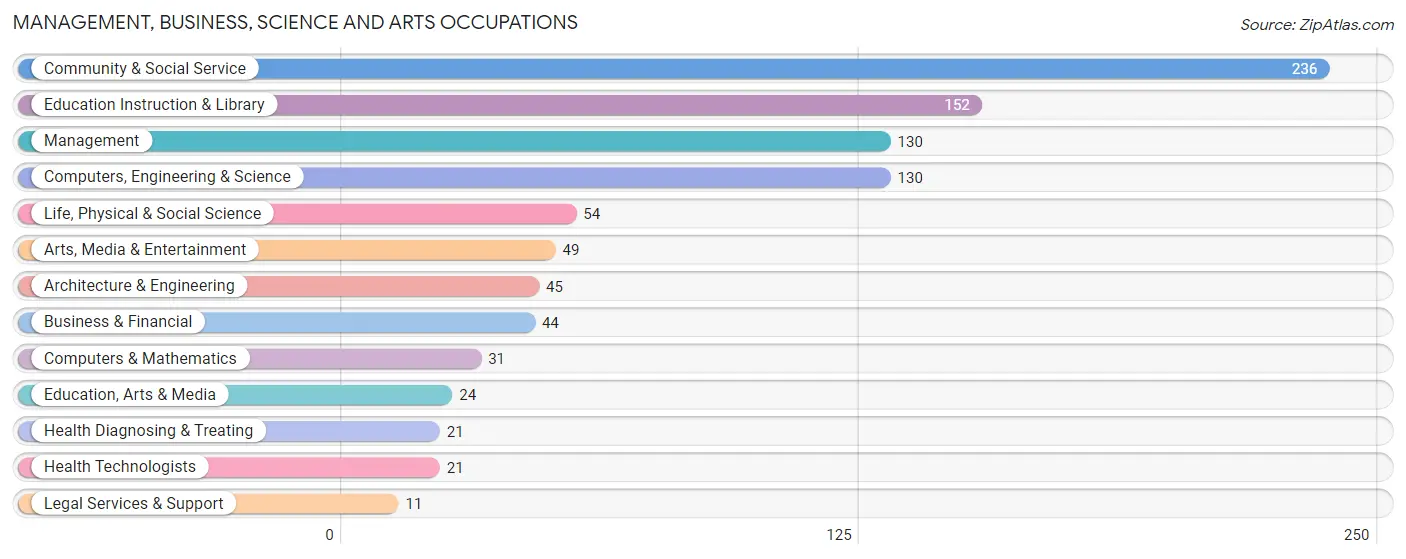
Management, Business, Science and Arts Occupations
The most common Management, Business, Science and Arts occupations in Minden are Community & Social Service (236 | 15.9%), Education Instruction & Library (152 | 10.2%), Management (130 | 8.8%), Computers, Engineering & Science (130 | 8.8%), and Life, Physical & Social Science (54 | 3.6%).
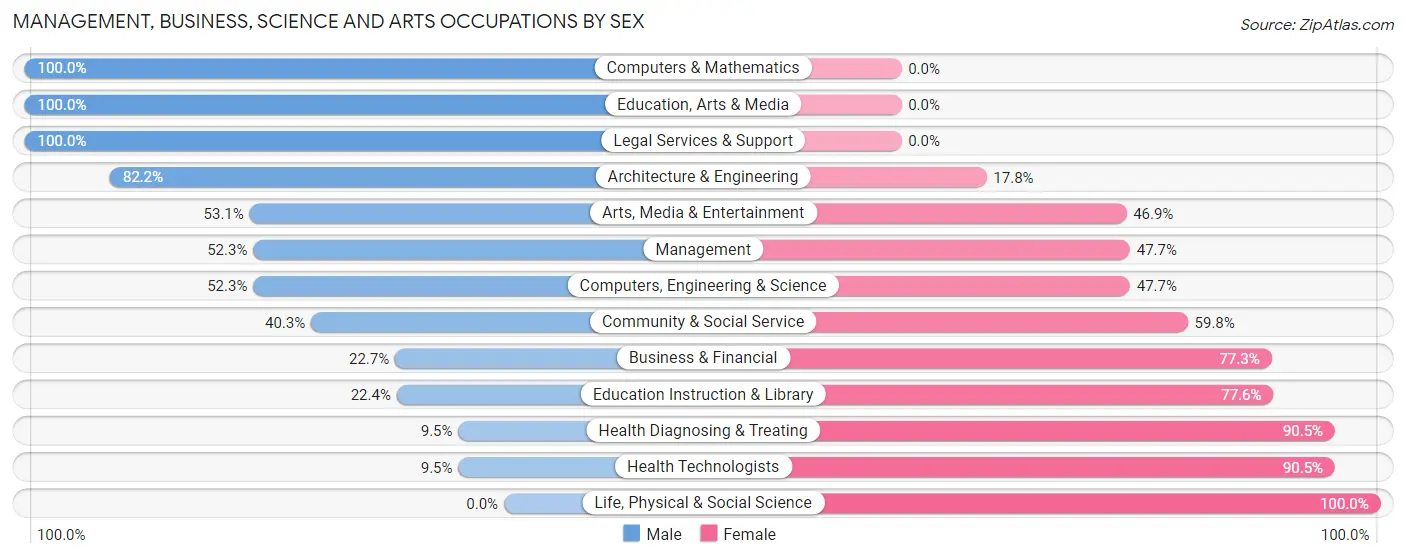
Management, Business, Science and Arts Occupations by Sex
Within the Management, Business, Science and Arts occupations in Minden, the most male-oriented occupations are Computers & Mathematics (100.0%), Education, Arts & Media (100.0%), and Legal Services & Support (100.0%), while the most female-oriented occupations are Life, Physical & Social Science (100.0%), Health Diagnosing & Treating (90.5%), and Health Technologists (90.5%).
| Occupation | Male | Female |
| Management | 68 (52.3%) | 62 (47.7%) |
| Business & Financial | 10 (22.7%) | 34 (77.3%) |
| Computers, Engineering & Science | 68 (52.3%) | 62 (47.7%) |
| Computers & Mathematics | 31 (100.0%) | 0 (0.0%) |
| Architecture & Engineering | 37 (82.2%) | 8 (17.8%) |
| Life, Physical & Social Science | 0 (0.0%) | 54 (100.0%) |
| Community & Social Service | 95 (40.3%) | 141 (59.8%) |
| Education, Arts & Media | 24 (100.0%) | 0 (0.0%) |
| Legal Services & Support | 11 (100.0%) | 0 (0.0%) |
| Education Instruction & Library | 34 (22.4%) | 118 (77.6%) |
| Arts, Media & Entertainment | 26 (53.1%) | 23 (46.9%) |
| Health Diagnosing & Treating | 2 (9.5%) | 19 (90.5%) |
| Health Technologists | 2 (9.5%) | 19 (90.5%) |
| Total (Category) | 243 (43.3%) | 318 (56.7%) |
| Total (Overall) | 771 (52.0%) | 712 (48.0%) |
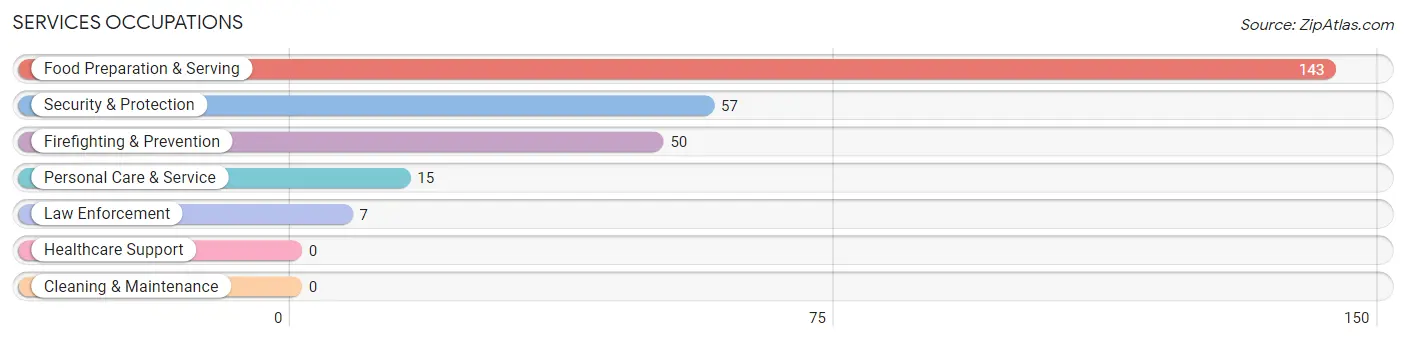
Services Occupations
The most common Services occupations in Minden are Food Preparation & Serving (143 | 9.6%), Security & Protection (57 | 3.8%), Firefighting & Prevention (50 | 3.4%), Personal Care & Service (15 | 1.0%), and Law Enforcement (7 | 0.5%).
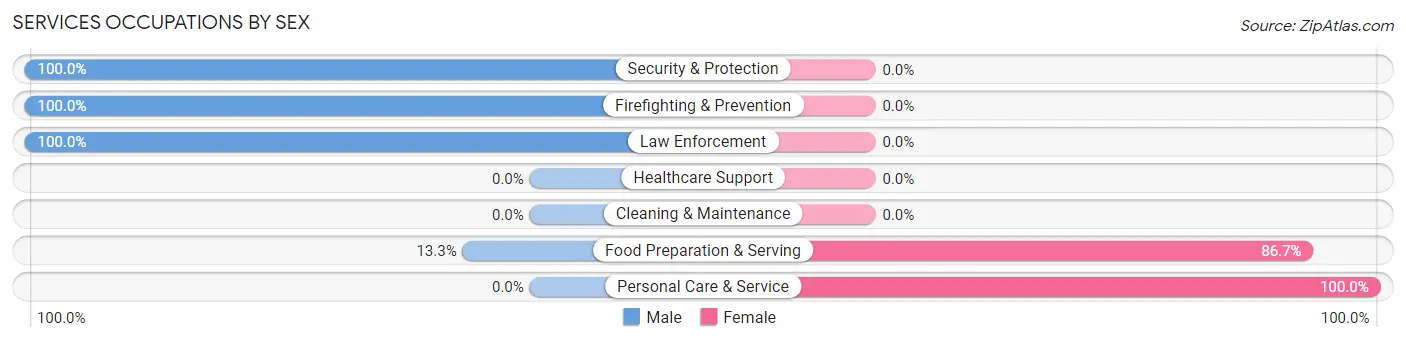
Services Occupations by Sex
Within the Services occupations in Minden, the most male-oriented occupations are Security & Protection (100.0%), Firefighting & Prevention (100.0%), and Law Enforcement (100.0%), while the most female-oriented occupations are Personal Care & Service (100.0%), and Food Preparation & Serving (86.7%).
| Occupation | Male | Female |
| Healthcare Support | 0 (0.0%) | 0 (0.0%) |
| Security & Protection | 57 (100.0%) | 0 (0.0%) |
| Firefighting & Prevention | 50 (100.0%) | 0 (0.0%) |
| Law Enforcement | 7 (100.0%) | 0 (0.0%) |
| Food Preparation & Serving | 19 (13.3%) | 124 (86.7%) |
| Cleaning & Maintenance | 0 (0.0%) | 0 (0.0%) |
| Personal Care & Service | 0 (0.0%) | 15 (100.0%) |
| Total (Category) | 76 (35.3%) | 139 (64.6%) |
| Total (Overall) | 771 (52.0%) | 712 (48.0%) |
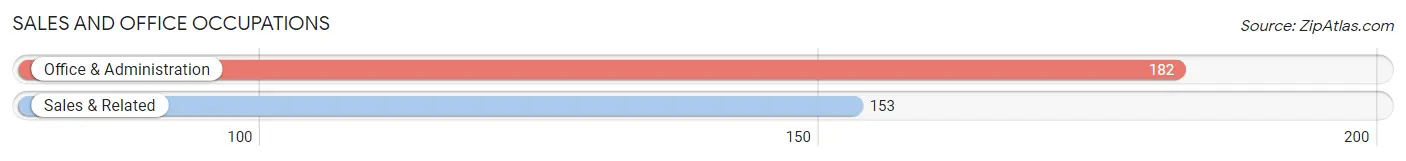
Sales and Office Occupations
The most common Sales and Office occupations in Minden are Office & Administration (182 | 12.3%), and Sales & Related (153 | 10.3%).
Sales and Office Occupations by Sex
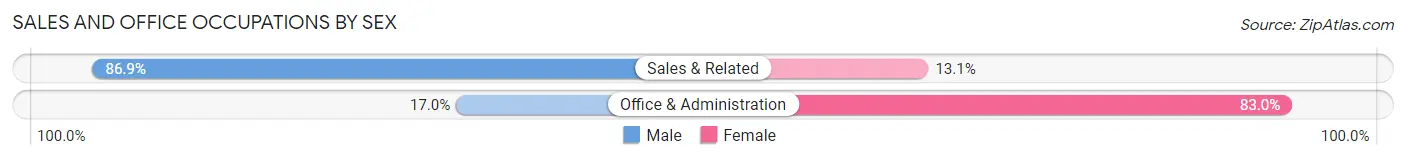
| Occupation | Male | Female |
| Sales & Related | 133 (86.9%) | 20 (13.1%) |
| Office & Administration | 31 (17.0%) | 151 (83.0%) |
| Total (Category) | 164 (49.0%) | 171 (51.0%) |
| Total (Overall) | 771 (52.0%) | 712 (48.0%) |
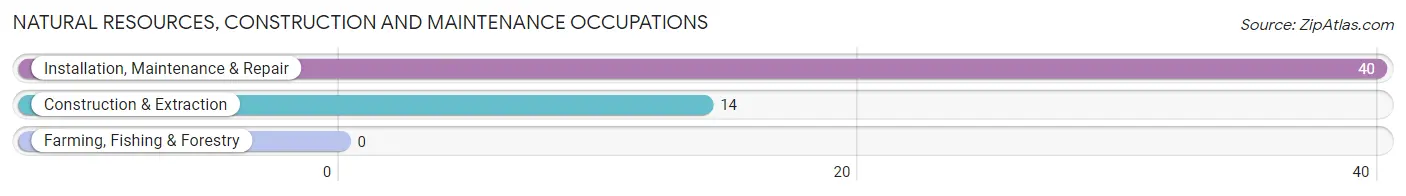
Natural Resources, Construction and Maintenance Occupations
The most common Natural Resources, Construction and Maintenance occupations in Minden are Installation, Maintenance & Repair (40 | 2.7%), and Construction & Extraction (14 | 0.9%).
Natural Resources, Construction and Maintenance Occupations by Sex
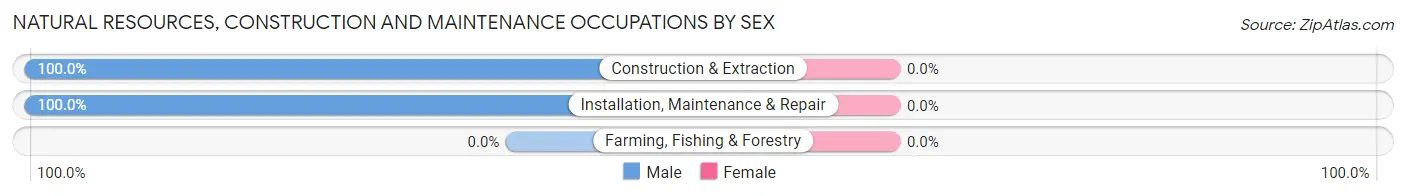
| Occupation | Male | Female |
| Farming, Fishing & Forestry | 0 (0.0%) | 0 (0.0%) |
| Construction & Extraction | 14 (100.0%) | 0 (0.0%) |
| Installation, Maintenance & Repair | 40 (100.0%) | 0 (0.0%) |
| Total (Category) | 54 (100.0%) | 0 (0.0%) |
| Total (Overall) | 771 (52.0%) | 712 (48.0%) |
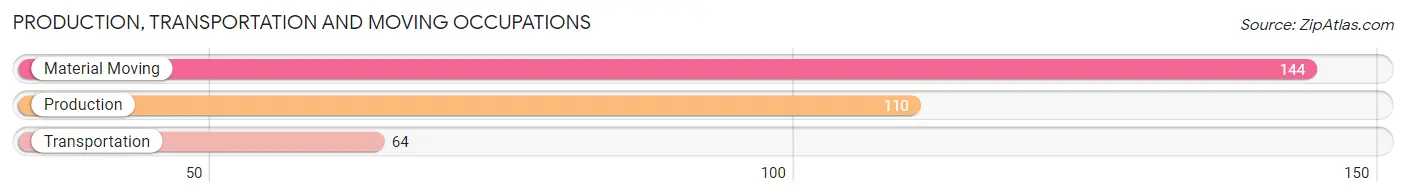
Production, Transportation and Moving Occupations
The most common Production, Transportation and Moving occupations in Minden are Material Moving (144 | 9.7%), Production (110 | 7.4%), and Transportation (64 | 4.3%).
Production, Transportation and Moving Occupations by Sex
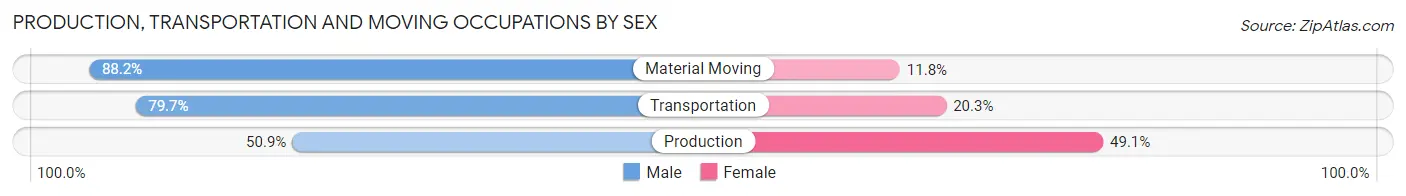
| Occupation | Male | Female |
| Production | 56 (50.9%) | 54 (49.1%) |
| Transportation | 51 (79.7%) | 13 (20.3%) |
| Material Moving | 127 (88.2%) | 17 (11.8%) |
| Total (Category) | 234 (73.6%) | 84 (26.4%) |
| Total (Overall) | 771 (52.0%) | 712 (48.0%) |
Employment Industries by Sex in Minden
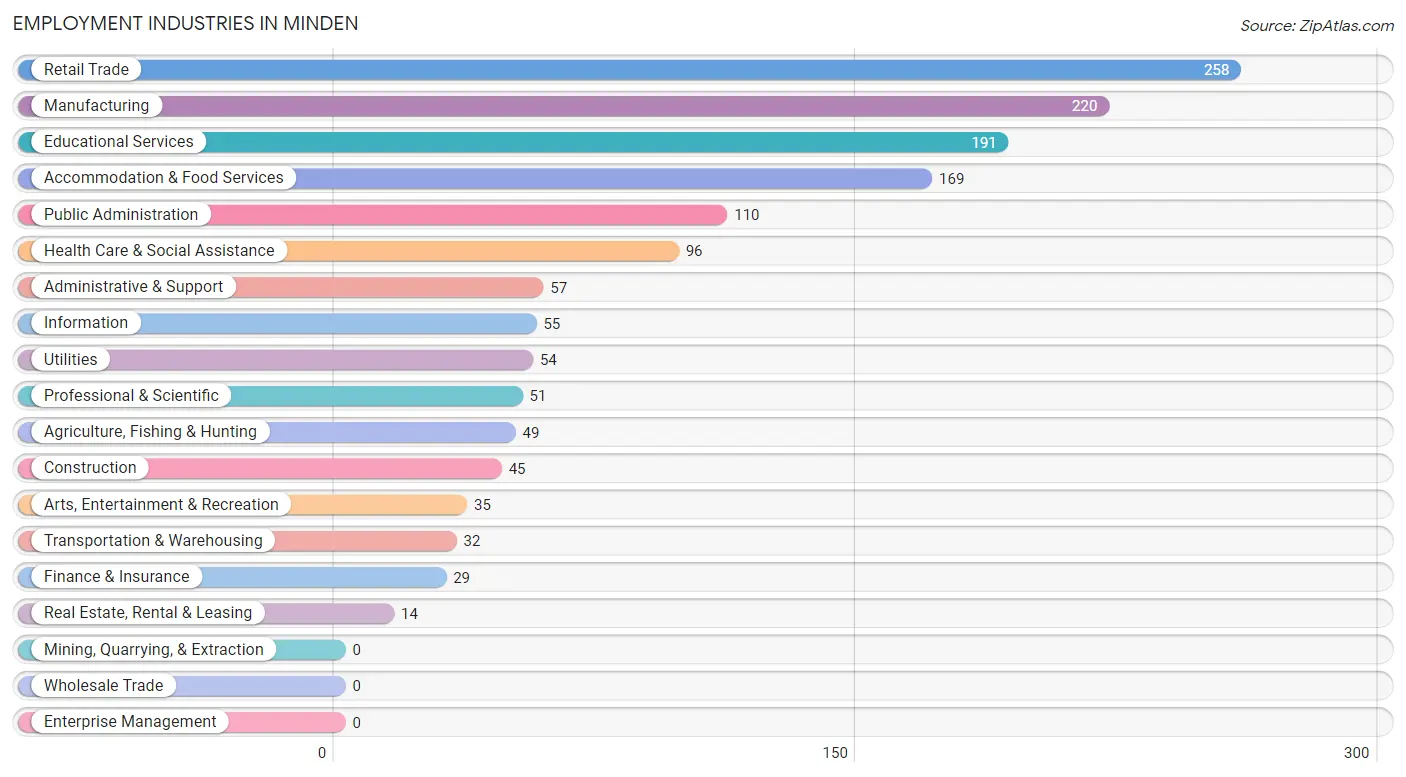
Employment Industries in Minden
The major employment industries in Minden include Retail Trade (258 | 17.4%), Manufacturing (220 | 14.8%), Educational Services (191 | 12.9%), Accommodation & Food Services (169 | 11.4%), and Public Administration (110 | 7.4%).
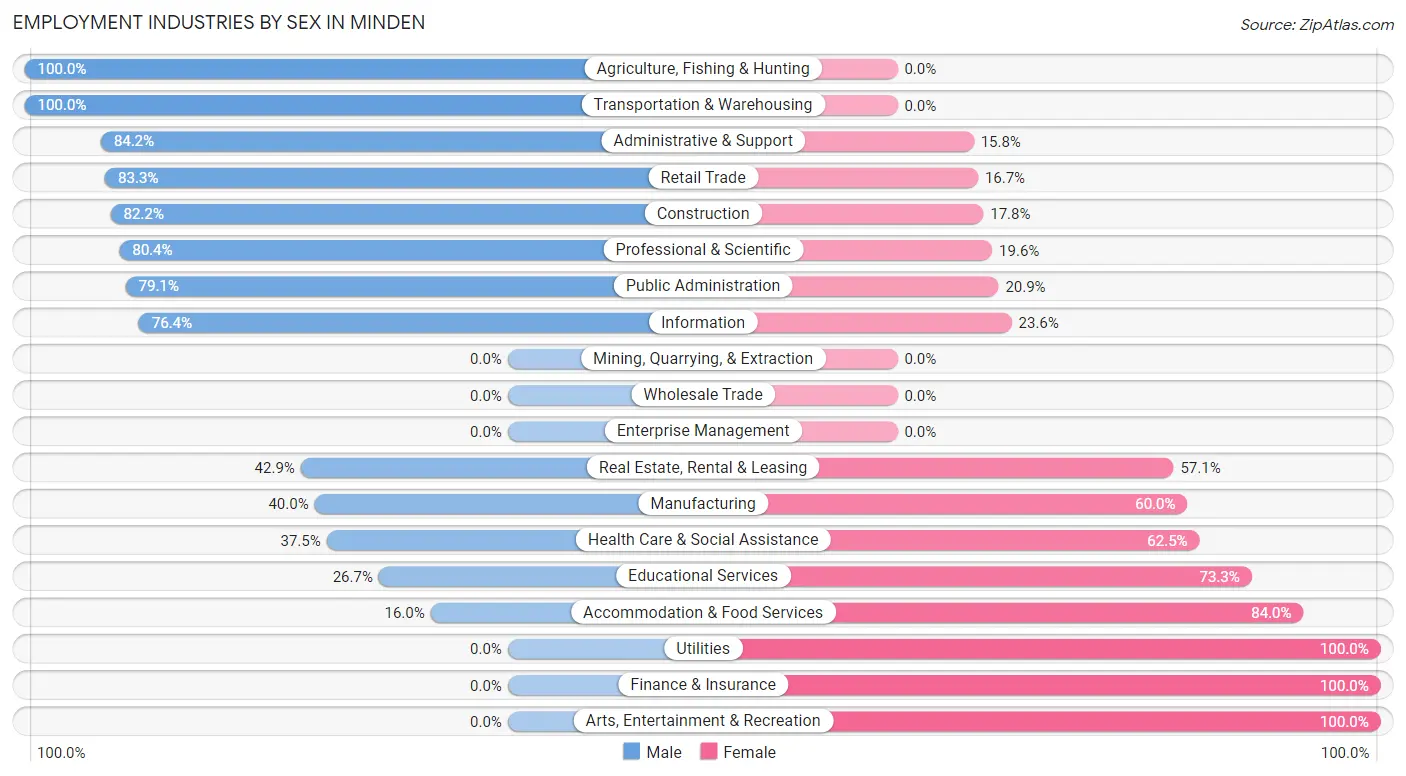
Employment Industries by Sex in Minden
The Minden industries that see more men than women are Agriculture, Fishing & Hunting (100.0%), Transportation & Warehousing (100.0%), and Administrative & Support (84.2%), whereas the industries that tend to have a higher number of women are Utilities (100.0%), Finance & Insurance (100.0%), and Arts, Entertainment & Recreation (100.0%).
| Industry | Male | Female |
| Agriculture, Fishing & Hunting | 49 (100.0%) | 0 (0.0%) |
| Mining, Quarrying, & Extraction | 0 (0.0%) | 0 (0.0%) |
| Construction | 37 (82.2%) | 8 (17.8%) |
| Manufacturing | 88 (40.0%) | 132 (60.0%) |
| Wholesale Trade | 0 (0.0%) | 0 (0.0%) |
| Retail Trade | 215 (83.3%) | 43 (16.7%) |
| Transportation & Warehousing | 32 (100.0%) | 0 (0.0%) |
| Utilities | 0 (0.0%) | 54 (100.0%) |
| Information | 42 (76.4%) | 13 (23.6%) |
| Finance & Insurance | 0 (0.0%) | 29 (100.0%) |
| Real Estate, Rental & Leasing | 6 (42.9%) | 8 (57.1%) |
| Professional & Scientific | 41 (80.4%) | 10 (19.6%) |
| Enterprise Management | 0 (0.0%) | 0 (0.0%) |
| Administrative & Support | 48 (84.2%) | 9 (15.8%) |
| Educational Services | 51 (26.7%) | 140 (73.3%) |
| Health Care & Social Assistance | 36 (37.5%) | 60 (62.5%) |
| Arts, Entertainment & Recreation | 0 (0.0%) | 35 (100.0%) |
| Accommodation & Food Services | 27 (16.0%) | 142 (84.0%) |
| Public Administration | 87 (79.1%) | 23 (20.9%) |
| Total | 771 (52.0%) | 712 (48.0%) |
Education in Minden
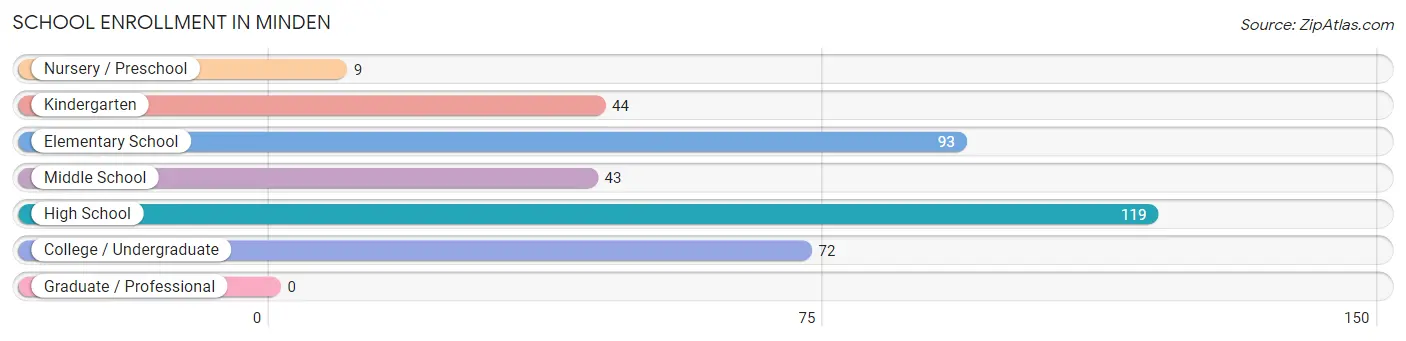
School Enrollment in Minden
The most common levels of schooling among the 380 students in Minden are high school (119 | 31.3%), elementary school (93 | 24.5%), and college / undergraduate (72 | 19.0%).
| School Level | # Students | % Students |
| Nursery / Preschool | 9 | 2.4% |
| Kindergarten | 44 | 11.6% |
| Elementary School | 93 | 24.5% |
| Middle School | 43 | 11.3% |
| High School | 119 | 31.3% |
| College / Undergraduate | 72 | 19.0% |
| Graduate / Professional | 0 | 0.0% |
| Total | 380 | 100.0% |
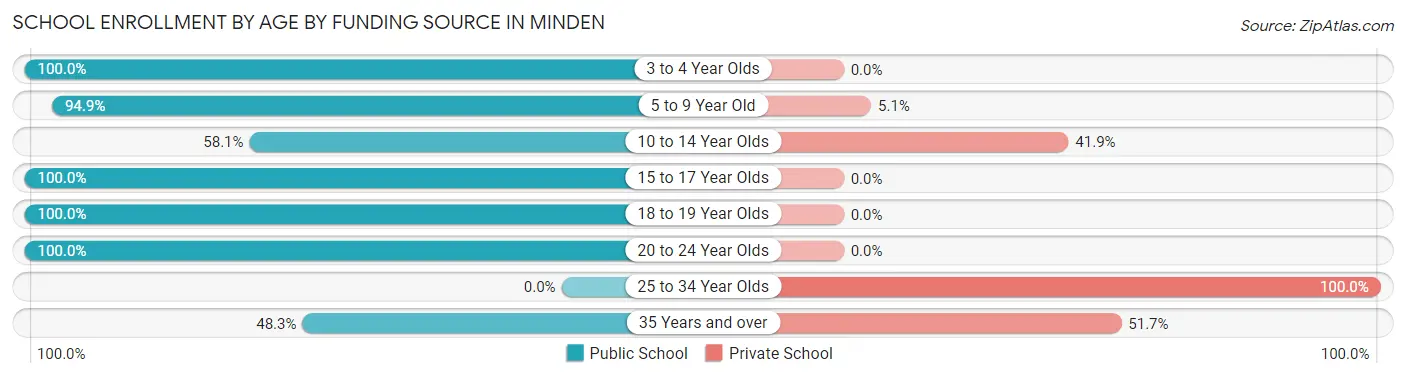
School Enrollment by Age by Funding Source in Minden
Out of a total of 380 students who are enrolled in schools in Minden, 51 (13.4%) attend a private institution, while the remaining 329 (86.6%) are enrolled in public schools. The age group of 25 to 34 year olds has the highest likelihood of being enrolled in private schools, with 11 (100.0% in the age bracket) enrolled. Conversely, the age group of 3 to 4 year olds has the lowest likelihood of being enrolled in a private school, with 9 (100.0% in the age bracket) attending a public institution.
| Age Bracket | Public School | Private School |
| 3 to 4 Year Olds | 9 (100.0%) | 0 (0.0%) |
| 5 to 9 Year Old | 130 (94.9%) | 7 (5.1%) |
| 10 to 14 Year Olds | 25 (58.1%) | 18 (41.9%) |
| 15 to 17 Year Olds | 100 (100.0%) | 0 (0.0%) |
| 18 to 19 Year Olds | 38 (100.0%) | 0 (0.0%) |
| 20 to 24 Year Olds | 13 (100.0%) | 0 (0.0%) |
| 25 to 34 Year Olds | 0 (0.0%) | 11 (100.0%) |
| 35 Years and over | 14 (48.3%) | 15 (51.7%) |
| Total | 329 (86.6%) | 51 (13.4%) |
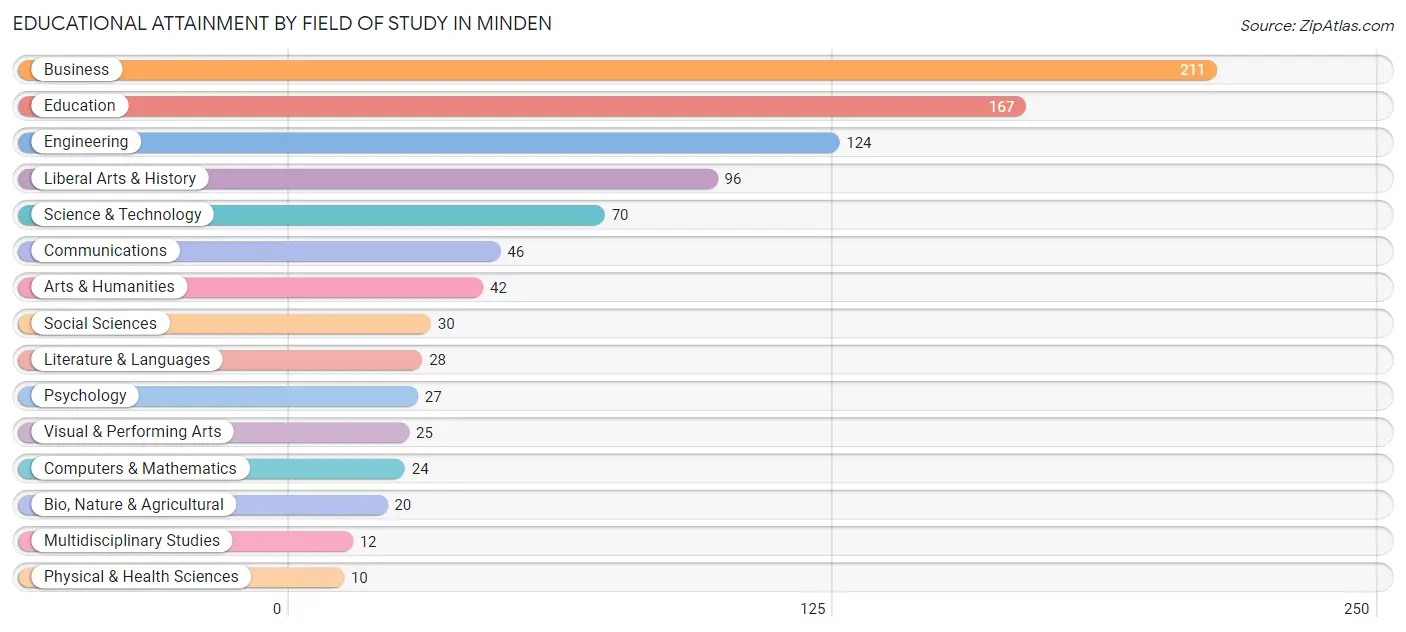
Educational Attainment by Field of Study in Minden
Business (211 | 22.6%), education (167 | 17.9%), engineering (124 | 13.3%), liberal arts & history (96 | 10.3%), and science & technology (70 | 7.5%) are the most common fields of study among 932 individuals in Minden who have obtained a bachelor's degree or higher.
| Field of Study | # Graduates | % Graduates |
| Computers & Mathematics | 24 | 2.6% |
| Bio, Nature & Agricultural | 20 | 2.1% |
| Physical & Health Sciences | 10 | 1.1% |
| Psychology | 27 | 2.9% |
| Social Sciences | 30 | 3.2% |
| Engineering | 124 | 13.3% |
| Multidisciplinary Studies | 12 | 1.3% |
| Science & Technology | 70 | 7.5% |
| Business | 211 | 22.6% |
| Education | 167 | 17.9% |
| Literature & Languages | 28 | 3.0% |
| Liberal Arts & History | 96 | 10.3% |
| Visual & Performing Arts | 25 | 2.7% |
| Communications | 46 | 4.9% |
| Arts & Humanities | 42 | 4.5% |
| Total | 932 | 100.0% |
Transportation & Commute in Minden
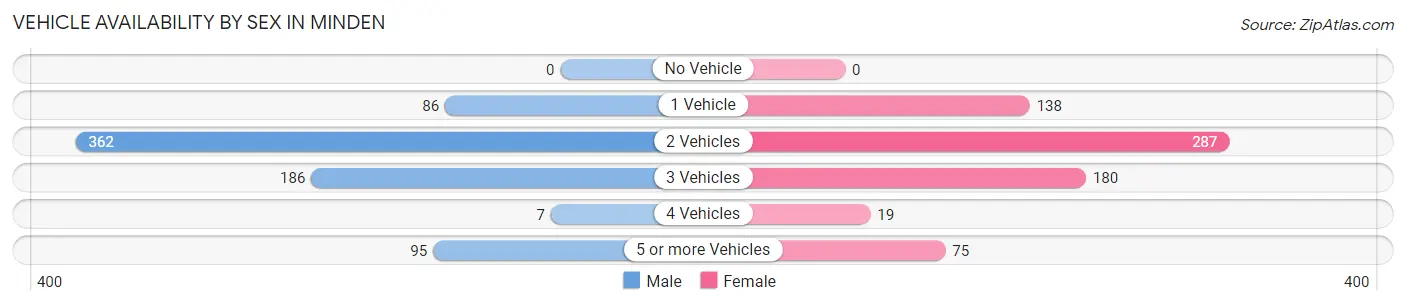
Vehicle Availability by Sex in Minden
The most prevalent vehicle ownership categories in Minden are males with 2 vehicles (362, accounting for 49.2%) and females with 2 vehicles (287, making up 51.8%).
| Vehicles Available | Male | Female |
| No Vehicle | 0 (0.0%) | 0 (0.0%) |
| 1 Vehicle | 86 (11.7%) | 138 (19.7%) |
| 2 Vehicles | 362 (49.2%) | 287 (41.1%) |
| 3 Vehicles | 186 (25.3%) | 180 (25.8%) |
| 4 Vehicles | 7 (0.9%) | 19 (2.7%) |
| 5 or more Vehicles | 95 (12.9%) | 75 (10.7%) |
| Total | 736 (100.0%) | 699 (100.0%) |
Commute Time in Minden
The most frequently occuring commute durations in Minden are 5 to 9 minutes (351 commuters, 26.9%), less than 5 minutes (177 commuters, 13.6%), and 15 to 19 minutes (176 commuters, 13.5%).
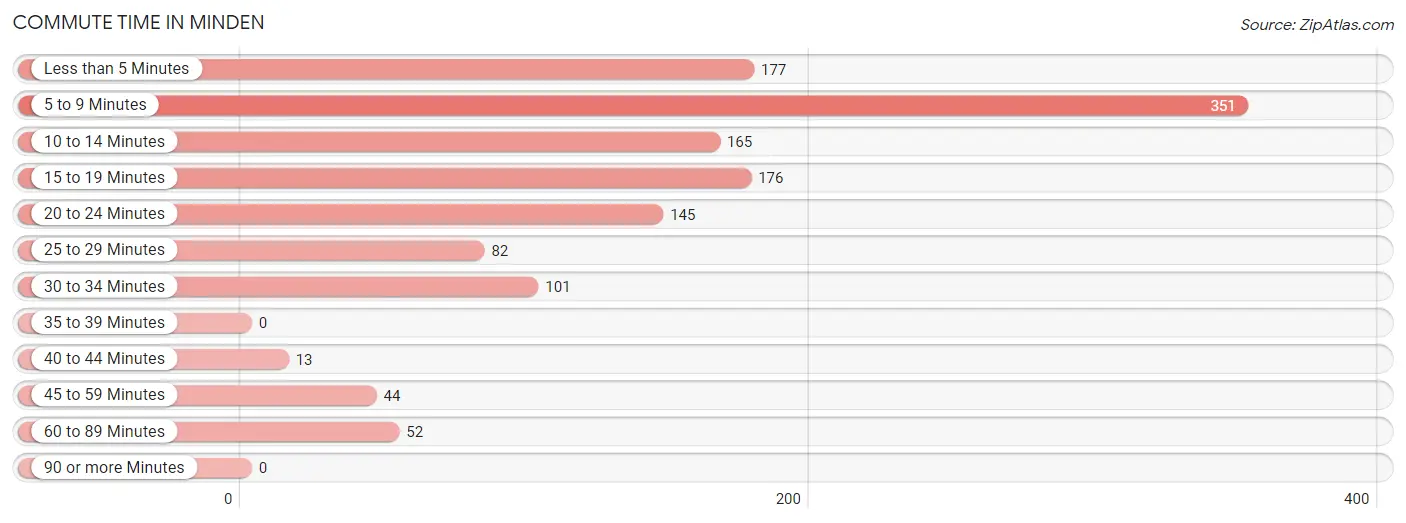
| Commute Time | # Commuters | % Commuters |
| Less than 5 Minutes | 177 | 13.6% |
| 5 to 9 Minutes | 351 | 26.9% |
| 10 to 14 Minutes | 165 | 12.6% |
| 15 to 19 Minutes | 176 | 13.5% |
| 20 to 24 Minutes | 145 | 11.1% |
| 25 to 29 Minutes | 82 | 6.3% |
| 30 to 34 Minutes | 101 | 7.7% |
| 35 to 39 Minutes | 0 | 0.0% |
| 40 to 44 Minutes | 13 | 1.0% |
| 45 to 59 Minutes | 44 | 3.4% |
| 60 to 89 Minutes | 52 | 4.0% |
| 90 or more Minutes | 0 | 0.0% |
Commute Time by Sex in Minden
The most common commute times in Minden are 5 to 9 minutes (178 commuters, 25.4%) for males and 5 to 9 minutes (173 commuters, 28.6%) for females.
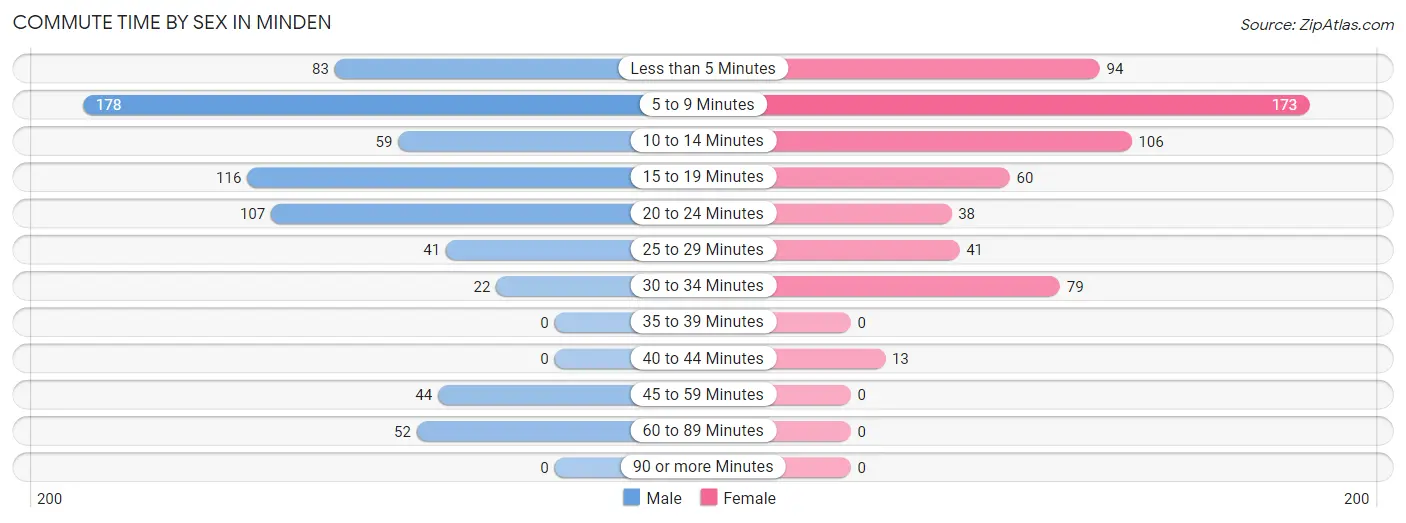
| Commute Time | Male | Female |
| Less than 5 Minutes | 83 (11.8%) | 94 (15.6%) |
| 5 to 9 Minutes | 178 (25.4%) | 173 (28.6%) |
| 10 to 14 Minutes | 59 (8.4%) | 106 (17.5%) |
| 15 to 19 Minutes | 116 (16.5%) | 60 (9.9%) |
| 20 to 24 Minutes | 107 (15.2%) | 38 (6.3%) |
| 25 to 29 Minutes | 41 (5.8%) | 41 (6.8%) |
| 30 to 34 Minutes | 22 (3.1%) | 79 (13.1%) |
| 35 to 39 Minutes | 0 (0.0%) | 0 (0.0%) |
| 40 to 44 Minutes | 0 (0.0%) | 13 (2.1%) |
| 45 to 59 Minutes | 44 (6.3%) | 0 (0.0%) |
| 60 to 89 Minutes | 52 (7.4%) | 0 (0.0%) |
| 90 or more Minutes | 0 (0.0%) | 0 (0.0%) |
Time of Departure to Work by Sex in Minden
The most frequent times of departure to work in Minden are 12:00 PM to 3:59 PM (195, 27.8%) for males and 8:00 AM to 8:29 AM (118, 19.5%) for females.
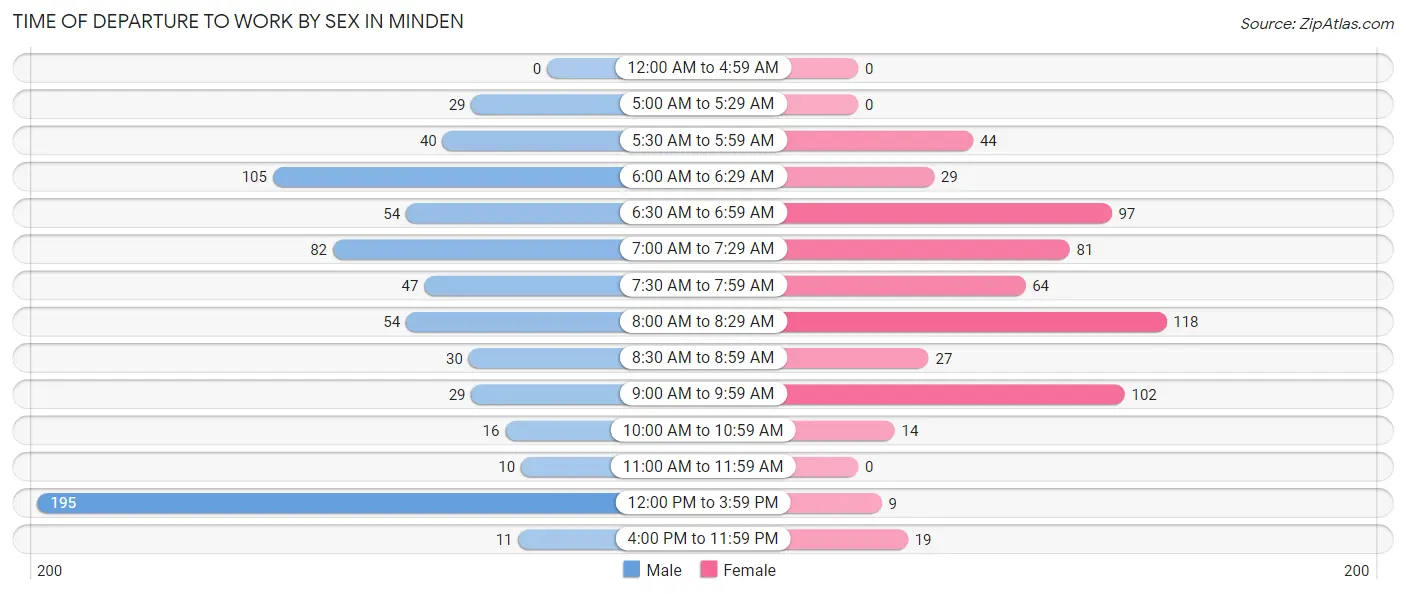
| Time of Departure | Male | Female |
| 12:00 AM to 4:59 AM | 0 (0.0%) | 0 (0.0%) |
| 5:00 AM to 5:29 AM | 29 (4.1%) | 0 (0.0%) |
| 5:30 AM to 5:59 AM | 40 (5.7%) | 44 (7.3%) |
| 6:00 AM to 6:29 AM | 105 (15.0%) | 29 (4.8%) |
| 6:30 AM to 6:59 AM | 54 (7.7%) | 97 (16.1%) |
| 7:00 AM to 7:29 AM | 82 (11.7%) | 81 (13.4%) |
| 7:30 AM to 7:59 AM | 47 (6.7%) | 64 (10.6%) |
| 8:00 AM to 8:29 AM | 54 (7.7%) | 118 (19.5%) |
| 8:30 AM to 8:59 AM | 30 (4.3%) | 27 (4.5%) |
| 9:00 AM to 9:59 AM | 29 (4.1%) | 102 (16.9%) |
| 10:00 AM to 10:59 AM | 16 (2.3%) | 14 (2.3%) |
| 11:00 AM to 11:59 AM | 10 (1.4%) | 0 (0.0%) |
| 12:00 PM to 3:59 PM | 195 (27.8%) | 9 (1.5%) |
| 4:00 PM to 11:59 PM | 11 (1.6%) | 19 (3.2%) |
| Total | 702 (100.0%) | 604 (100.0%) |
Housing Occupancy in Minden
Occupancy by Ownership in Minden
Of the total 1,304 dwellings in Minden, owner-occupied units account for 947 (72.6%), while renter-occupied units make up 357 (27.4%).
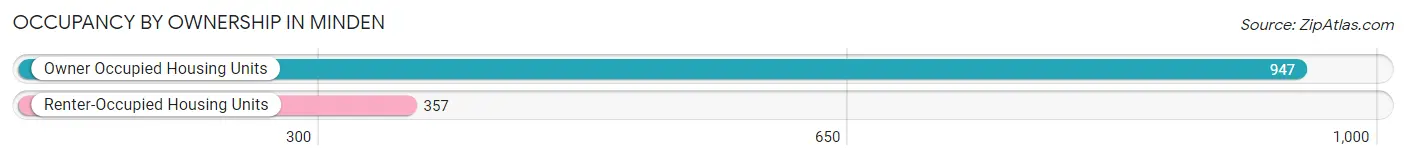
| Occupancy | # Housing Units | % Housing Units |
| Owner Occupied Housing Units | 947 | 72.6% |
| Renter-Occupied Housing Units | 357 | 27.4% |
| Total Occupied Housing Units | 1,304 | 100.0% |
Occupancy by Household Size in Minden
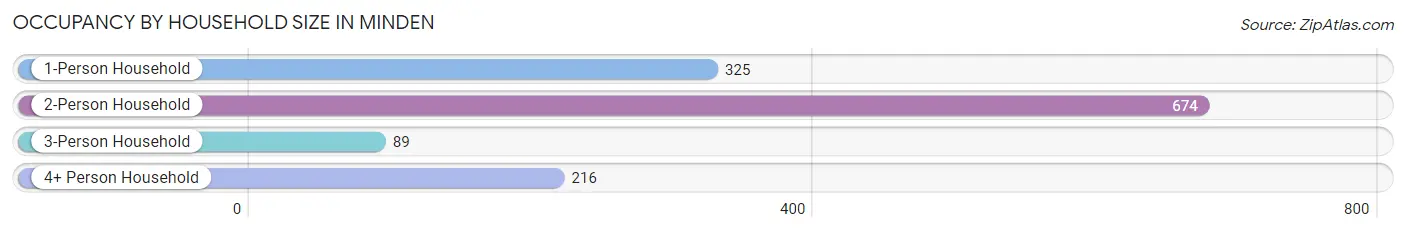
| Household Size | # Housing Units | % Housing Units |
| 1-Person Household | 325 | 24.9% |
| 2-Person Household | 674 | 51.7% |
| 3-Person Household | 89 | 6.8% |
| 4+ Person Household | 216 | 16.6% |
| Total Housing Units | 1,304 | 100.0% |
Occupancy by Ownership by Household Size in Minden
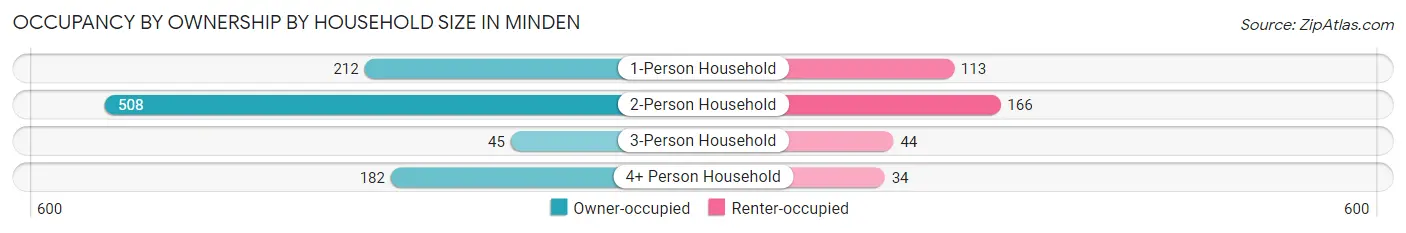
| Household Size | Owner-occupied | Renter-occupied |
| 1-Person Household | 212 (65.2%) | 113 (34.8%) |
| 2-Person Household | 508 (75.4%) | 166 (24.6%) |
| 3-Person Household | 45 (50.6%) | 44 (49.4%) |
| 4+ Person Household | 182 (84.3%) | 34 (15.7%) |
| Total Housing Units | 947 (72.6%) | 357 (27.4%) |
Occupancy by Educational Attainment in Minden
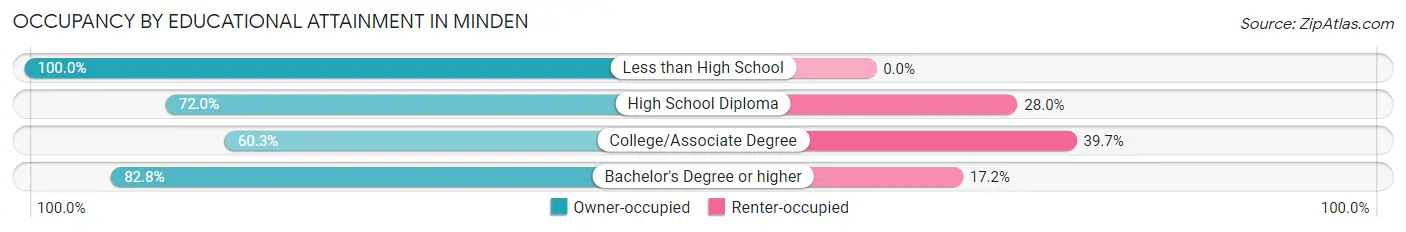
| Household Size | Owner-occupied | Renter-occupied |
| Less than High School | 16 (100.0%) | 0 (0.0%) |
| High School Diploma | 144 (72.0%) | 56 (28.0%) |
| College/Associate Degree | 305 (60.3%) | 201 (39.7%) |
| Bachelor's Degree or higher | 482 (82.8%) | 100 (17.2%) |
Occupancy by Age of Householder in Minden
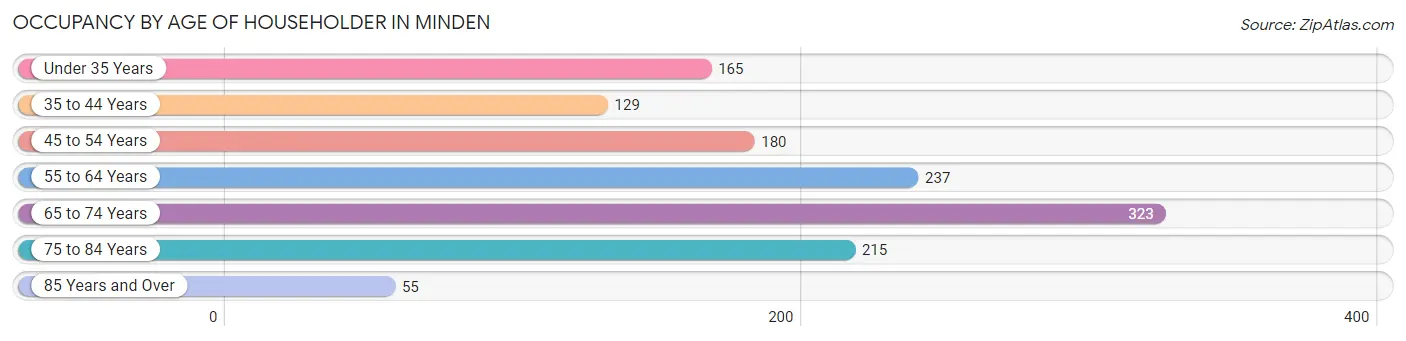
| Age Bracket | # Households | % Households |
| Under 35 Years | 165 | 12.7% |
| 35 to 44 Years | 129 | 9.9% |
| 45 to 54 Years | 180 | 13.8% |
| 55 to 64 Years | 237 | 18.2% |
| 65 to 74 Years | 323 | 24.8% |
| 75 to 84 Years | 215 | 16.5% |
| 85 Years and Over | 55 | 4.2% |
| Total | 1,304 | 100.0% |
Housing Finances in Minden
Median Income by Occupancy in Minden
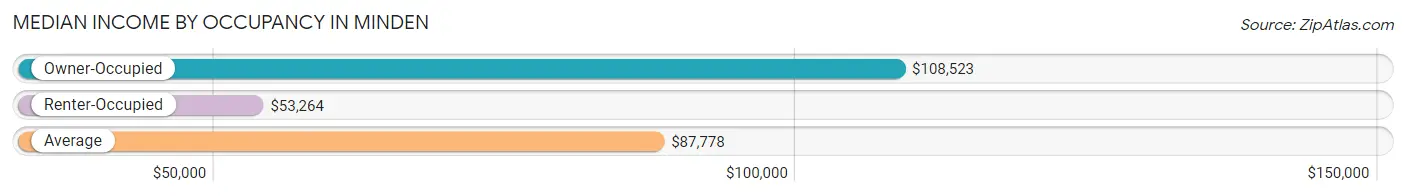
| Occupancy Type | # Households | Median Income |
| Owner-Occupied | 947 (72.6%) | $108,523 |
| Renter-Occupied | 357 (27.4%) | $53,264 |
| Average | 1,304 (100.0%) | $87,778 |
Occupancy by Householder Income Bracket in Minden
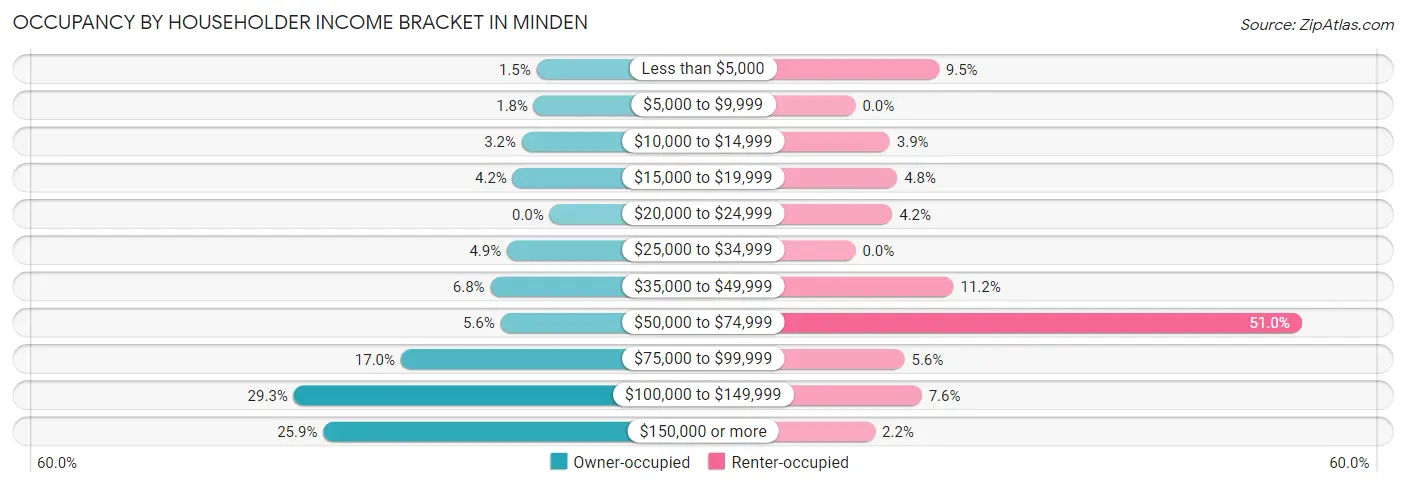
| Income Bracket | Owner-occupied | Renter-occupied |
| Less than $5,000 | 14 (1.5%) | 34 (9.5%) |
| $5,000 to $9,999 | 17 (1.8%) | 0 (0.0%) |
| $10,000 to $14,999 | 30 (3.2%) | 14 (3.9%) |
| $15,000 to $19,999 | 40 (4.2%) | 17 (4.8%) |
| $20,000 to $24,999 | 0 (0.0%) | 15 (4.2%) |
| $25,000 to $34,999 | 46 (4.9%) | 0 (0.0%) |
| $35,000 to $49,999 | 64 (6.8%) | 40 (11.2%) |
| $50,000 to $74,999 | 53 (5.6%) | 182 (51.0%) |
| $75,000 to $99,999 | 161 (17.0%) | 20 (5.6%) |
| $100,000 to $149,999 | 277 (29.2%) | 27 (7.6%) |
| $150,000 or more | 245 (25.9%) | 8 (2.2%) |
| Total | 947 (100.0%) | 357 (100.0%) |
Monthly Housing Cost Tiers in Minden
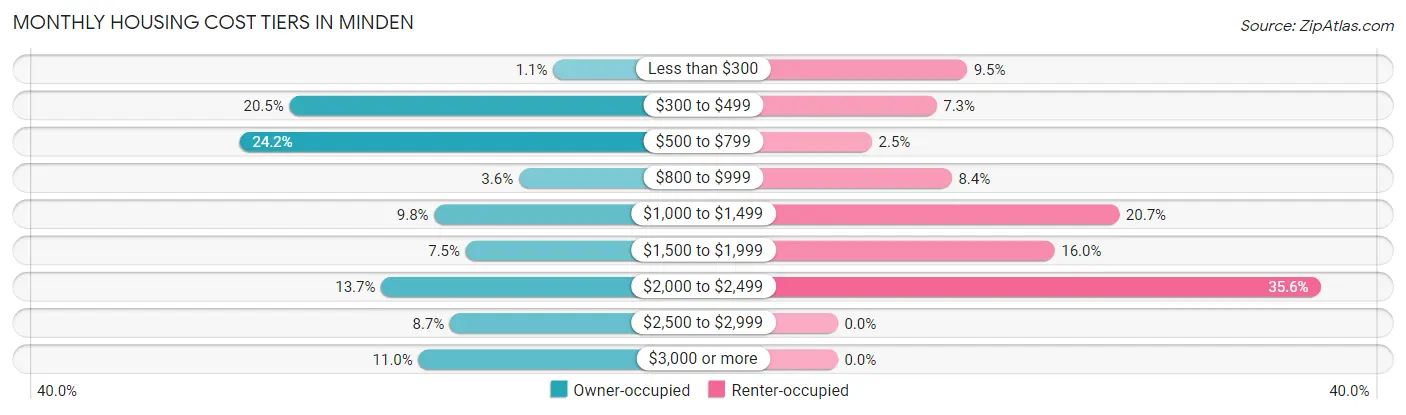
| Monthly Cost | Owner-occupied | Renter-occupied |
| Less than $300 | 10 (1.1%) | 34 (9.5%) |
| $300 to $499 | 194 (20.5%) | 26 (7.3%) |
| $500 to $799 | 229 (24.2%) | 9 (2.5%) |
| $800 to $999 | 34 (3.6%) | 30 (8.4%) |
| $1,000 to $1,499 | 93 (9.8%) | 74 (20.7%) |
| $1,500 to $1,999 | 71 (7.5%) | 57 (16.0%) |
| $2,000 to $2,499 | 130 (13.7%) | 127 (35.6%) |
| $2,500 to $2,999 | 82 (8.7%) | 0 (0.0%) |
| $3,000 or more | 104 (11.0%) | 0 (0.0%) |
| Total | 947 (100.0%) | 357 (100.0%) |
Physical Housing Characteristics in Minden
Housing Structures in Minden
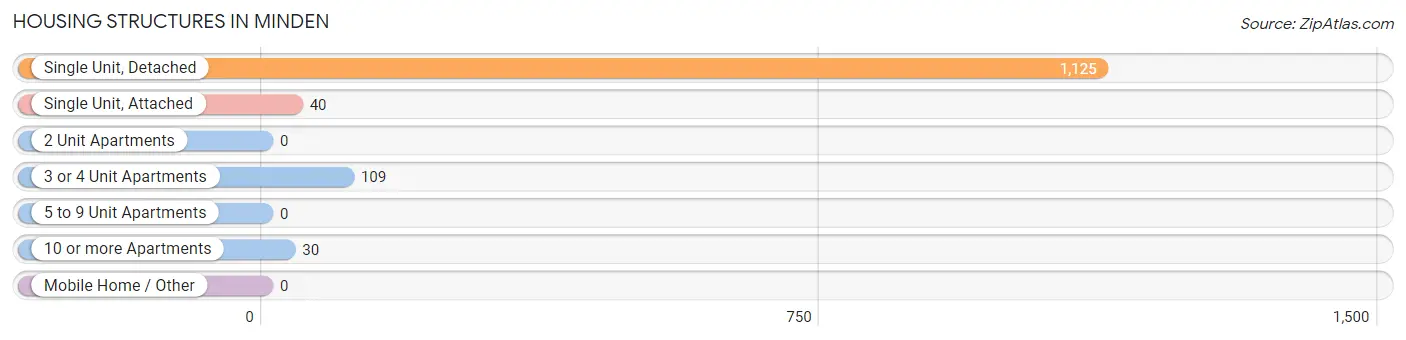
| Structure Type | # Housing Units | % Housing Units |
| Single Unit, Detached | 1,125 | 86.3% |
| Single Unit, Attached | 40 | 3.1% |
| 2 Unit Apartments | 0 | 0.0% |
| 3 or 4 Unit Apartments | 109 | 8.4% |
| 5 to 9 Unit Apartments | 0 | 0.0% |
| 10 or more Apartments | 30 | 2.3% |
| Mobile Home / Other | 0 | 0.0% |
| Total | 1,304 | 100.0% |
Housing Structures by Occupancy in Minden
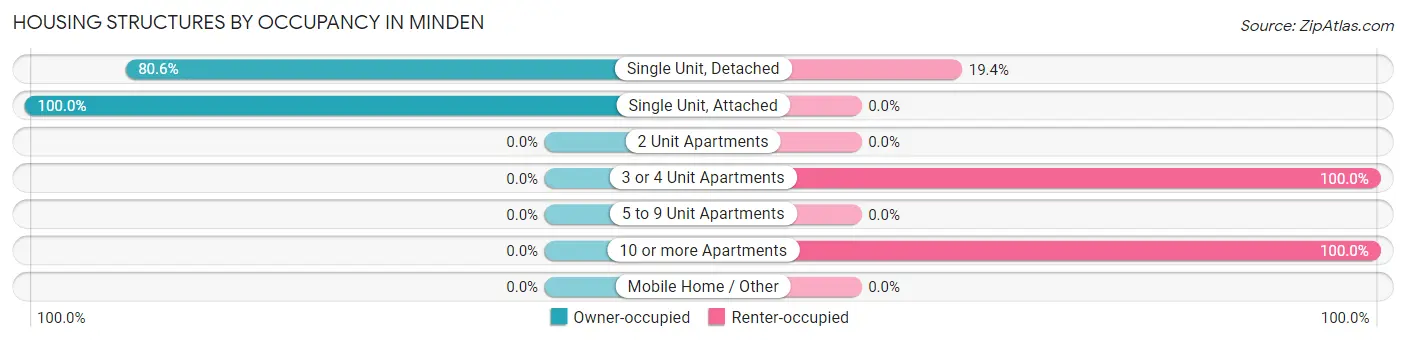
| Structure Type | Owner-occupied | Renter-occupied |
| Single Unit, Detached | 907 (80.6%) | 218 (19.4%) |
| Single Unit, Attached | 40 (100.0%) | 0 (0.0%) |
| 2 Unit Apartments | 0 (0.0%) | 0 (0.0%) |
| 3 or 4 Unit Apartments | 0 (0.0%) | 109 (100.0%) |
| 5 to 9 Unit Apartments | 0 (0.0%) | 0 (0.0%) |
| 10 or more Apartments | 0 (0.0%) | 30 (100.0%) |
| Mobile Home / Other | 0 (0.0%) | 0 (0.0%) |
| Total | 947 (72.6%) | 357 (27.4%) |
Housing Structures by Number of Rooms in Minden
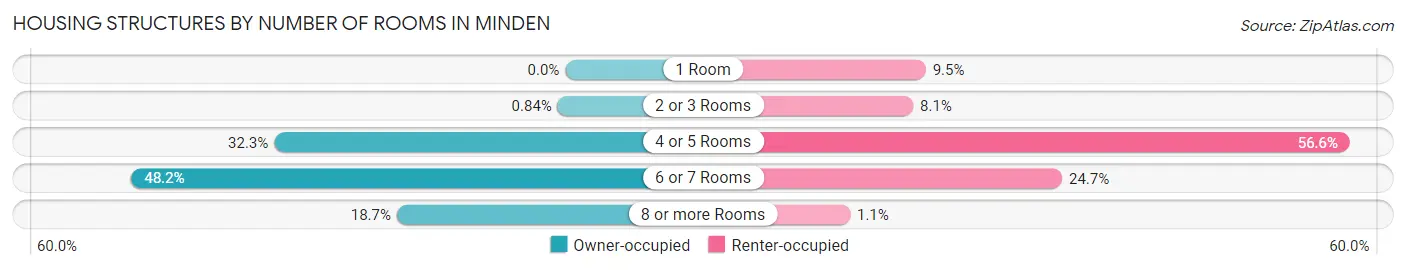
| Number of Rooms | Owner-occupied | Renter-occupied |
| 1 Room | 0 (0.0%) | 34 (9.5%) |
| 2 or 3 Rooms | 8 (0.8%) | 29 (8.1%) |
| 4 or 5 Rooms | 306 (32.3%) | 202 (56.6%) |
| 6 or 7 Rooms | 456 (48.1%) | 88 (24.6%) |
| 8 or more Rooms | 177 (18.7%) | 4 (1.1%) |
| Total | 947 (100.0%) | 357 (100.0%) |
Housing Structure by Heating Type in Minden
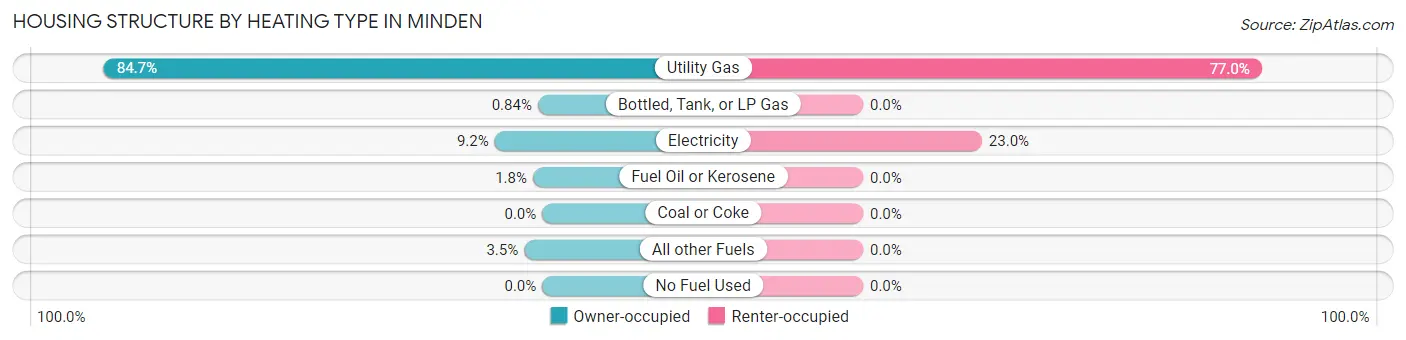
| Heating Type | Owner-occupied | Renter-occupied |
| Utility Gas | 802 (84.7%) | 275 (77.0%) |
| Bottled, Tank, or LP Gas | 8 (0.8%) | 0 (0.0%) |
| Electricity | 87 (9.2%) | 82 (23.0%) |
| Fuel Oil or Kerosene | 17 (1.8%) | 0 (0.0%) |
| Coal or Coke | 0 (0.0%) | 0 (0.0%) |
| All other Fuels | 33 (3.5%) | 0 (0.0%) |
| No Fuel Used | 0 (0.0%) | 0 (0.0%) |
| Total | 947 (100.0%) | 357 (100.0%) |
Household Vehicle Usage in Minden
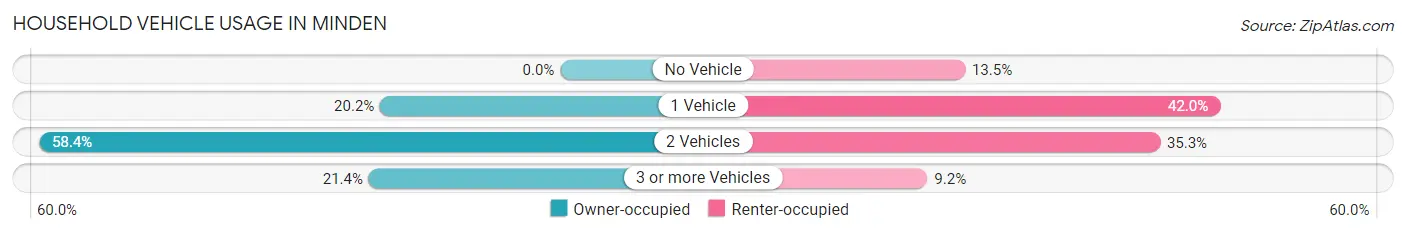
| Vehicles per Household | Owner-occupied | Renter-occupied |
| No Vehicle | 0 (0.0%) | 48 (13.5%) |
| 1 Vehicle | 191 (20.2%) | 150 (42.0%) |
| 2 Vehicles | 553 (58.4%) | 126 (35.3%) |
| 3 or more Vehicles | 203 (21.4%) | 33 (9.2%) |
| Total | 947 (100.0%) | 357 (100.0%) |
Real Estate & Mortgages in Minden
Real Estate and Mortgage Overview in Minden
| Characteristic | Without Mortgage | With Mortgage |
| Housing Units | 450 | 497 |
| Median Property Value | $470,200 | $484,200 |
| Median Household Income | $93,864 | $196 |
| Monthly Housing Costs | $533 | $104 |
| Real Estate Taxes | $3,021 | $16 |
Property Value by Mortgage Status in Minden
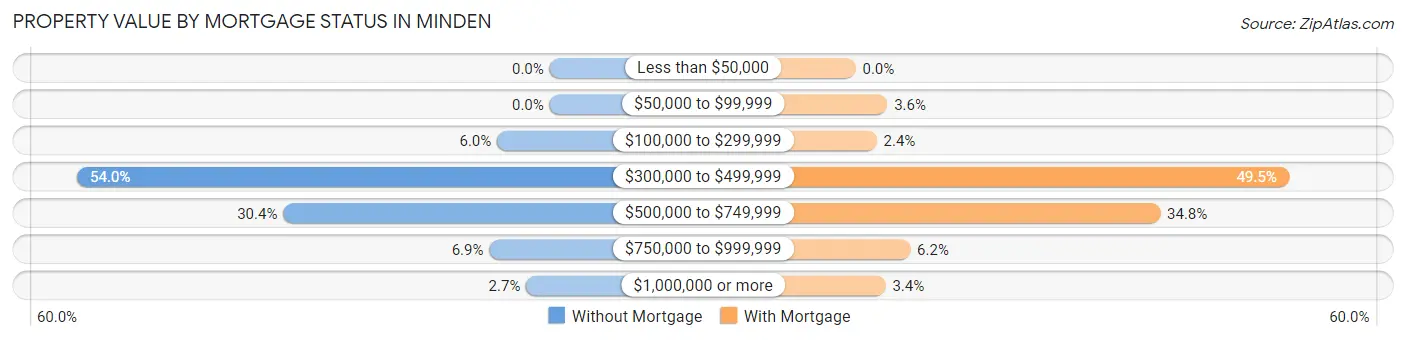
| Property Value | Without Mortgage | With Mortgage |
| Less than $50,000 | 0 (0.0%) | 0 (0.0%) |
| $50,000 to $99,999 | 0 (0.0%) | 18 (3.6%) |
| $100,000 to $299,999 | 27 (6.0%) | 12 (2.4%) |
| $300,000 to $499,999 | 243 (54.0%) | 246 (49.5%) |
| $500,000 to $749,999 | 137 (30.4%) | 173 (34.8%) |
| $750,000 to $999,999 | 31 (6.9%) | 31 (6.2%) |
| $1,000,000 or more | 12 (2.7%) | 17 (3.4%) |
| Total | 450 (100.0%) | 497 (100.0%) |
Household Income by Mortgage Status in Minden
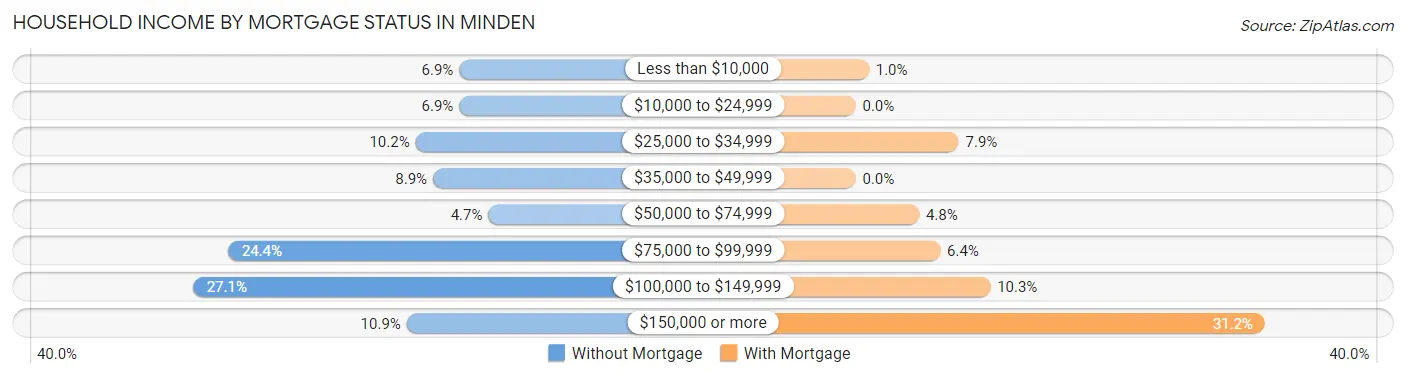
| Household Income | Without Mortgage | With Mortgage |
| Less than $10,000 | 31 (6.9%) | 5 (1.0%) |
| $10,000 to $24,999 | 31 (6.9%) | 0 (0.0%) |
| $25,000 to $34,999 | 46 (10.2%) | 39 (7.9%) |
| $35,000 to $49,999 | 40 (8.9%) | 0 (0.0%) |
| $50,000 to $74,999 | 21 (4.7%) | 24 (4.8%) |
| $75,000 to $99,999 | 110 (24.4%) | 32 (6.4%) |
| $100,000 to $149,999 | 122 (27.1%) | 51 (10.3%) |
| $150,000 or more | 49 (10.9%) | 155 (31.2%) |
| Total | 450 (100.0%) | 497 (100.0%) |
Property Value to Household Income Ratio in Minden
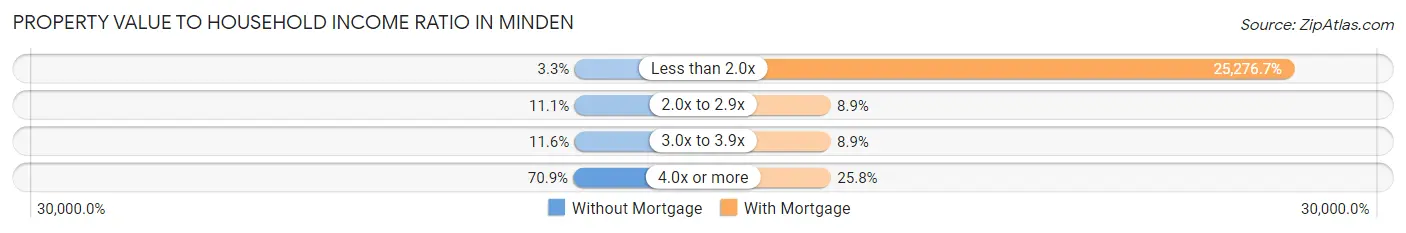
| Value-to-Income Ratio | Without Mortgage | With Mortgage |
| Less than 2.0x | 15 (3.3%) | 125,625 (25,276.7%) |
| 2.0x to 2.9x | 50 (11.1%) | 44 (8.8%) |
| 3.0x to 3.9x | 52 (11.6%) | 44 (8.8%) |
| 4.0x or more | 319 (70.9%) | 128 (25.8%) |
| Total | 450 (100.0%) | 497 (100.0%) |
Real Estate Taxes by Mortgage Status in Minden
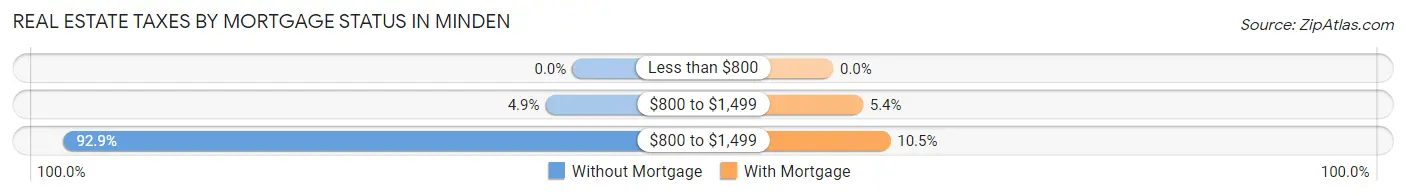
| Property Taxes | Without Mortgage | With Mortgage |
| Less than $800 | 0 (0.0%) | 0 (0.0%) |
| $800 to $1,499 | 22 (4.9%) | 27 (5.4%) |
| $800 to $1,499 | 418 (92.9%) | 52 (10.5%) |
| Total | 450 (100.0%) | 497 (100.0%) |
Health & Disability in Minden
Health Insurance Coverage by Age in Minden
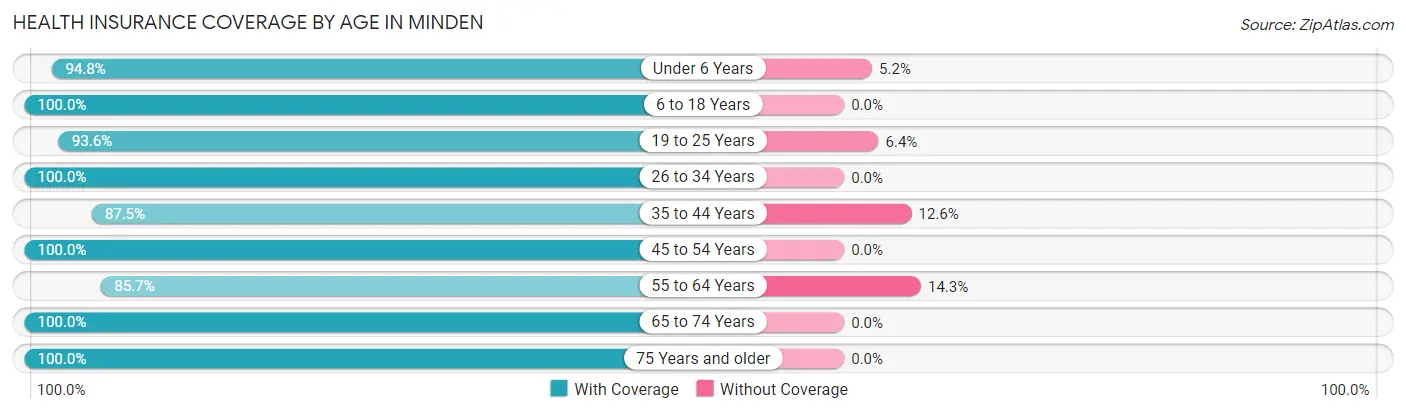
| Age Bracket | With Coverage | Without Coverage |
| Under 6 Years | 255 (94.8%) | 14 (5.2%) |
| 6 to 18 Years | 274 (100.0%) | 0 (0.0%) |
| 19 to 25 Years | 190 (93.6%) | 13 (6.4%) |
| 26 to 34 Years | 258 (100.0%) | 0 (0.0%) |
| 35 to 44 Years | 223 (87.5%) | 32 (12.6%) |
| 45 to 54 Years | 410 (100.0%) | 0 (0.0%) |
| 55 to 64 Years | 437 (85.7%) | 73 (14.3%) |
| 65 to 74 Years | 490 (100.0%) | 0 (0.0%) |
| 75 Years and older | 425 (100.0%) | 0 (0.0%) |
| Total | 2,962 (95.7%) | 132 (4.3%) |
Health Insurance Coverage by Citizenship Status in Minden
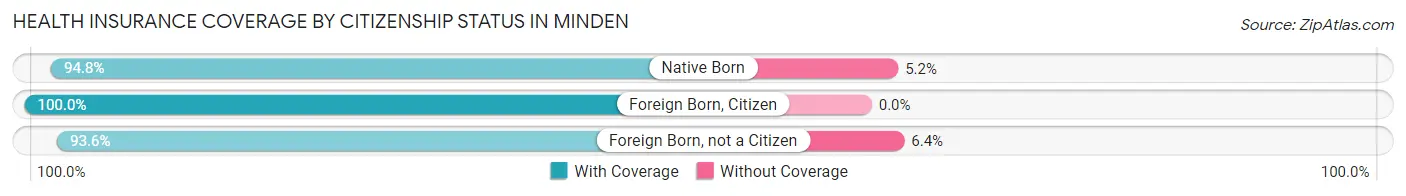
| Citizenship Status | With Coverage | Without Coverage |
| Native Born | 255 (94.8%) | 14 (5.2%) |
| Foreign Born, Citizen | 274 (100.0%) | 0 (0.0%) |
| Foreign Born, not a Citizen | 190 (93.6%) | 13 (6.4%) |
Health Insurance Coverage by Household Income in Minden
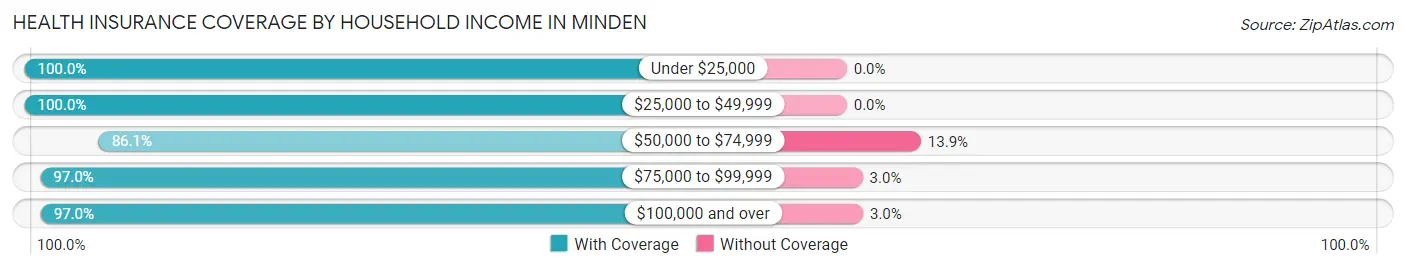
| Household Income | With Coverage | Without Coverage |
| Under $25,000 | 278 (100.0%) | 0 (0.0%) |
| $25,000 to $49,999 | 289 (100.0%) | 0 (0.0%) |
| $50,000 to $74,999 | 440 (86.1%) | 71 (13.9%) |
| $75,000 to $99,999 | 458 (97.0%) | 14 (3.0%) |
| $100,000 and over | 1,497 (97.0%) | 47 (3.0%) |
Public vs Private Health Insurance Coverage by Age in Minden
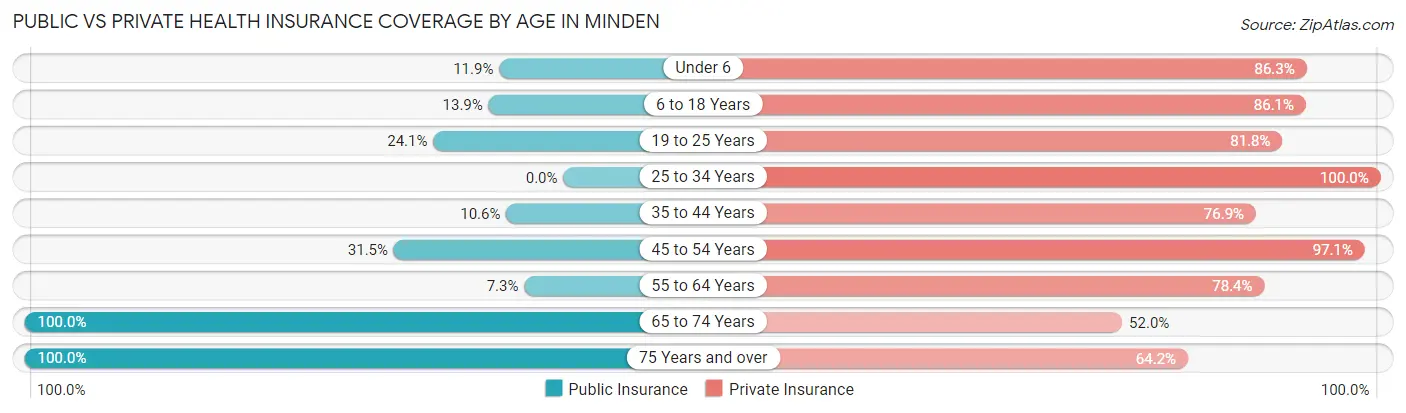
| Age Bracket | Public Insurance | Private Insurance |
| Under 6 | 32 (11.9%) | 232 (86.3%) |
| 6 to 18 Years | 38 (13.9%) | 236 (86.1%) |
| 19 to 25 Years | 49 (24.1%) | 166 (81.8%) |
| 25 to 34 Years | 0 (0.0%) | 258 (100.0%) |
| 35 to 44 Years | 27 (10.6%) | 196 (76.9%) |
| 45 to 54 Years | 129 (31.5%) | 398 (97.1%) |
| 55 to 64 Years | 37 (7.2%) | 400 (78.4%) |
| 65 to 74 Years | 490 (100.0%) | 255 (52.0%) |
| 75 Years and over | 425 (100.0%) | 273 (64.2%) |
| Total | 1,227 (39.7%) | 2,414 (78.0%) |
Disability Status by Sex by Age in Minden
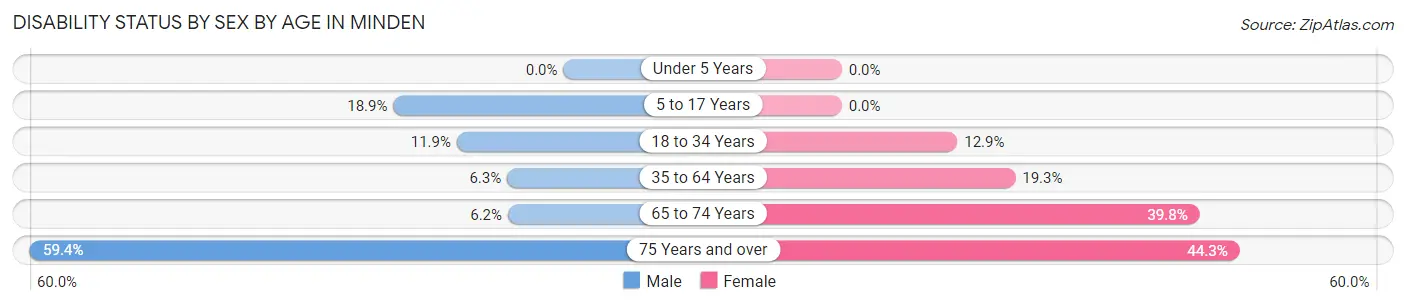
| Age Bracket | Male | Female |
| Under 5 Years | 0 (0.0%) | 0 (0.0%) |
| 5 to 17 Years | 25 (18.9%) | 0 (0.0%) |
| 18 to 34 Years | 26 (11.9%) | 36 (12.9%) |
| 35 to 64 Years | 37 (6.3%) | 113 (19.3%) |
| 65 to 74 Years | 16 (6.2%) | 92 (39.8%) |
| 75 Years and over | 117 (59.4%) | 101 (44.3%) |
Disability Class by Sex by Age in Minden
Disability Class: Hearing Difficulty
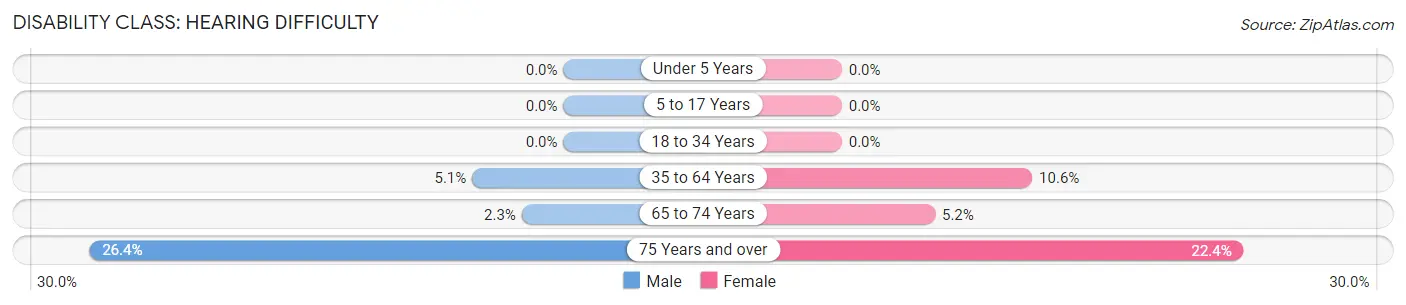
| Age Bracket | Male | Female |
| Under 5 Years | 0 (0.0%) | 0 (0.0%) |
| 5 to 17 Years | 0 (0.0%) | 0 (0.0%) |
| 18 to 34 Years | 0 (0.0%) | 0 (0.0%) |
| 35 to 64 Years | 30 (5.1%) | 62 (10.6%) |
| 65 to 74 Years | 6 (2.3%) | 12 (5.2%) |
| 75 Years and over | 52 (26.4%) | 51 (22.4%) |
Disability Class: Vision Difficulty
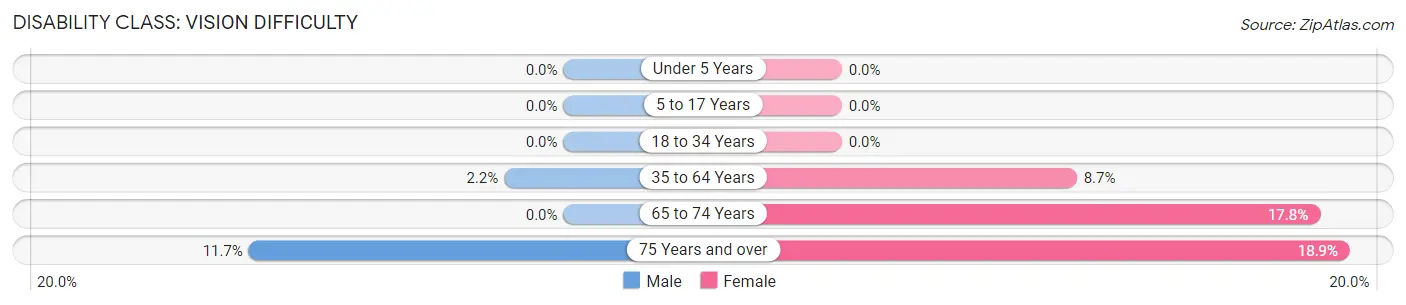
| Age Bracket | Male | Female |
| Under 5 Years | 0 (0.0%) | 0 (0.0%) |
| 5 to 17 Years | 0 (0.0%) | 0 (0.0%) |
| 18 to 34 Years | 0 (0.0%) | 0 (0.0%) |
| 35 to 64 Years | 13 (2.2%) | 51 (8.7%) |
| 65 to 74 Years | 0 (0.0%) | 41 (17.7%) |
| 75 Years and over | 23 (11.7%) | 43 (18.9%) |
Disability Class: Cognitive Difficulty
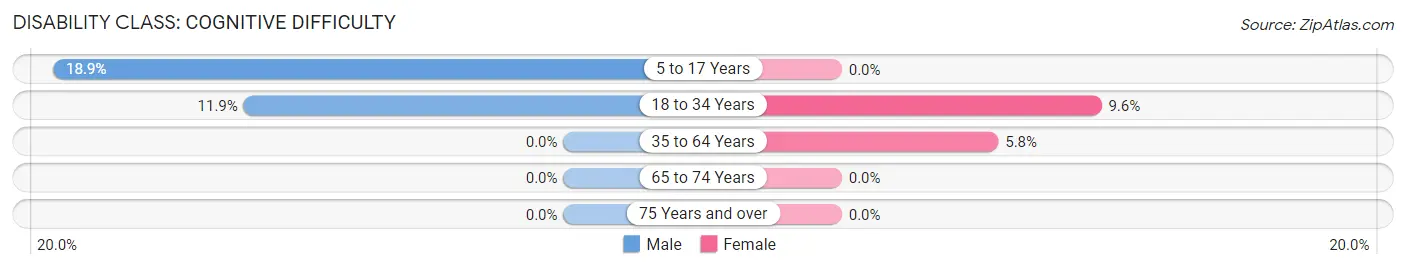
| Age Bracket | Male | Female |
| 5 to 17 Years | 25 (18.9%) | 0 (0.0%) |
| 18 to 34 Years | 26 (11.9%) | 27 (9.6%) |
| 35 to 64 Years | 0 (0.0%) | 34 (5.8%) |
| 65 to 74 Years | 0 (0.0%) | 0 (0.0%) |
| 75 Years and over | 0 (0.0%) | 0 (0.0%) |
Disability Class: Ambulatory Difficulty
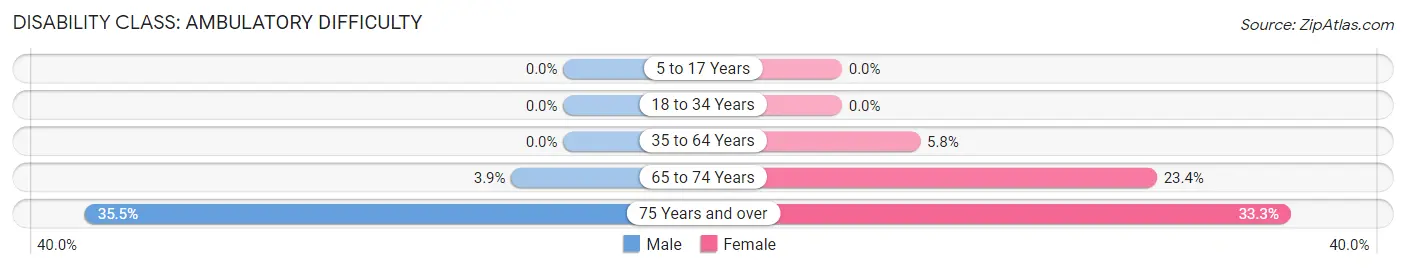
| Age Bracket | Male | Female |
| 5 to 17 Years | 0 (0.0%) | 0 (0.0%) |
| 18 to 34 Years | 0 (0.0%) | 0 (0.0%) |
| 35 to 64 Years | 0 (0.0%) | 34 (5.8%) |
| 65 to 74 Years | 10 (3.9%) | 54 (23.4%) |
| 75 Years and over | 70 (35.5%) | 76 (33.3%) |
Disability Class: Self-Care Difficulty
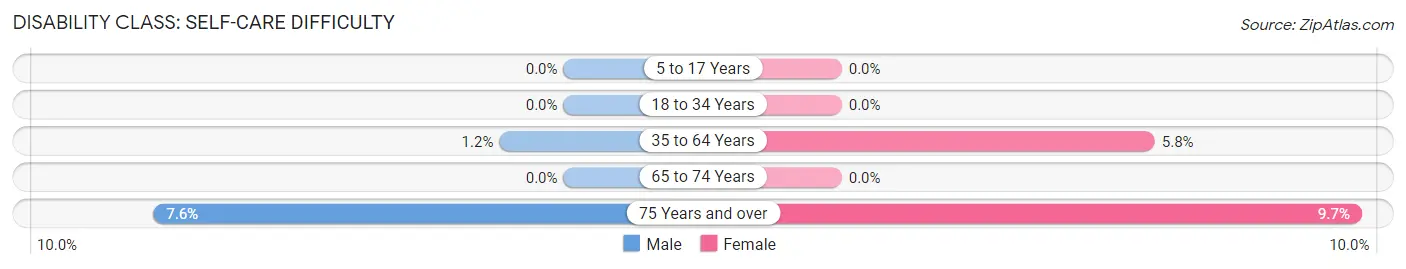
| Age Bracket | Male | Female |
| 5 to 17 Years | 0 (0.0%) | 0 (0.0%) |
| 18 to 34 Years | 0 (0.0%) | 0 (0.0%) |
| 35 to 64 Years | 7 (1.2%) | 34 (5.8%) |
| 65 to 74 Years | 0 (0.0%) | 0 (0.0%) |
| 75 Years and over | 15 (7.6%) | 22 (9.7%) |
Technology Access in Minden
Computing Device Access in Minden
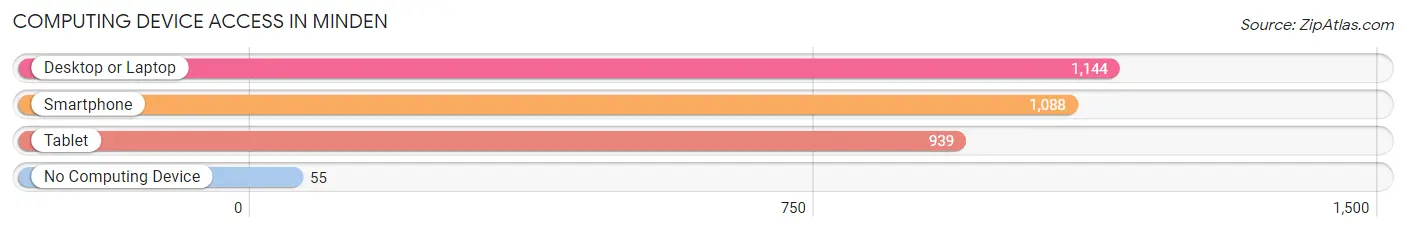
| Device Type | # Households | % Households |
| Desktop or Laptop | 1,144 | 87.7% |
| Smartphone | 1,088 | 83.4% |
| Tablet | 939 | 72.0% |
| No Computing Device | 55 | 4.2% |
| Total | 1,304 | 100.0% |
Internet Access in Minden
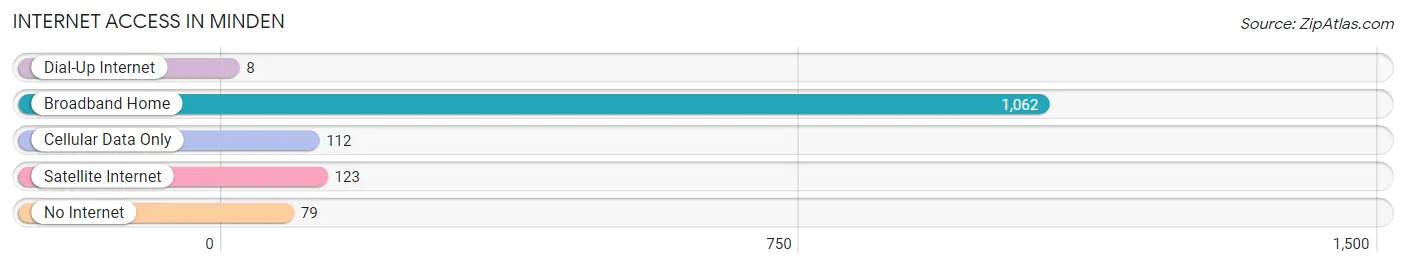
| Internet Type | # Households | % Households |
| Dial-Up Internet | 8 | 0.6% |
| Broadband Home | 1,062 | 81.4% |
| Cellular Data Only | 112 | 8.6% |
| Satellite Internet | 123 | 9.4% |
| No Internet | 79 | 6.1% |
| Total | 1,304 | 100.0% |
Minden Summary
History
The town of Minden, Nevada is located in Douglas County, in the western part of the state. It was founded in 1906 by German immigrants, who named it after the city of Minden in Germany. The town was originally a farming community, and the first settlers grew wheat, barley, and alfalfa. The town was incorporated in 1908, and the first mayor was John F. Stein.
The town grew slowly, but steadily, and by the 1920s, it had become a popular tourist destination. The town was known for its beautiful scenery, and it was a popular spot for fishing, hunting, and camping. The town also had a thriving business district, with several stores, restaurants, and hotels.
In the 1950s, the town began to experience a population boom, as people moved to the area to take advantage of the booming economy. The town was also home to several large businesses, including a lumber mill, a dairy, and a cannery.
Geography
Minden is located in the Carson Valley, in the western part of Nevada. It is situated at the base of the Sierra Nevada Mountains, and is surrounded by the Carson River. The town is located at an elevation of 4,890 feet, and has a total area of 4.2 square miles.
The climate in Minden is semi-arid, with hot summers and cold winters. The average annual temperature is 54 degrees Fahrenheit, and the average annual precipitation is 8.5 inches.
Economy
The economy of Minden is largely based on agriculture and tourism. The town is home to several large farms, which produce a variety of crops, including wheat, barley, alfalfa, and hay. The town is also home to several wineries, which produce a variety of wines.
The town is also a popular tourist destination, and is home to several hotels, restaurants, and shops. The town is also home to several museums, including the Carson Valley Museum and the Nevada State Railroad Museum.
Demographics
As of the 2010 census, the population of Minden was 2,836. The racial makeup of the town was 91.3% White, 0.7% African American, 0.7% Native American, 0.7% Asian, 0.2% Pacific Islander, 4.2% from other races, and 2.1% from two or more races. Hispanic or Latino of any race were 8.3% of the population.
The median income for a household in Minden was $45,938, and the median income for a family was $50,938. The per capita income for the town was $21,938. About 8.3% of families and 10.3% of the population were below the poverty line, including 14.3% of those under age 18 and 5.3% of those age 65 or over.
Common Questions
What is Per Capita Income in Minden?
Per Capita income in Minden is $43,921.
What is the Median Family Income in Minden?
Median Family Income in Minden is $105,833.
What is the Median Household income in Minden?
Median Household Income in Minden is $87,778.
What is Income or Wage Gap in Minden?
Income or Wage Gap in Minden is 32.6%.
Women in Minden earn 67.4 cents for every dollar earned by a man.
What is Inequality or Gini Index in Minden?
Inequality or Gini Index in Minden is 0.40.
What is the Total Population of Minden?
Total Population of Minden is 3,140.
What is the Total Male Population of Minden?
Total Male Population of Minden is 1,530.
What is the Total Female Population of Minden?
Total Female Population of Minden is 1,610.
What is the Ratio of Males per 100 Females in Minden?
There are 95.03 Males per 100 Females in Minden.
What is the Ratio of Females per 100 Males in Minden?
There are 105.23 Females per 100 Males in Minden.
What is the Median Population Age in Minden?
Median Population Age in Minden is 51.0 Years.
What is the Average Family Size in Minden
Average Family Size in Minden is 2.8 People.
What is the Average Household Size in Minden
Average Household Size in Minden is 2.4 People.
How Large is the Labor Force in Minden?
There are 1,491 People in the Labor Forcein in Minden.
What is the Percentage of People in the Labor Force in Minden?
55.1% of People are in the Labor Force in Minden.
What is the Unemployment Rate in Minden?
Unemployment Rate in Minden is 0.5%.