Mesquite, NV Map & Demographics
Mesquite Map
Mesquite Overview
$37,788
PER CAPITA INCOME
$76,653
AVG FAMILY INCOME
$69,146
AVG HOUSEHOLD INCOME
29.7%
WAGE / INCOME GAP [ % ]
70.3¢/ $1
WAGE / INCOME GAP [ $ ]
$8,525
FAMILY INCOME DEFICIT
0.40
INEQUALITY / GINI INDEX
20,659
TOTAL POPULATION
10,514
MALE POPULATION
10,145
FEMALE POPULATION
103.64
MALES / 100 FEMALES
96.49
FEMALES / 100 MALES
62.3
MEDIAN AGE
2.7
AVG FAMILY SIZE
2.3
AVG HOUSEHOLD SIZE
6,878
LABOR FORCE [ PEOPLE ]
37.8%
PERCENT IN LABOR FORCE
7.6%
UNEMPLOYMENT RATE
Income in Mesquite
Income Overview in Mesquite
Per Capita Income in Mesquite is $37,788, while median incomes of families and households are $76,653 and $69,146 respectively.
| Characteristic | Number | Measure |
| Per Capita Income | 20,659 | $37,788 |
| Median Family Income | 6,262 | $76,653 |
| Mean Family Income | 6,262 | $94,359 |
| Median Household Income | 9,048 | $69,146 |
| Mean Household Income | 9,048 | $85,081 |
| Income Deficit | 6,262 | $8,525 |
| Wage / Income Gap (%) | 20,659 | 29.72% |
| Wage / Income Gap ($) | 20,659 | 70.28¢ per $1 |
| Gini / Inequality Index | 20,659 | 0.40 |
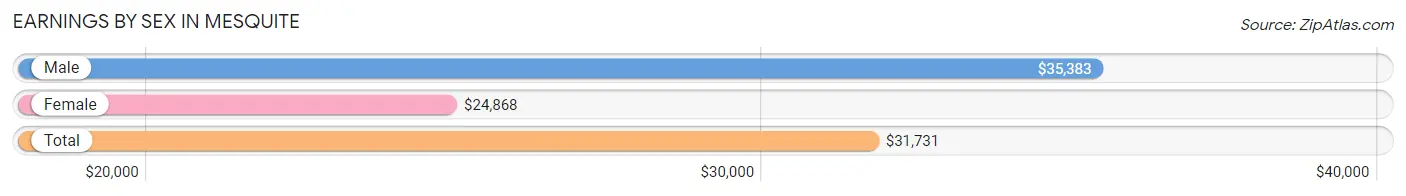
Earnings by Sex in Mesquite
Average Earnings in Mesquite are $31,731, $35,383 for men and $24,868 for women, a difference of 29.7%.
| Sex | Number | Average Earnings |
| Male | 4,132 (55.0%) | $35,383 |
| Female | 3,384 (45.0%) | $24,868 |
| Total | 7,516 (100.0%) | $31,731 |
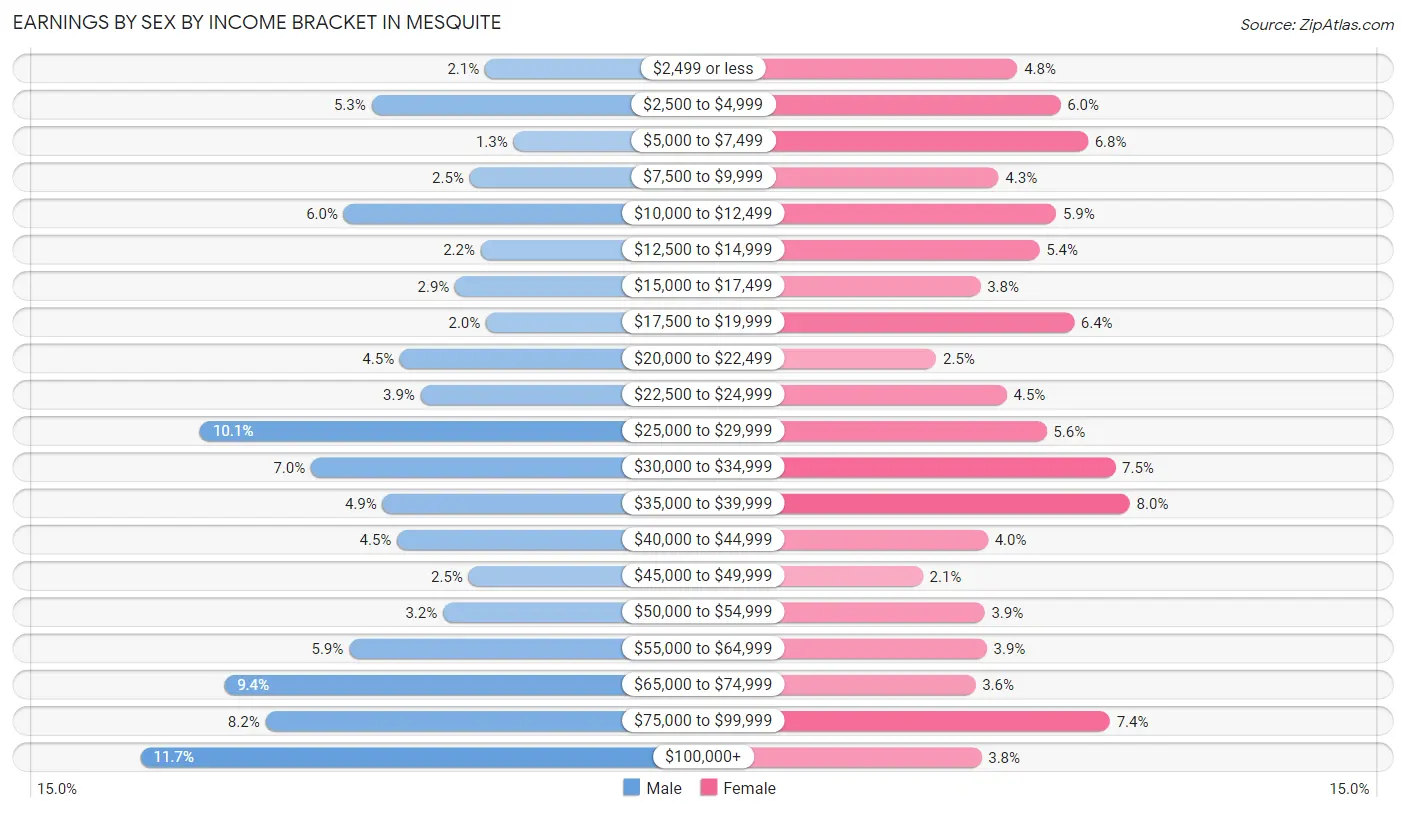
Earnings by Sex by Income Bracket in Mesquite
The most common earnings brackets in Mesquite are $100,000+ for men (485 | 11.7%) and $35,000 to $39,999 for women (269 | 8.0%).
| Income | Male | Female |
| $2,499 or less | 85 (2.1%) | 162 (4.8%) |
| $2,500 to $4,999 | 217 (5.2%) | 203 (6.0%) |
| $5,000 to $7,499 | 52 (1.3%) | 229 (6.8%) |
| $7,500 to $9,999 | 103 (2.5%) | 144 (4.3%) |
| $10,000 to $12,499 | 249 (6.0%) | 199 (5.9%) |
| $12,500 to $14,999 | 90 (2.2%) | 183 (5.4%) |
| $15,000 to $17,499 | 120 (2.9%) | 127 (3.7%) |
| $17,500 to $19,999 | 84 (2.0%) | 216 (6.4%) |
| $20,000 to $22,499 | 184 (4.4%) | 85 (2.5%) |
| $22,500 to $24,999 | 160 (3.9%) | 152 (4.5%) |
| $25,000 to $29,999 | 416 (10.1%) | 190 (5.6%) |
| $30,000 to $34,999 | 287 (7.0%) | 255 (7.5%) |
| $35,000 to $39,999 | 204 (4.9%) | 269 (8.0%) |
| $40,000 to $44,999 | 187 (4.5%) | 134 (4.0%) |
| $45,000 to $49,999 | 104 (2.5%) | 72 (2.1%) |
| $50,000 to $54,999 | 134 (3.2%) | 131 (3.9%) |
| $55,000 to $64,999 | 243 (5.9%) | 133 (3.9%) |
| $65,000 to $74,999 | 388 (9.4%) | 122 (3.6%) |
| $75,000 to $99,999 | 340 (8.2%) | 250 (7.4%) |
| $100,000+ | 485 (11.7%) | 128 (3.8%) |
| Total | 4,132 (100.0%) | 3,384 (100.0%) |
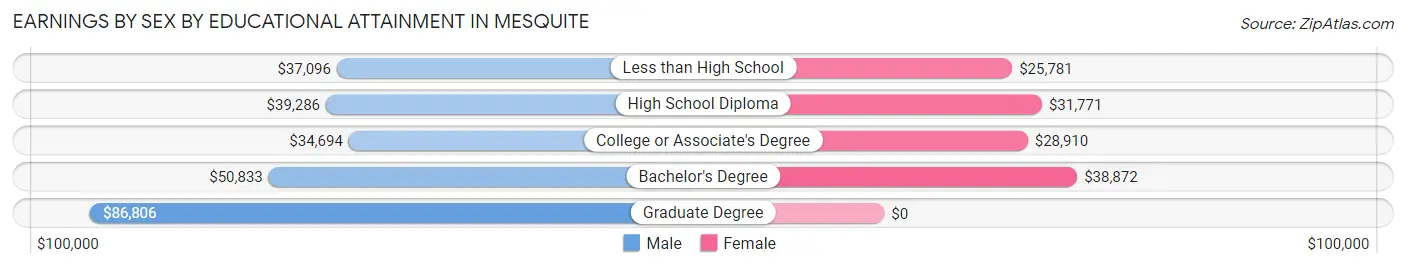
Earnings by Sex by Educational Attainment in Mesquite
Average earnings in Mesquite are $40,273 for men and $29,461 for women, a difference of 26.9%. Men with an educational attainment of graduate degree enjoy the highest average annual earnings of $86,806, while those with college or associate's degree education earn the least with $34,694. Women with an educational attainment of bachelor's degree earn the most with the average annual earnings of $38,872, while those with less than high school education have the smallest earnings of $25,781.
| Educational Attainment | Male Income | Female Income |
| Less than High School | $37,096 | $25,781 |
| High School Diploma | $39,286 | $31,771 |
| College or Associate's Degree | $34,694 | $28,910 |
| Bachelor's Degree | $50,833 | $38,872 |
| Graduate Degree | $86,806 | $0 |
| Total | $40,273 | $29,461 |
Family Income in Mesquite
Family Income Brackets in Mesquite
According to the Mesquite family income data, there are 1,371 families falling into the $50,000 to $74,999 income range, which is the most common income bracket and makes up 21.9% of all families. Conversely, the $10,000 to $14,999 income bracket is the least frequent group with only 56 families (0.9%) belonging to this category.
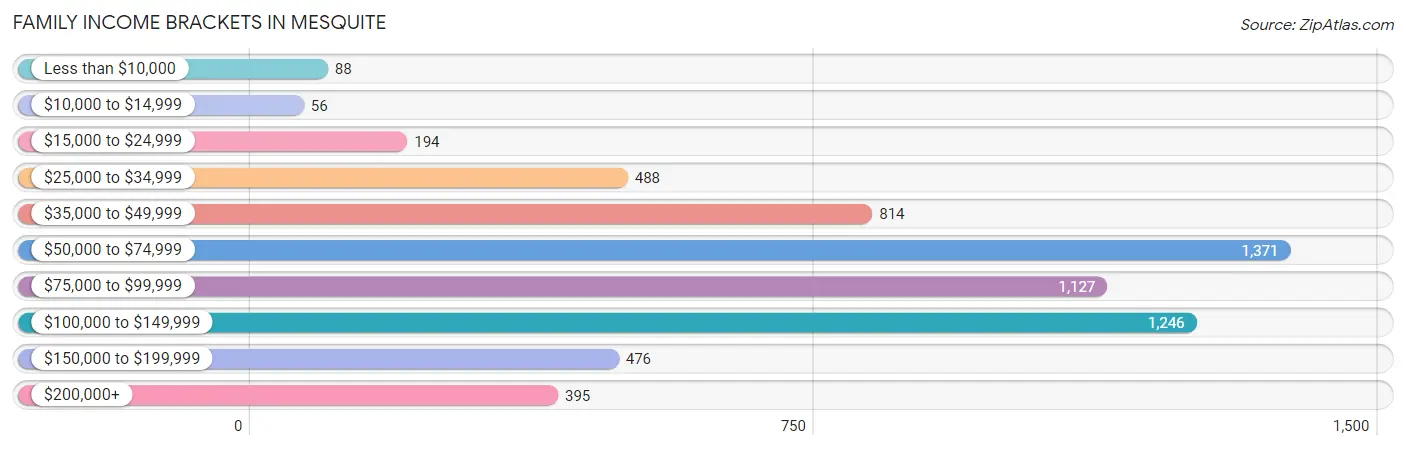
| Income Bracket | # Families | % Families |
| Less than $10,000 | 88 | 1.4% |
| $10,000 to $14,999 | 56 | 0.9% |
| $15,000 to $24,999 | 194 | 3.1% |
| $25,000 to $34,999 | 488 | 7.8% |
| $35,000 to $49,999 | 814 | 13.0% |
| $50,000 to $74,999 | 1,371 | 21.9% |
| $75,000 to $99,999 | 1,127 | 18.0% |
| $100,000 to $149,999 | 1,246 | 19.9% |
| $150,000 to $199,999 | 476 | 7.6% |
| $200,000+ | 395 | 6.3% |
Family Income by Famaliy Size in Mesquite
5-person families (243 | 3.9%) account for the highest median family income in Mesquite with $104,676 per family, while 2-person families (4,515 | 72.1%) have the highest median income of $38,494 per family member.
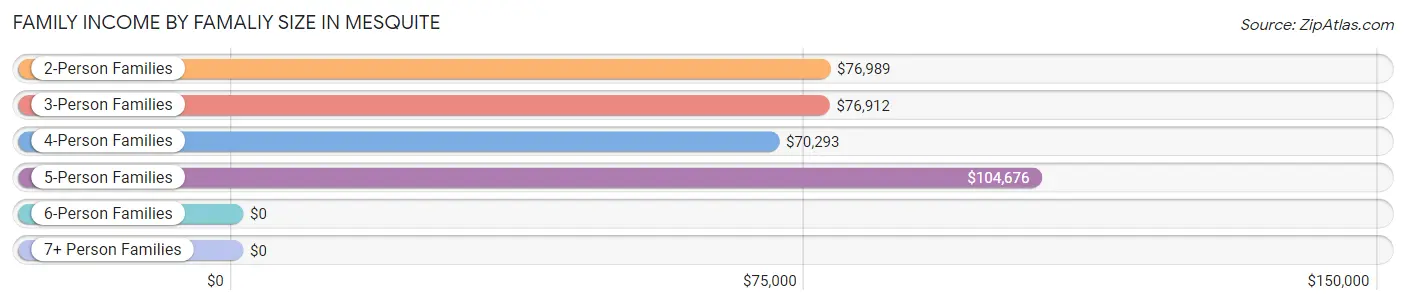
| Income Bracket | # Families | Median Income |
| 2-Person Families | 4,515 (72.1%) | $76,989 |
| 3-Person Families | 572 (9.1%) | $76,912 |
| 4-Person Families | 723 (11.6%) | $70,293 |
| 5-Person Families | 243 (3.9%) | $104,676 |
| 6-Person Families | 153 (2.4%) | $0 |
| 7+ Person Families | 56 (0.9%) | $0 |
| Total | 6,262 (100.0%) | $76,653 |
Family Income by Number of Earners in Mesquite
The median family income in Mesquite is $76,653, with families comprising 3+ earners (444) having the highest median family income of $102,679, while families with no earners (2,853) have the lowest median family income of $72,774, accounting for 7.1% and 45.6% of families, respectively.
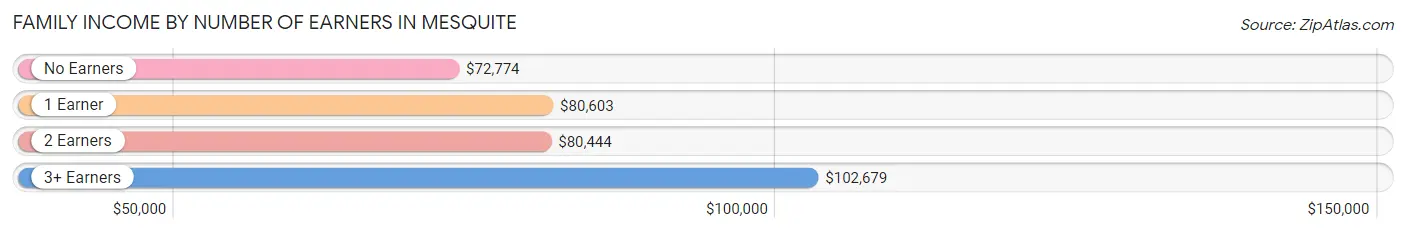
| Number of Earners | # Families | Median Income |
| No Earners | 2,853 (45.6%) | $72,774 |
| 1 Earner | 1,738 (27.8%) | $80,603 |
| 2 Earners | 1,227 (19.6%) | $80,444 |
| 3+ Earners | 444 (7.1%) | $102,679 |
| Total | 6,262 (100.0%) | $76,653 |
Household Income in Mesquite
Household Income Brackets in Mesquite
With 1,828 households falling in the category, the $50,000 to $74,999 income range is the most frequent in Mesquite, accounting for 20.2% of all households. In contrast, only 154 households (1.7%) fall into the $10,000 to $14,999 income bracket, making it the least populous group.
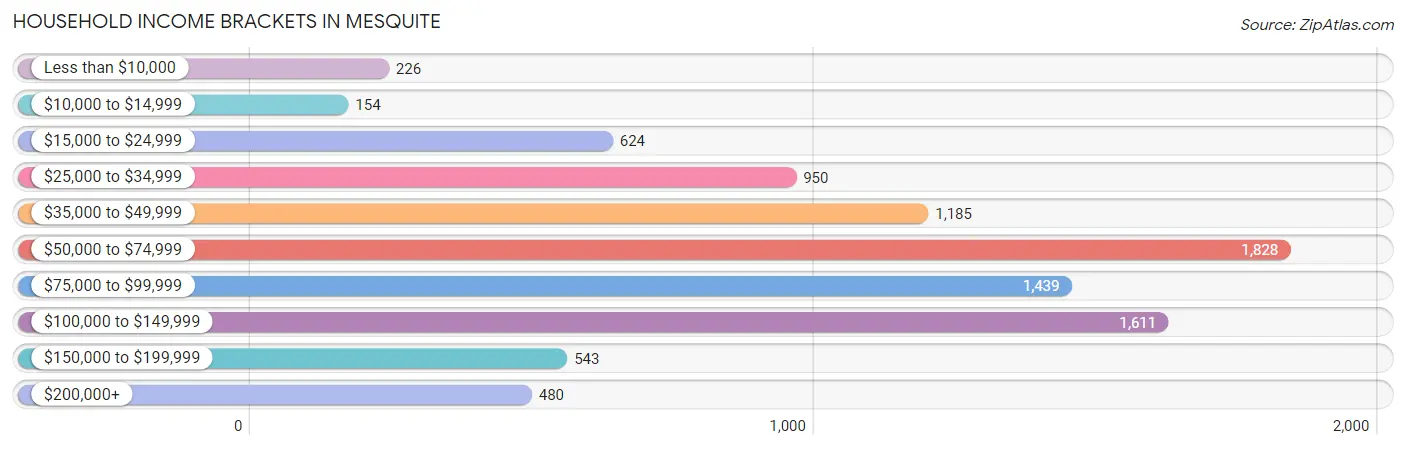
| Income Bracket | # Households | % Households |
| Less than $10,000 | 226 | 2.5% |
| $10,000 to $14,999 | 154 | 1.7% |
| $15,000 to $24,999 | 624 | 6.9% |
| $25,000 to $34,999 | 950 | 10.5% |
| $35,000 to $49,999 | 1,185 | 13.1% |
| $50,000 to $74,999 | 1,828 | 20.2% |
| $75,000 to $99,999 | 1,439 | 15.9% |
| $100,000 to $149,999 | 1,611 | 17.8% |
| $150,000 to $199,999 | 543 | 6.0% |
| $200,000+ | 480 | 5.3% |
Household Income by Householder Age in Mesquite
The median household income in Mesquite is $69,146, with the highest median household income of $75,565 found in the 25 to 44 years age bracket for the primary householder. A total of 1,254 households (13.9%) fall into this category. Meanwhile, the 15 to 24 years age bracket for the primary householder has the lowest median household income of $32,621, with 169 households (1.9%) in this group.
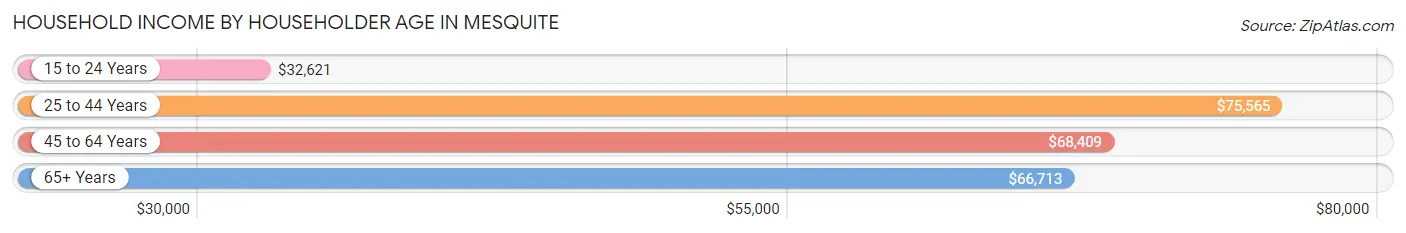
| Income Bracket | # Households | Median Income |
| 15 to 24 Years | 169 (1.9%) | $32,621 |
| 25 to 44 Years | 1,254 (13.9%) | $75,565 |
| 45 to 64 Years | 2,124 (23.5%) | $68,409 |
| 65+ Years | 5,501 (60.8%) | $66,713 |
| Total | 9,048 (100.0%) | $69,146 |
Poverty in Mesquite
Income Below Poverty by Sex and Age in Mesquite
With 9.2% poverty level for males and 10.5% for females among the residents of Mesquite, 5 year old males and 5 year old females are the most vulnerable to poverty, with 46 males (55.4%) and 12 females (44.4%) in their respective age groups living below the poverty level.
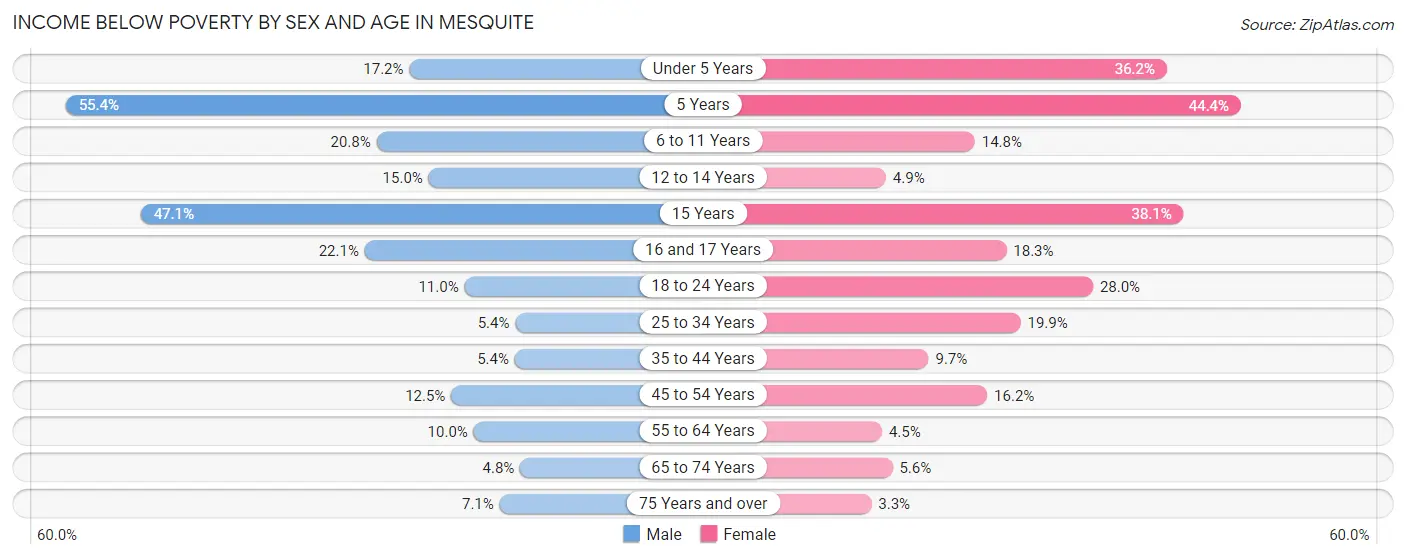
| Age Bracket | Male | Female |
| Under 5 Years | 77 (17.2%) | 114 (36.2%) |
| 5 Years | 46 (55.4%) | 12 (44.4%) |
| 6 to 11 Years | 68 (20.8%) | 65 (14.8%) |
| 12 to 14 Years | 51 (15.0%) | 11 (4.9%) |
| 15 Years | 24 (47.1%) | 67 (38.1%) |
| 16 and 17 Years | 46 (22.1%) | 46 (18.3%) |
| 18 to 24 Years | 58 (11.0%) | 99 (28.0%) |
| 25 to 34 Years | 37 (5.3%) | 133 (19.9%) |
| 35 to 44 Years | 53 (5.4%) | 51 (9.7%) |
| 45 to 54 Years | 111 (12.5%) | 185 (16.2%) |
| 55 to 64 Years | 108 (10.0%) | 70 (4.5%) |
| 65 to 74 Years | 130 (4.8%) | 157 (5.6%) |
| 75 Years and over | 149 (7.1%) | 54 (3.3%) |
| Total | 958 (9.2%) | 1,064 (10.5%) |
Income Above Poverty by Sex and Age in Mesquite
According to the poverty statistics in Mesquite, males aged 65 to 74 years and females aged 75 years and over are the age groups that are most secure financially, with 95.2% of males and 96.7% of females in these age groups living above the poverty line.
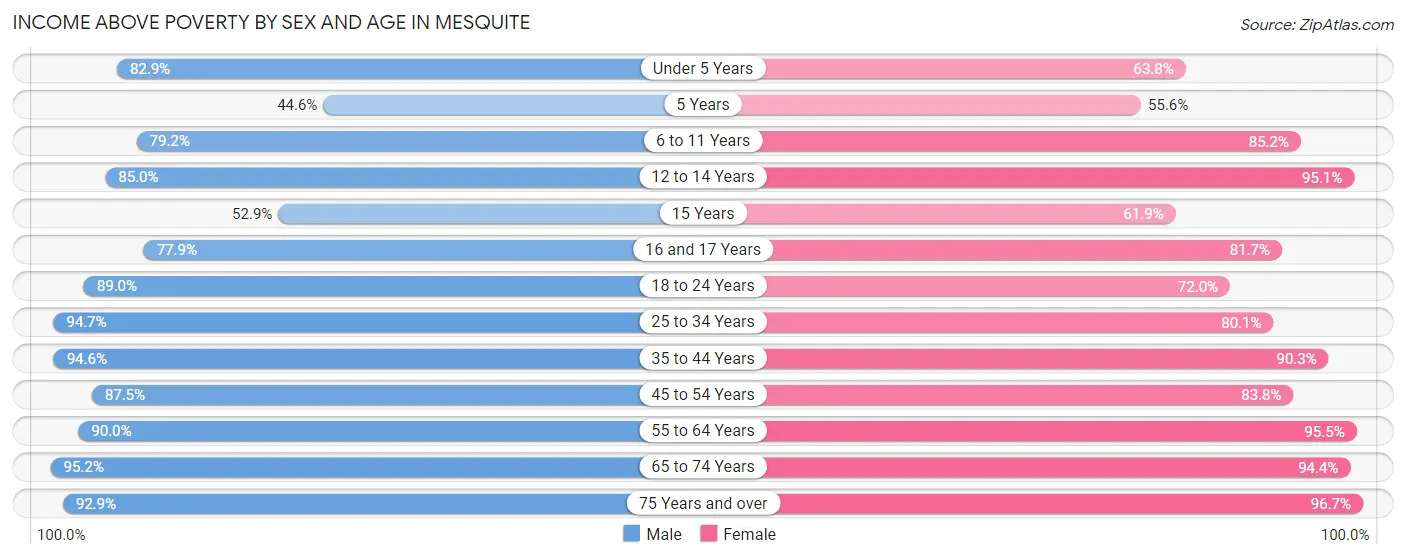
| Age Bracket | Male | Female |
| Under 5 Years | 372 (82.9%) | 201 (63.8%) |
| 5 Years | 37 (44.6%) | 15 (55.6%) |
| 6 to 11 Years | 259 (79.2%) | 374 (85.2%) |
| 12 to 14 Years | 289 (85.0%) | 213 (95.1%) |
| 15 Years | 27 (52.9%) | 109 (61.9%) |
| 16 and 17 Years | 162 (77.9%) | 205 (81.7%) |
| 18 to 24 Years | 469 (89.0%) | 255 (72.0%) |
| 25 to 34 Years | 654 (94.7%) | 535 (80.1%) |
| 35 to 44 Years | 927 (94.6%) | 477 (90.3%) |
| 45 to 54 Years | 778 (87.5%) | 958 (83.8%) |
| 55 to 64 Years | 973 (90.0%) | 1,497 (95.5%) |
| 65 to 74 Years | 2,574 (95.2%) | 2,625 (94.4%) |
| 75 Years and over | 1,950 (92.9%) | 1,589 (96.7%) |
| Total | 9,471 (90.8%) | 9,053 (89.5%) |
Income Below Poverty Among Married-Couple Families in Mesquite
The poverty statistics for married-couple families in Mesquite show that 4.2% or 219 of the total 5,254 families live below the poverty line. Families with 3 or 4 children have the highest poverty rate of 34.4%, comprising of 89 families. On the other hand, families with 5 or more children have the lowest poverty rate of 0.0%, which includes 0 families.
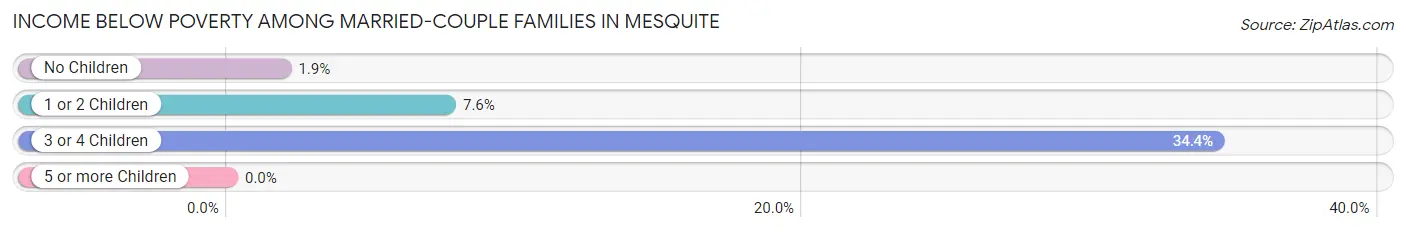
| Children | Above Poverty | Below Poverty |
| No Children | 4,263 (98.1%) | 81 (1.9%) |
| 1 or 2 Children | 597 (92.4%) | 49 (7.6%) |
| 3 or 4 Children | 170 (65.6%) | 89 (34.4%) |
| 5 or more Children | 5 (100.0%) | 0 (0.0%) |
| Total | 5,035 (95.8%) | 219 (4.2%) |
Income Below Poverty Among Single-Parent Households in Mesquite
According to the poverty data in Mesquite, 9.3% or 38 single-father households and 13.7% or 82 single-mother households are living below the poverty line. Among single-father households, those with 3 or 4 children have the highest poverty rate, with 16 households (18.8%) experiencing poverty. Likewise, among single-mother households, those with 1 or 2 children have the highest poverty rate, with 79 households (24.7%) falling below the poverty line.
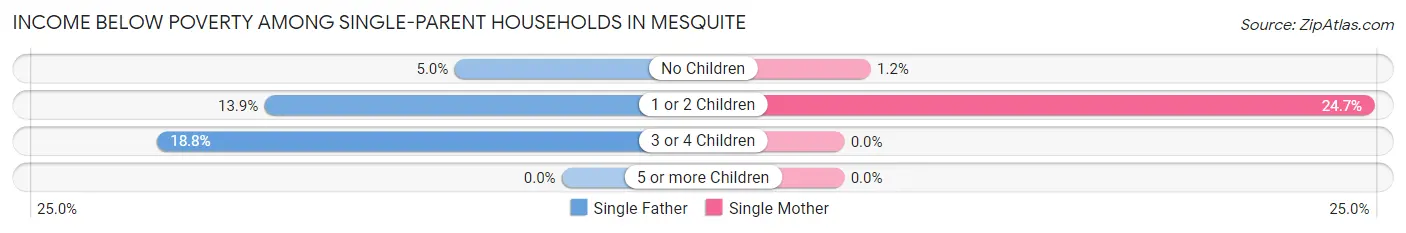
| Children | Single Father | Single Mother |
| No Children | 13 (5.0%) | 3 (1.2%) |
| 1 or 2 Children | 9 (13.9%) | 79 (24.7%) |
| 3 or 4 Children | 16 (18.8%) | 0 (0.0%) |
| 5 or more Children | 0 (0.0%) | 0 (0.0%) |
| Total | 38 (9.3%) | 82 (13.7%) |
Income Below Poverty Among Married-Couple vs Single-Parent Households in Mesquite
The poverty data for Mesquite shows that 219 of the married-couple family households (4.2%) and 120 of the single-parent households (11.9%) are living below the poverty level. Within the married-couple family households, those with 3 or 4 children have the highest poverty rate, with 89 households (34.4%) falling below the poverty line. Among the single-parent households, those with 1 or 2 children have the highest poverty rate, with 88 household (22.9%) living below poverty.
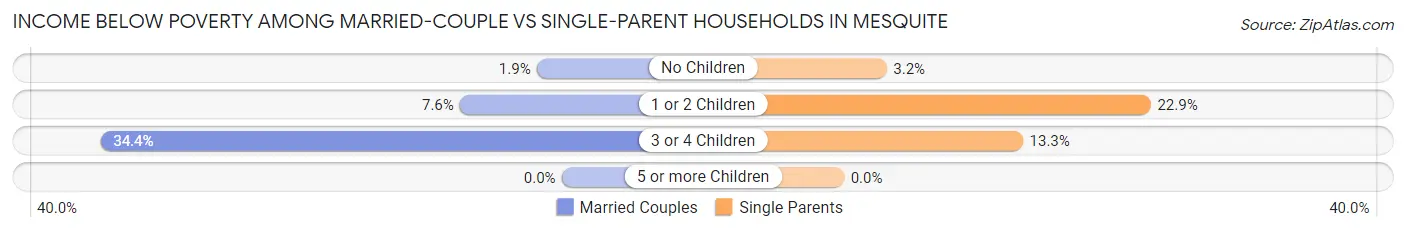
| Children | Married-Couple Families | Single-Parent Households |
| No Children | 81 (1.9%) | 16 (3.2%) |
| 1 or 2 Children | 49 (7.6%) | 88 (22.9%) |
| 3 or 4 Children | 89 (34.4%) | 16 (13.3%) |
| 5 or more Children | 0 (0.0%) | 0 (0.0%) |
| Total | 219 (4.2%) | 120 (11.9%) |
Race in Mesquite
The most populous races in Mesquite are White / Caucasian (16,400 | 79.4%), Hispanic or Latino (5,218 | 25.3%), and Two or more Races (2,072 | 10.0%).
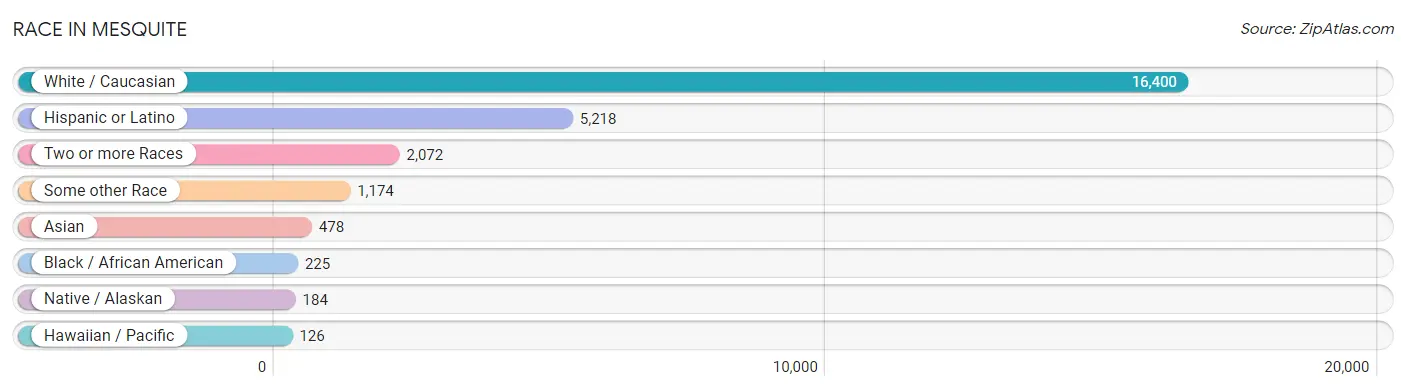
| Race | # Population | % Population |
| Asian | 478 | 2.3% |
| Black / African American | 225 | 1.1% |
| Hawaiian / Pacific | 126 | 0.6% |
| Hispanic or Latino | 5,218 | 25.3% |
| Native / Alaskan | 184 | 0.9% |
| White / Caucasian | 16,400 | 79.4% |
| Two or more Races | 2,072 | 10.0% |
| Some other Race | 1,174 | 5.7% |
| Total | 20,659 | 100.0% |
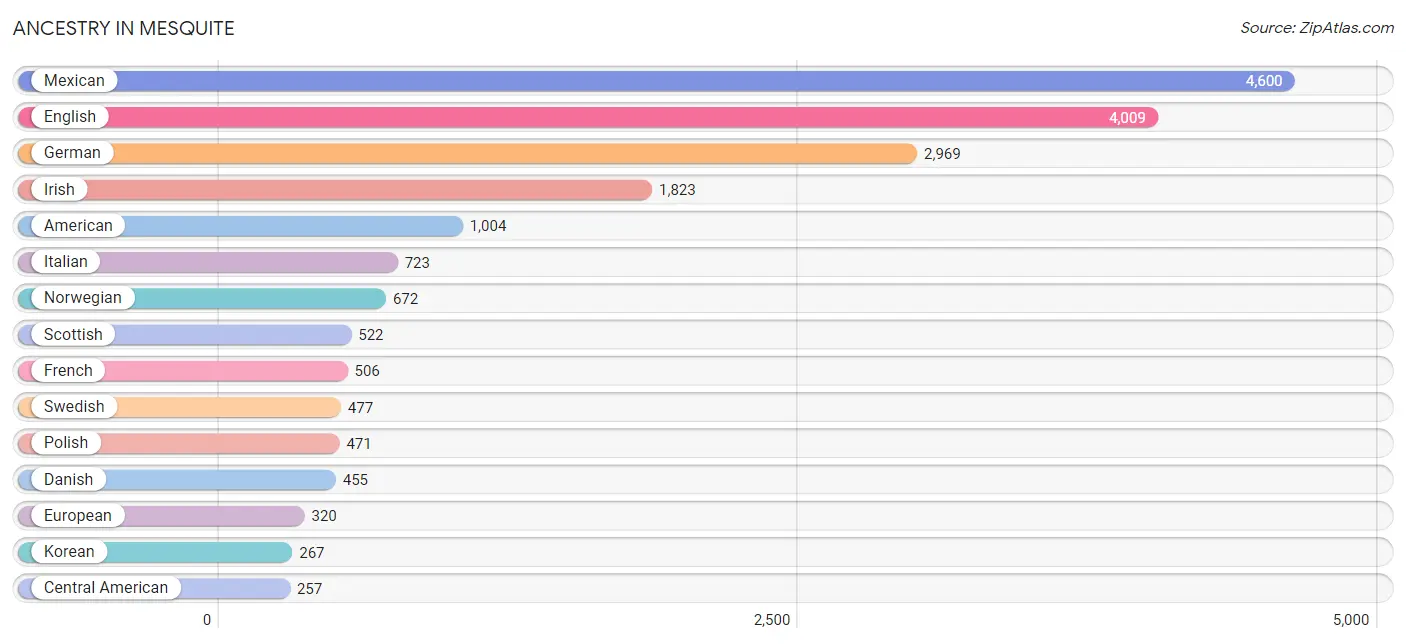
Ancestry in Mesquite
The most populous ancestries reported in Mesquite are Mexican (4,600 | 22.3%), English (4,009 | 19.4%), German (2,969 | 14.4%), Irish (1,823 | 8.8%), and American (1,004 | 4.9%), together accounting for 69.7% of all Mesquite residents.
| Ancestry | # Population | % Population |
| Alaskan Athabascan | 4 | 0.0% |
| American | 1,004 | 4.9% |
| Apache | 7 | 0.0% |
| Argentinean | 9 | 0.0% |
| Armenian | 36 | 0.2% |
| Australian | 24 | 0.1% |
| Austrian | 60 | 0.3% |
| Basque | 72 | 0.4% |
| Belgian | 26 | 0.1% |
| Bhutanese | 38 | 0.2% |
| Blackfeet | 6 | 0.0% |
| Brazilian | 8 | 0.0% |
| British | 139 | 0.7% |
| Burmese | 61 | 0.3% |
| Canadian | 41 | 0.2% |
| Central American | 257 | 1.2% |
| Central American Indian | 29 | 0.1% |
| Cherokee | 17 | 0.1% |
| Chippewa | 13 | 0.1% |
| Choctaw | 32 | 0.2% |
| Colombian | 9 | 0.0% |
| Croatian | 26 | 0.1% |
| Cuban | 82 | 0.4% |
| Czech | 64 | 0.3% |
| Czechoslovakian | 8 | 0.0% |
| Danish | 455 | 2.2% |
| Dutch | 232 | 1.1% |
| Eastern European | 32 | 0.2% |
| English | 4,009 | 19.4% |
| European | 320 | 1.5% |
| Filipino | 15 | 0.1% |
| Finnish | 48 | 0.2% |
| French | 506 | 2.5% |
| French American Indian | 2 | 0.0% |
| French Canadian | 138 | 0.7% |
| German | 2,969 | 14.4% |
| Greek | 170 | 0.8% |
| Guatemalan | 163 | 0.8% |
| Honduran | 30 | 0.2% |
| Hungarian | 75 | 0.4% |
| Icelander | 23 | 0.1% |
| Indian (Asian) | 114 | 0.5% |
| Iranian | 5 | 0.0% |
| Irish | 1,823 | 8.8% |
| Iroquois | 16 | 0.1% |
| Italian | 723 | 3.5% |
| Korean | 267 | 1.3% |
| Lithuanian | 37 | 0.2% |
| Mexican | 4,600 | 22.3% |
| Mexican American Indian | 30 | 0.2% |
| Native Hawaiian | 180 | 0.9% |
| Navajo | 27 | 0.1% |
| Nicaraguan | 33 | 0.2% |
| Northern European | 59 | 0.3% |
| Norwegian | 672 | 3.3% |
| Osage | 7 | 0.0% |
| Pakistani | 59 | 0.3% |
| Panamanian | 8 | 0.0% |
| Peruvian | 14 | 0.1% |
| Polish | 471 | 2.3% |
| Portuguese | 107 | 0.5% |
| Puerto Rican | 18 | 0.1% |
| Romanian | 12 | 0.1% |
| Russian | 101 | 0.5% |
| Salvadoran | 23 | 0.1% |
| Samoan | 71 | 0.3% |
| Scandinavian | 91 | 0.4% |
| Scotch-Irish | 106 | 0.5% |
| Scottish | 522 | 2.5% |
| Serbian | 8 | 0.0% |
| Shoshone | 7 | 0.0% |
| Slovak | 8 | 0.0% |
| Slovene | 16 | 0.1% |
| South American | 32 | 0.2% |
| Spaniard | 33 | 0.2% |
| Spanish | 112 | 0.5% |
| Spanish American | 18 | 0.1% |
| Subsaharan African | 12 | 0.1% |
| Swedish | 477 | 2.3% |
| Swiss | 209 | 1.0% |
| Thai | 9 | 0.0% |
| Tongan | 5 | 0.0% |
| Turkish | 10 | 0.1% |
| Welsh | 246 | 1.2% |
| Yuman | 3 | 0.0% | View All 85 Rows |
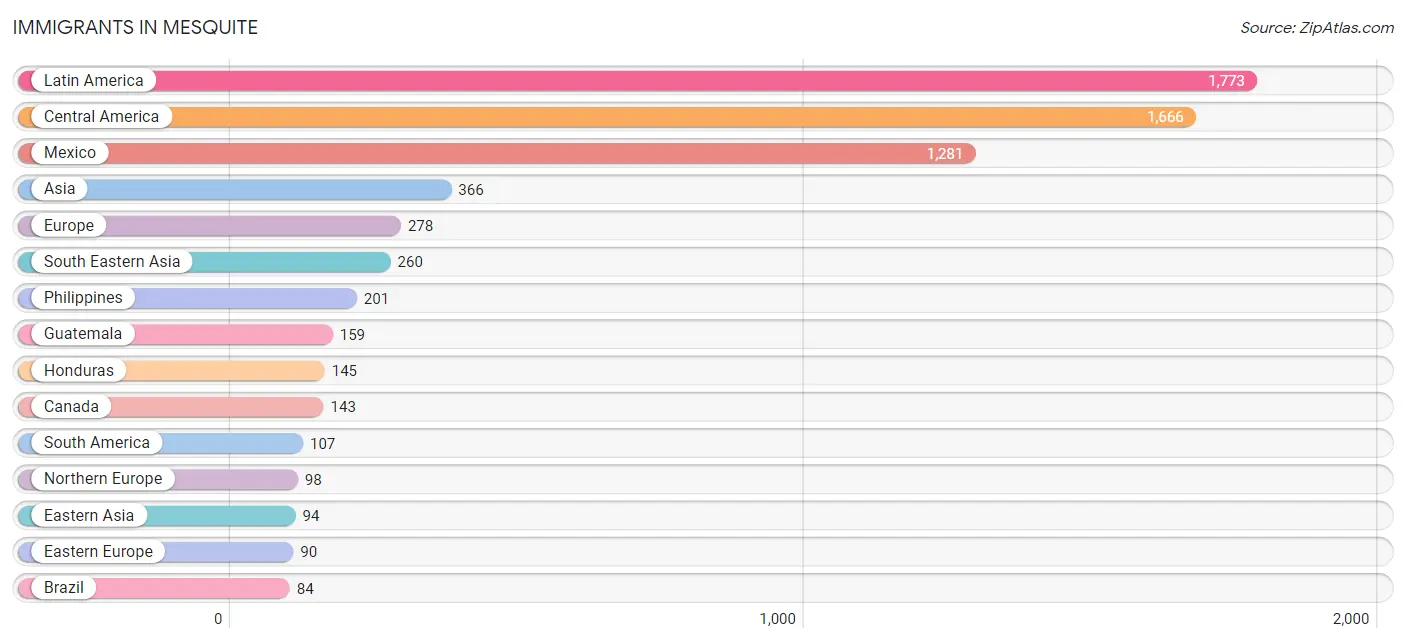
Immigrants in Mesquite
The most numerous immigrant groups reported in Mesquite came from Latin America (1,773 | 8.6%), Central America (1,666 | 8.1%), Mexico (1,281 | 6.2%), Asia (366 | 1.8%), and Europe (278 | 1.3%), together accounting for 26.0% of all Mesquite residents.
| Immigration Origin | # Population | % Population |
| Argentina | 9 | 0.0% |
| Asia | 366 | 1.8% |
| Australia | 24 | 0.1% |
| Brazil | 84 | 0.4% |
| Canada | 143 | 0.7% |
| Central America | 1,666 | 8.1% |
| China | 41 | 0.2% |
| Costa Rica | 55 | 0.3% |
| Eastern Asia | 94 | 0.5% |
| Eastern Europe | 90 | 0.4% |
| El Salvador | 6 | 0.0% |
| England | 49 | 0.2% |
| Europe | 278 | 1.3% |
| France | 54 | 0.3% |
| Germany | 30 | 0.2% |
| Guatemala | 159 | 0.8% |
| Honduras | 145 | 0.7% |
| Hong Kong | 7 | 0.0% |
| Iran | 5 | 0.0% |
| Ireland | 14 | 0.1% |
| Korea | 53 | 0.3% |
| Latin America | 1,773 | 8.6% |
| Lebanon | 7 | 0.0% |
| Mexico | 1,281 | 6.2% |
| North Macedonia | 10 | 0.1% |
| Northern Europe | 98 | 0.5% |
| Norway | 26 | 0.1% |
| Oceania | 24 | 0.1% |
| Panama | 20 | 0.1% |
| Peru | 14 | 0.1% |
| Philippines | 201 | 1.0% |
| Poland | 49 | 0.2% |
| Russia | 31 | 0.2% |
| South America | 107 | 0.5% |
| South Central Asia | 5 | 0.0% |
| South Eastern Asia | 260 | 1.3% |
| Southern Europe | 6 | 0.0% |
| Spain | 6 | 0.0% |
| Sweden | 5 | 0.0% |
| Taiwan | 7 | 0.0% |
| Thailand | 59 | 0.3% |
| Western Asia | 7 | 0.0% |
| Western Europe | 84 | 0.4% | View All 43 Rows |
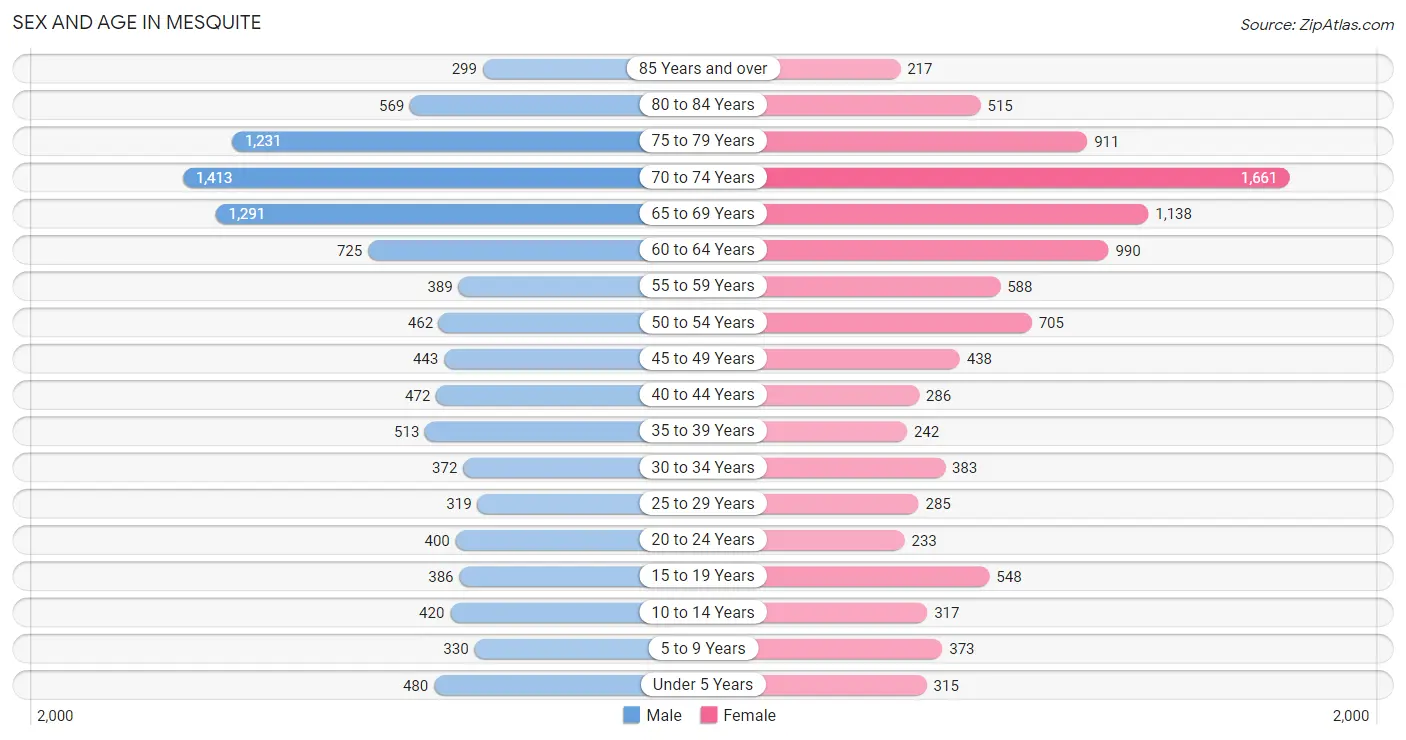
Sex and Age in Mesquite
Sex and Age in Mesquite
The most populous age groups in Mesquite are 70 to 74 Years (1,413 | 13.4%) for men and 70 to 74 Years (1,661 | 16.4%) for women.
| Age Bracket | Male | Female |
| Under 5 Years | 480 (4.6%) | 315 (3.1%) |
| 5 to 9 Years | 330 (3.1%) | 373 (3.7%) |
| 10 to 14 Years | 420 (4.0%) | 317 (3.1%) |
| 15 to 19 Years | 386 (3.7%) | 548 (5.4%) |
| 20 to 24 Years | 400 (3.8%) | 233 (2.3%) |
| 25 to 29 Years | 319 (3.0%) | 285 (2.8%) |
| 30 to 34 Years | 372 (3.5%) | 383 (3.8%) |
| 35 to 39 Years | 513 (4.9%) | 242 (2.4%) |
| 40 to 44 Years | 472 (4.5%) | 286 (2.8%) |
| 45 to 49 Years | 443 (4.2%) | 438 (4.3%) |
| 50 to 54 Years | 462 (4.4%) | 705 (7.0%) |
| 55 to 59 Years | 389 (3.7%) | 588 (5.8%) |
| 60 to 64 Years | 725 (6.9%) | 990 (9.8%) |
| 65 to 69 Years | 1,291 (12.3%) | 1,138 (11.2%) |
| 70 to 74 Years | 1,413 (13.4%) | 1,661 (16.4%) |
| 75 to 79 Years | 1,231 (11.7%) | 911 (9.0%) |
| 80 to 84 Years | 569 (5.4%) | 515 (5.1%) |
| 85 Years and over | 299 (2.8%) | 217 (2.1%) |
| Total | 10,514 (100.0%) | 10,145 (100.0%) |
Families and Households in Mesquite
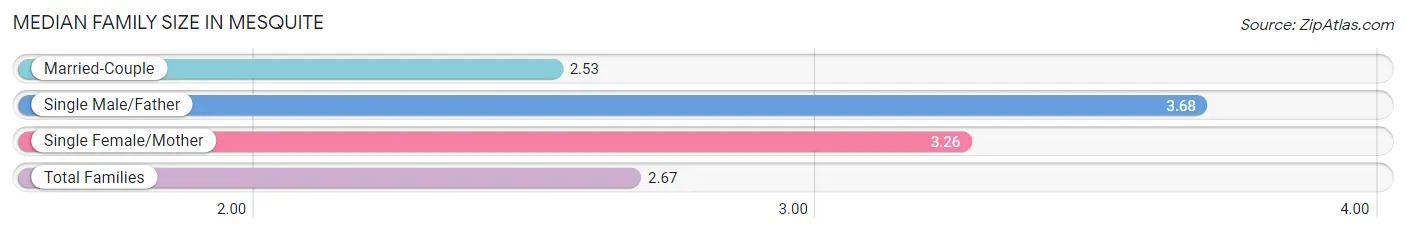
Median Family Size in Mesquite
The median family size in Mesquite is 2.67 persons per family, with single male/father families (410 | 6.6%) accounting for the largest median family size of 3.68 persons per family. On the other hand, married-couple families (5,254 | 83.9%) represent the smallest median family size with 2.53 persons per family.
| Family Type | # Families | Family Size |
| Married-Couple | 5,254 (83.9%) | 2.53 |
| Single Male/Father | 410 (6.6%) | 3.68 |
| Single Female/Mother | 598 (9.6%) | 3.26 |
| Total Families | 6,262 (100.0%) | 2.67 |
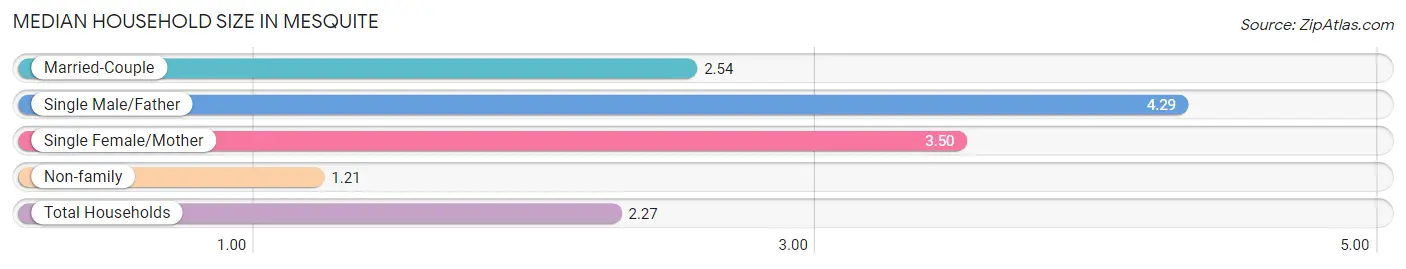
Median Household Size in Mesquite
The median household size in Mesquite is 2.27 persons per household, with single male/father households (410 | 4.5%) accounting for the largest median household size of 4.29 persons per household. non-family households (2,786 | 30.8%) represent the smallest median household size with 1.21 persons per household.
| Household Type | # Households | Household Size |
| Married-Couple | 5,254 (58.1%) | 2.54 |
| Single Male/Father | 410 (4.5%) | 4.29 |
| Single Female/Mother | 598 (6.6%) | 3.50 |
| Non-family | 2,786 (30.8%) | 1.21 |
| Total Households | 9,048 (100.0%) | 2.27 |
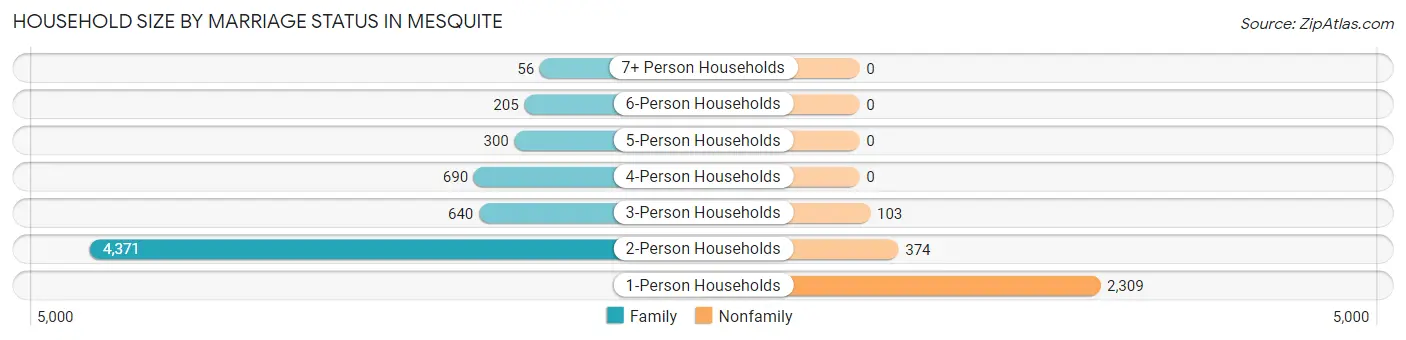
Household Size by Marriage Status in Mesquite
Out of a total of 9,048 households in Mesquite, 6,262 (69.2%) are family households, while 2,786 (30.8%) are nonfamily households. The most numerous type of family households are 2-person households, comprising 4,371, and the most common type of nonfamily households are 1-person households, comprising 2,309.
| Household Size | Family Households | Nonfamily Households |
| 1-Person Households | - | 2,309 (25.5%) |
| 2-Person Households | 4,371 (48.3%) | 374 (4.1%) |
| 3-Person Households | 640 (7.1%) | 103 (1.1%) |
| 4-Person Households | 690 (7.6%) | 0 (0.0%) |
| 5-Person Households | 300 (3.3%) | 0 (0.0%) |
| 6-Person Households | 205 (2.3%) | 0 (0.0%) |
| 7+ Person Households | 56 (0.6%) | 0 (0.0%) |
| Total | 6,262 (69.2%) | 2,786 (30.8%) |
Female Fertility in Mesquite
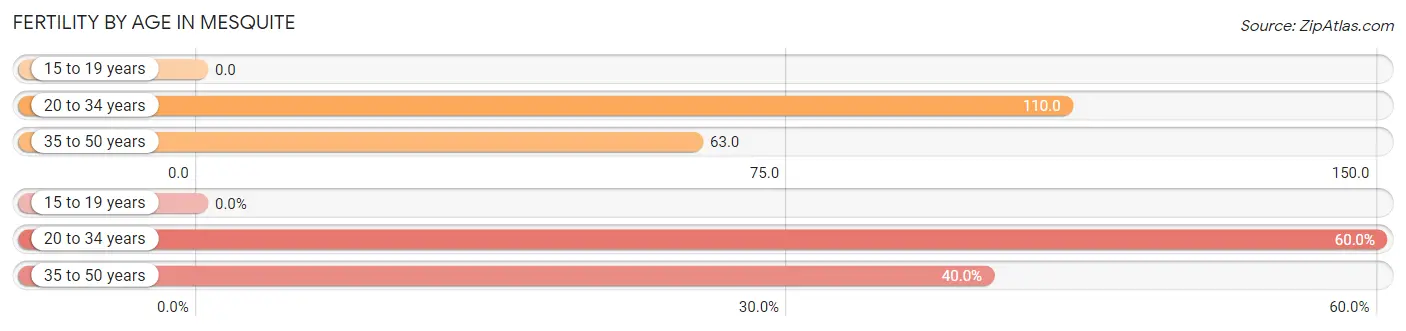
Fertility by Age in Mesquite
Average fertility rate in Mesquite is 66.0 births per 1,000 women. Women in the age bracket of 20 to 34 years have the highest fertility rate with 110.0 births per 1,000 women. Women in the age bracket of 20 to 34 years acount for 60.0% of all women with births.
| Age Bracket | Women with Births | Births / 1,000 Women |
| 15 to 19 years | 0 (0.0%) | 0.0 |
| 20 to 34 years | 99 (60.0%) | 110.0 |
| 35 to 50 years | 66 (40.0%) | 63.0 |
| Total | 165 (100.0%) | 66.0 |
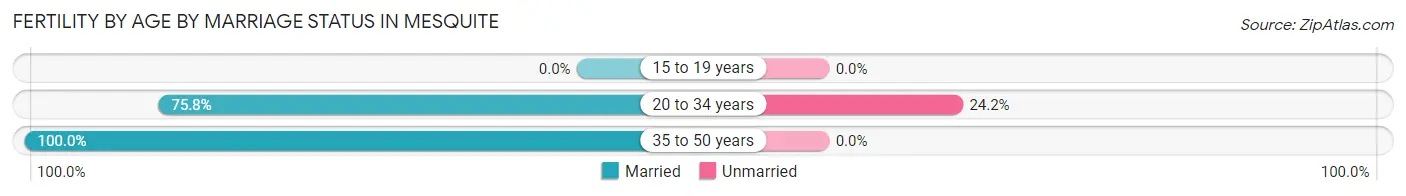
Fertility by Age by Marriage Status in Mesquite
85.5% of women with births (165) in Mesquite are married. The highest percentage of unmarried women with births falls into 20 to 34 years age bracket with 24.2% of them unmarried at the time of birth, while the lowest percentage of unmarried women with births belong to 35 to 50 years age bracket with 0.0% of them unmarried.
| Age Bracket | Married | Unmarried |
| 15 to 19 years | 0 (0.0%) | 0 (0.0%) |
| 20 to 34 years | 75 (75.8%) | 24 (24.2%) |
| 35 to 50 years | 66 (100.0%) | 0 (0.0%) |
| Total | 141 (85.5%) | 24 (14.5%) |
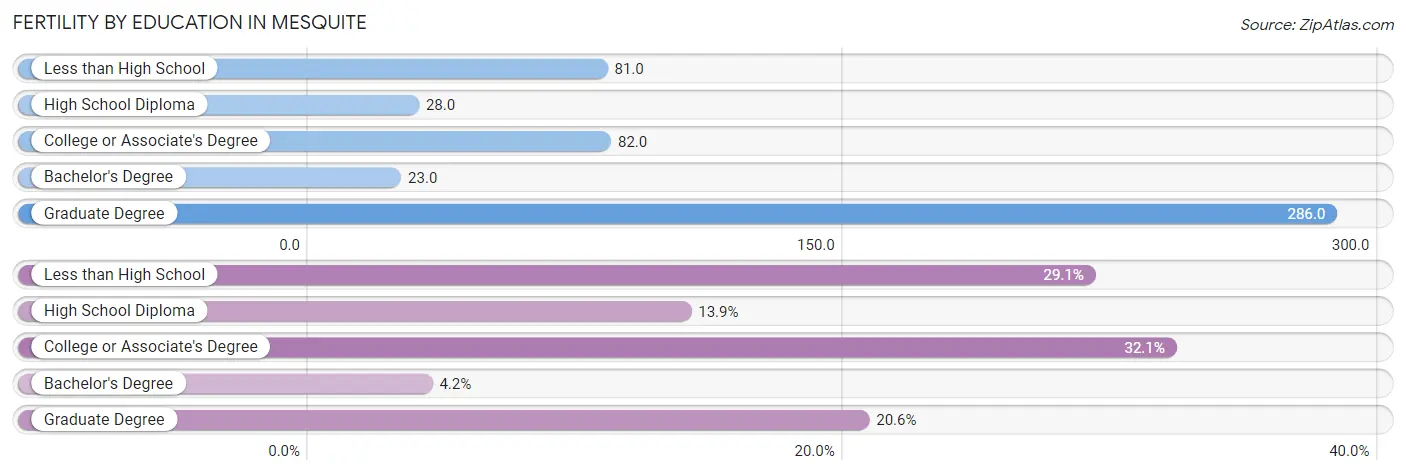
Fertility by Education in Mesquite
Average fertility rate in Mesquite is 66.0 births per 1,000 women. Women with the education attainment of graduate degree have the highest fertility rate of 286.0 births per 1,000 women, while women with the education attainment of bachelor's degree have the lowest fertility at 23.0 births per 1,000 women. Women with the education attainment of college or associate's degree represent 32.1% of all women with births.
| Educational Attainment | Women with Births | Births / 1,000 Women |
| Less than High School | 48 (29.1%) | 81.0 |
| High School Diploma | 23 (13.9%) | 28.0 |
| College or Associate's Degree | 53 (32.1%) | 82.0 |
| Bachelor's Degree | 7 (4.2%) | 23.0 |
| Graduate Degree | 34 (20.6%) | 286.0 |
| Total | 165 (100.0%) | 66.0 |
Fertility by Education by Marriage Status in Mesquite
14.5% of women with births in Mesquite are unmarried. Women with the educational attainment of less than high school are most likely to be married with 100.0% of them married at childbirth, while women with the educational attainment of college or associate's degree are least likely to be married with 45.3% of them unmarried at childbirth.
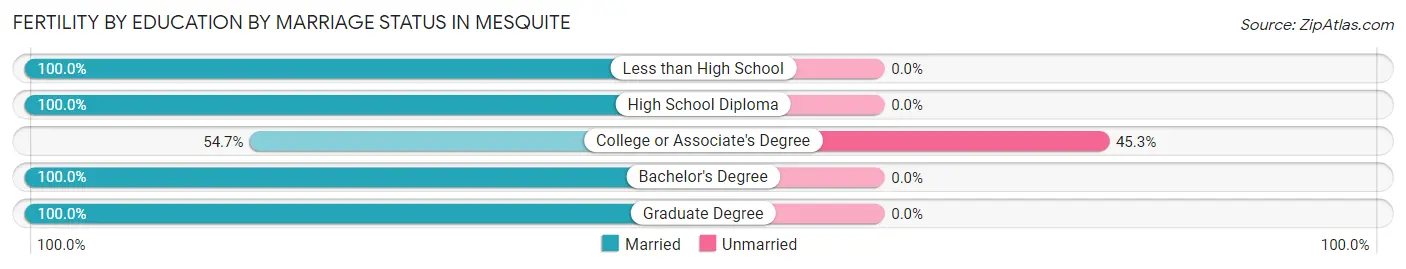
| Educational Attainment | Married | Unmarried |
| Less than High School | 48 (100.0%) | 0 (0.0%) |
| High School Diploma | 23 (100.0%) | 0 (0.0%) |
| College or Associate's Degree | 29 (54.7%) | 24 (45.3%) |
| Bachelor's Degree | 7 (100.0%) | 0 (0.0%) |
| Graduate Degree | 34 (100.0%) | 0 (0.0%) |
| Total | 141 (85.5%) | 24 (14.5%) |
Employment Characteristics in Mesquite
Employment by Class of Employer in Mesquite
Among the 6,201 employed individuals in Mesquite, private company employees (5,064 | 81.7%), self-employed (incorporated) (335 | 5.4%), and local government employees (305 | 4.9%) make up the most common classes of employment.
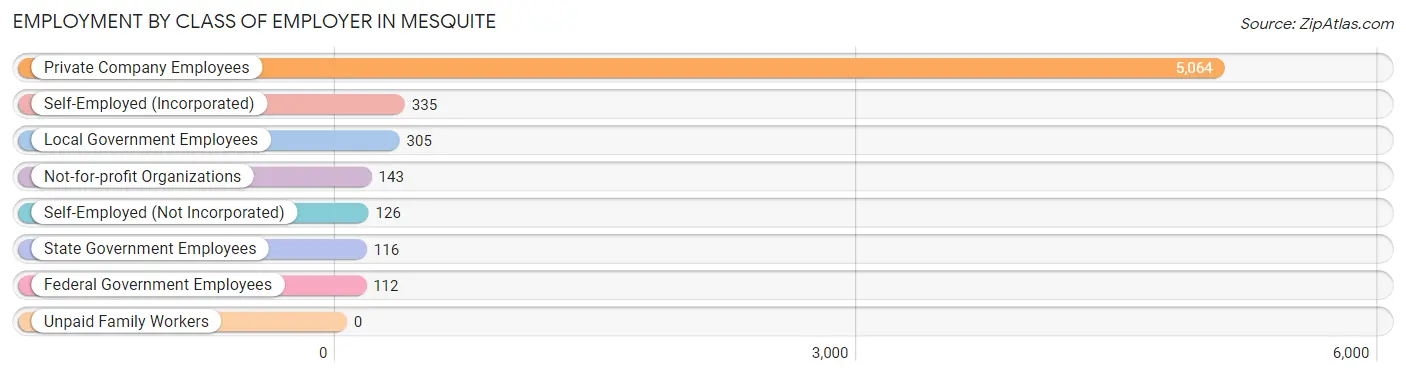
| Employer Class | # Employees | % Employees |
| Private Company Employees | 5,064 | 81.7% |
| Self-Employed (Incorporated) | 335 | 5.4% |
| Self-Employed (Not Incorporated) | 126 | 2.0% |
| Not-for-profit Organizations | 143 | 2.3% |
| Local Government Employees | 305 | 4.9% |
| State Government Employees | 116 | 1.9% |
| Federal Government Employees | 112 | 1.8% |
| Unpaid Family Workers | 0 | 0.0% |
| Total | 6,201 | 100.0% |
Employment Status by Age in Mesquite
According to the labor force statistics for Mesquite, out of the total population over 16 years of age (18,197), 37.8% or 6,878 individuals are in the labor force, with 7.6% or 523 of them unemployed. The age group with the highest labor force participation rate is 30 to 34 years, with 94.2% or 711 individuals in the labor force. Within the labor force, the 30 to 34 years age range has the highest percentage of unemployed individuals, with 13.1% or 93 of them being unemployed.
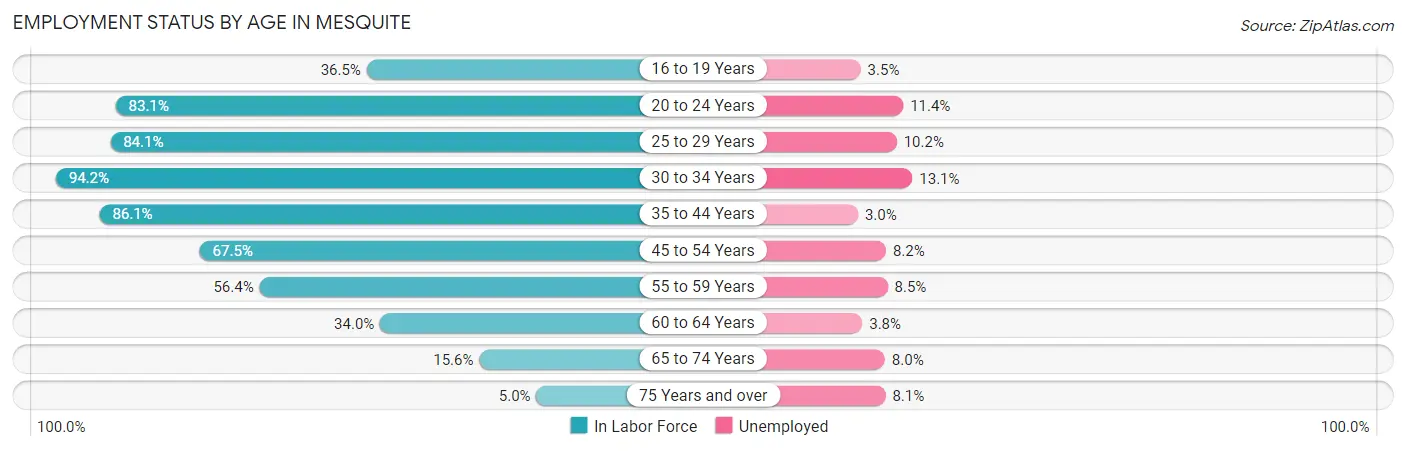
| Age Bracket | In Labor Force | Unemployed |
| 16 to 19 Years | 258 (36.5%) | 9 (3.5%) |
| 20 to 24 Years | 526 (83.1%) | 60 (11.4%) |
| 25 to 29 Years | 508 (84.1%) | 52 (10.2%) |
| 30 to 34 Years | 711 (94.2%) | 93 (13.1%) |
| 35 to 44 Years | 1,303 (86.1%) | 39 (3.0%) |
| 45 to 54 Years | 1,382 (67.5%) | 113 (8.2%) |
| 55 to 59 Years | 551 (56.4%) | 47 (8.5%) |
| 60 to 64 Years | 583 (34.0%) | 22 (3.8%) |
| 65 to 74 Years | 858 (15.6%) | 69 (8.0%) |
| 75 Years and over | 187 (5.0%) | 15 (8.1%) |
| Total | 6,878 (37.8%) | 523 (7.6%) |
Employment Status by Educational Attainment in Mesquite
According to labor force statistics for Mesquite, 66.2% of individuals (5,039) out of the total population between 25 and 64 years of age (7,612) are in the labor force, with 7.3% or 368 of them being unemployed. The group with the highest labor force participation rate are those with the educational attainment of high school diploma, with 71.1% or 2,190 individuals in the labor force. Within the labor force, individuals with less than high school education have the highest percentage of unemployment, with 12.2% or 62 of them being unemployed.
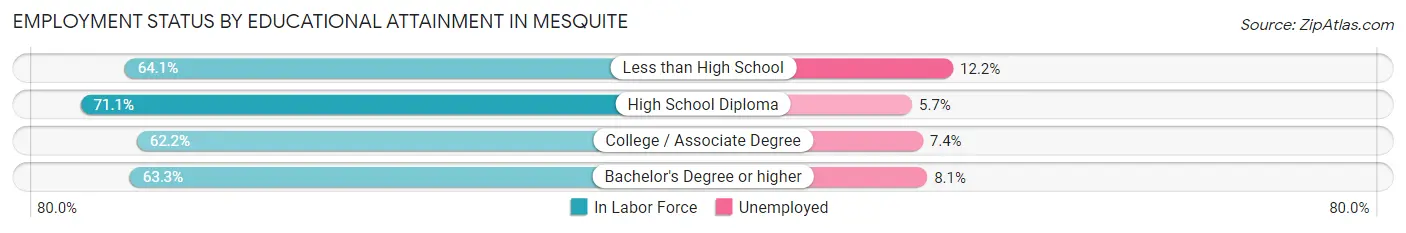
| Educational Attainment | In Labor Force | Unemployed |
| Less than High School | 510 (64.1%) | 97 (12.2%) |
| High School Diploma | 2,190 (71.1%) | 176 (5.7%) |
| College / Associate Degree | 1,358 (62.2%) | 162 (7.4%) |
| Bachelor's Degree or higher | 983 (63.3%) | 126 (8.1%) |
| Total | 5,039 (66.2%) | 556 (7.3%) |
Employment Occupations by Sex in Mesquite
Management, Business, Science and Arts Occupations
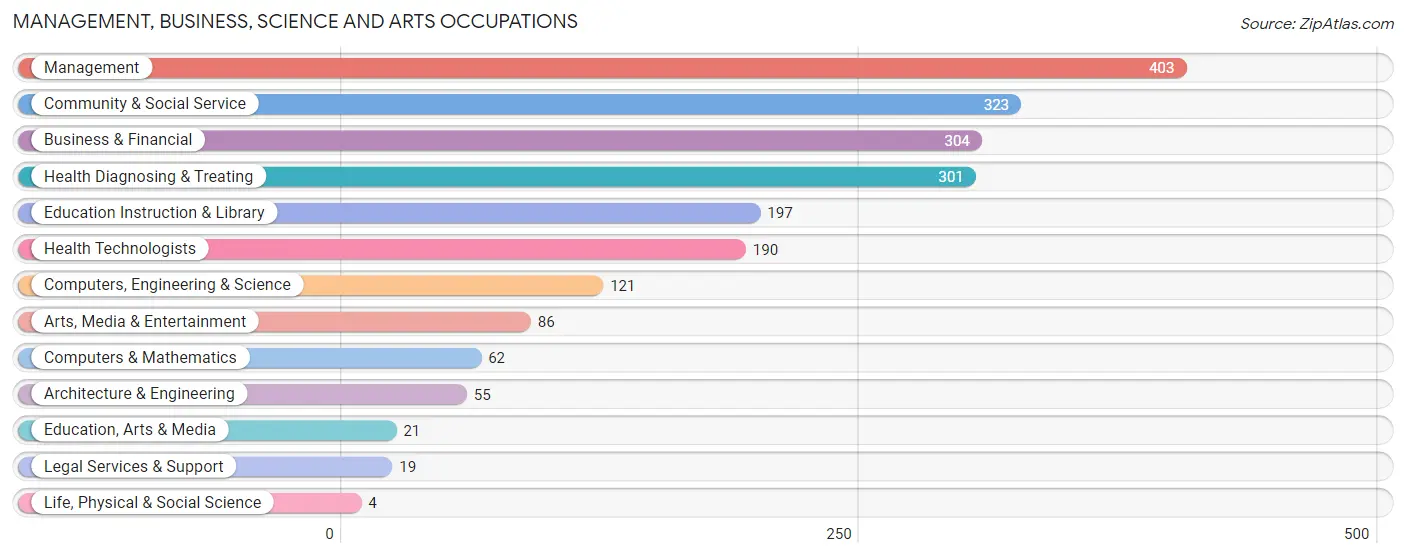
The most common Management, Business, Science and Arts occupations in Mesquite are Management (403 | 6.4%), Community & Social Service (323 | 5.1%), Business & Financial (304 | 4.8%), Health Diagnosing & Treating (301 | 4.7%), and Education Instruction & Library (197 | 3.1%).
Management, Business, Science and Arts Occupations by Sex
Within the Management, Business, Science and Arts occupations in Mesquite, the most male-oriented occupations are Computers & Mathematics (100.0%), Life, Physical & Social Science (100.0%), and Education, Arts & Media (100.0%), while the most female-oriented occupations are Health Technologists (85.3%), Health Diagnosing & Treating (74.4%), and Education Instruction & Library (59.4%).
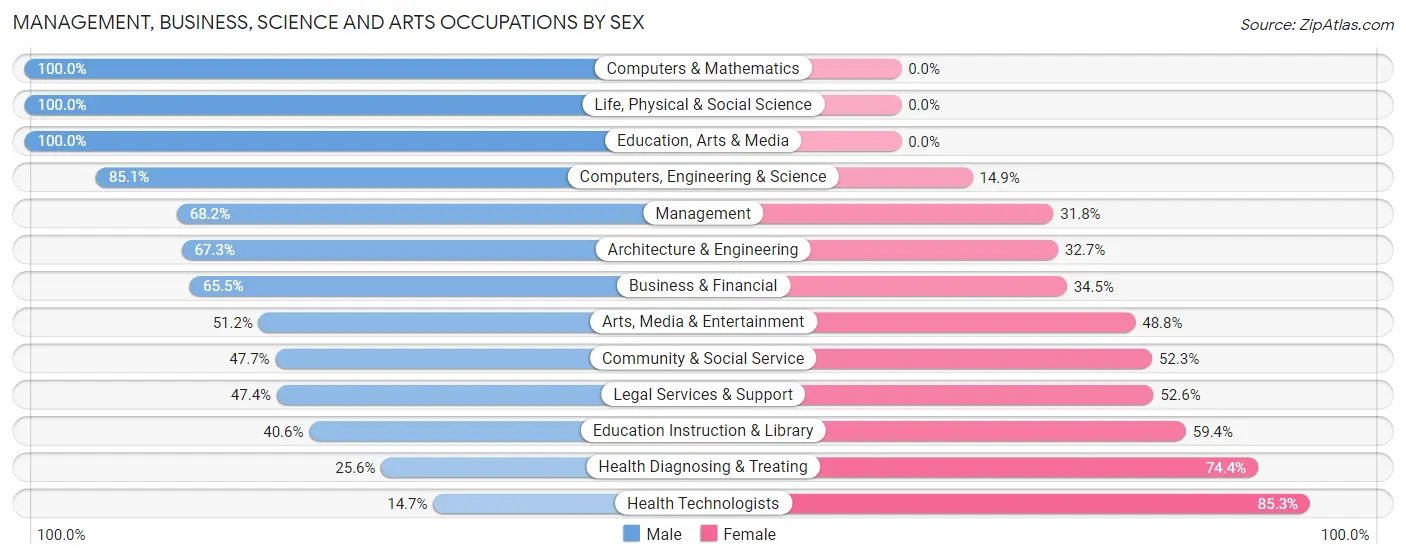
| Occupation | Male | Female |
| Management | 275 (68.2%) | 128 (31.8%) |
| Business & Financial | 199 (65.5%) | 105 (34.5%) |
| Computers, Engineering & Science | 103 (85.1%) | 18 (14.9%) |
| Computers & Mathematics | 62 (100.0%) | 0 (0.0%) |
| Architecture & Engineering | 37 (67.3%) | 18 (32.7%) |
| Life, Physical & Social Science | 4 (100.0%) | 0 (0.0%) |
| Community & Social Service | 154 (47.7%) | 169 (52.3%) |
| Education, Arts & Media | 21 (100.0%) | 0 (0.0%) |
| Legal Services & Support | 9 (47.4%) | 10 (52.6%) |
| Education Instruction & Library | 80 (40.6%) | 117 (59.4%) |
| Arts, Media & Entertainment | 44 (51.2%) | 42 (48.8%) |
| Health Diagnosing & Treating | 77 (25.6%) | 224 (74.4%) |
| Health Technologists | 28 (14.7%) | 162 (85.3%) |
| Total (Category) | 808 (55.6%) | 644 (44.4%) |
| Total (Overall) | 3,610 (56.8%) | 2,741 (43.2%) |
Services Occupations
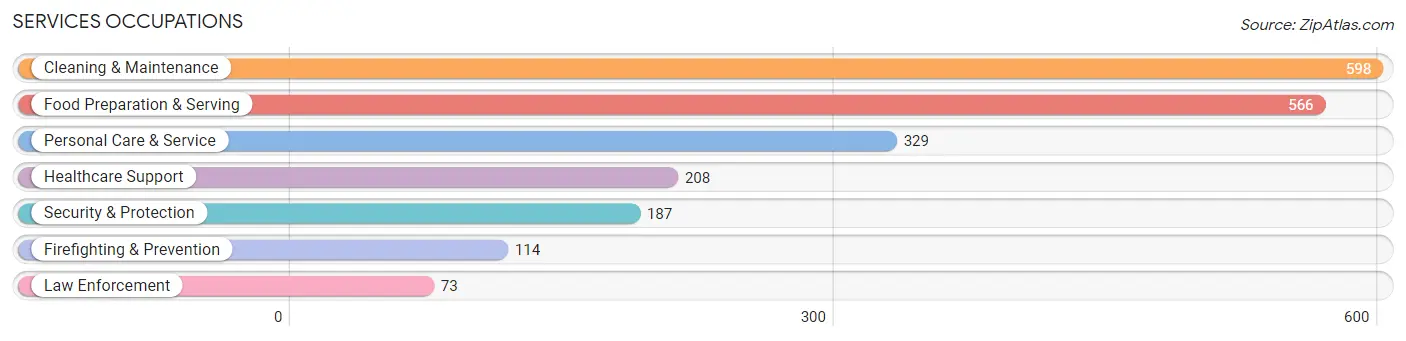
The most common Services occupations in Mesquite are Cleaning & Maintenance (598 | 9.4%), Food Preparation & Serving (566 | 8.9%), Personal Care & Service (329 | 5.2%), Healthcare Support (208 | 3.3%), and Security & Protection (187 | 2.9%).
Services Occupations by Sex
Within the Services occupations in Mesquite, the most male-oriented occupations are Law Enforcement (94.5%), Security & Protection (74.9%), and Cleaning & Maintenance (64.9%), while the most female-oriented occupations are Healthcare Support (91.3%), Personal Care & Service (62.6%), and Food Preparation & Serving (45.2%).
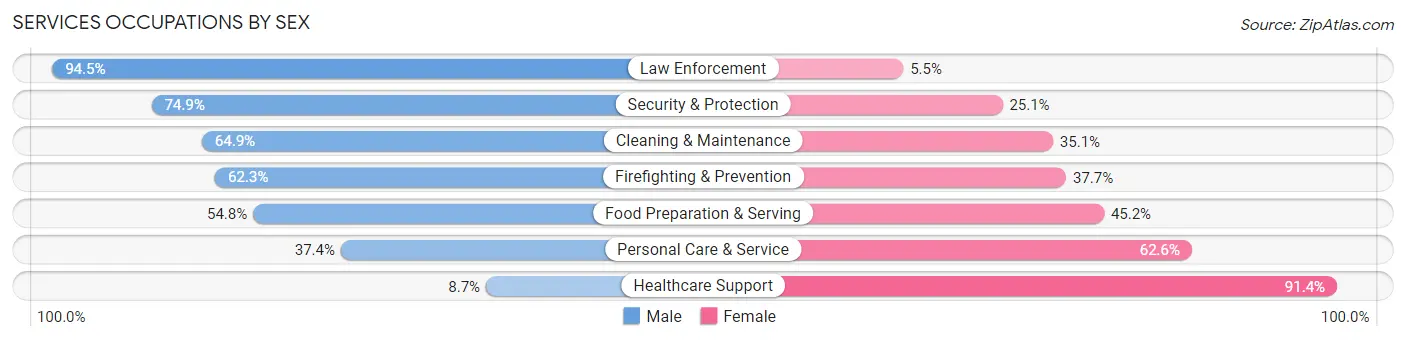
| Occupation | Male | Female |
| Healthcare Support | 18 (8.6%) | 190 (91.3%) |
| Security & Protection | 140 (74.9%) | 47 (25.1%) |
| Firefighting & Prevention | 71 (62.3%) | 43 (37.7%) |
| Law Enforcement | 69 (94.5%) | 4 (5.5%) |
| Food Preparation & Serving | 310 (54.8%) | 256 (45.2%) |
| Cleaning & Maintenance | 388 (64.9%) | 210 (35.1%) |
| Personal Care & Service | 123 (37.4%) | 206 (62.6%) |
| Total (Category) | 979 (51.8%) | 909 (48.1%) |
| Total (Overall) | 3,610 (56.8%) | 2,741 (43.2%) |
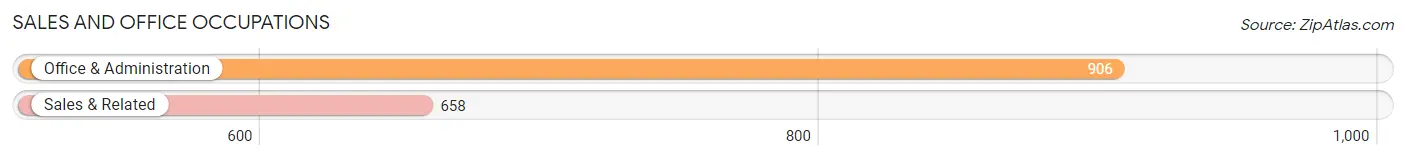
Sales and Office Occupations
The most common Sales and Office occupations in Mesquite are Office & Administration (906 | 14.3%), and Sales & Related (658 | 10.4%).
Sales and Office Occupations by Sex
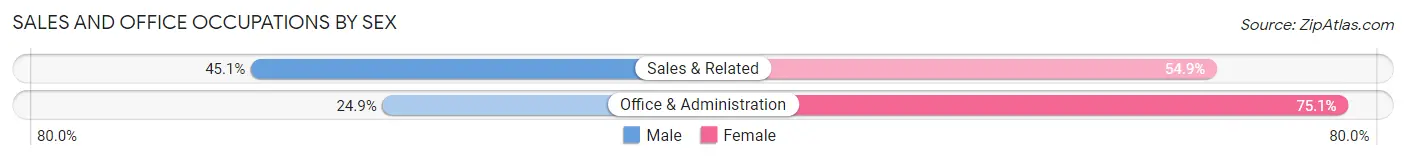
| Occupation | Male | Female |
| Sales & Related | 297 (45.1%) | 361 (54.9%) |
| Office & Administration | 226 (24.9%) | 680 (75.1%) |
| Total (Category) | 523 (33.4%) | 1,041 (66.6%) |
| Total (Overall) | 3,610 (56.8%) | 2,741 (43.2%) |
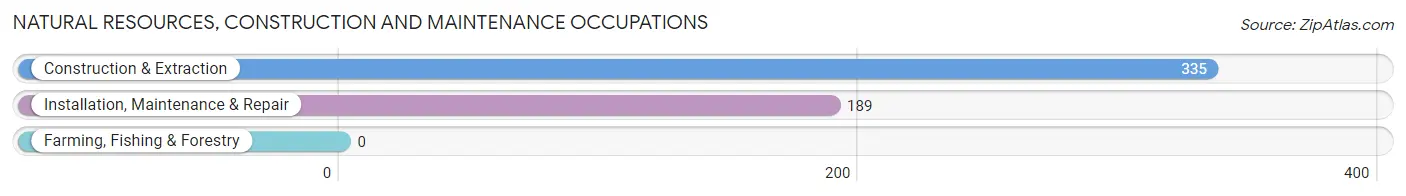
Natural Resources, Construction and Maintenance Occupations
The most common Natural Resources, Construction and Maintenance occupations in Mesquite are Construction & Extraction (335 | 5.3%), and Installation, Maintenance & Repair (189 | 3.0%).
Natural Resources, Construction and Maintenance Occupations by Sex
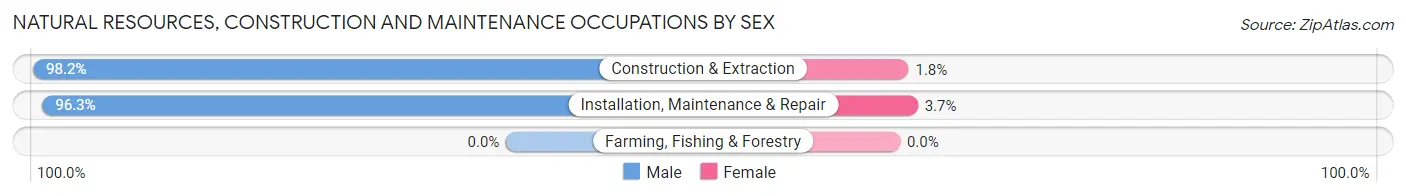
| Occupation | Male | Female |
| Farming, Fishing & Forestry | 0 (0.0%) | 0 (0.0%) |
| Construction & Extraction | 329 (98.2%) | 6 (1.8%) |
| Installation, Maintenance & Repair | 182 (96.3%) | 7 (3.7%) |
| Total (Category) | 511 (97.5%) | 13 (2.5%) |
| Total (Overall) | 3,610 (56.8%) | 2,741 (43.2%) |
Production, Transportation and Moving Occupations
The most common Production, Transportation and Moving occupations in Mesquite are Material Moving (456 | 7.2%), Production (237 | 3.7%), and Transportation (230 | 3.6%).
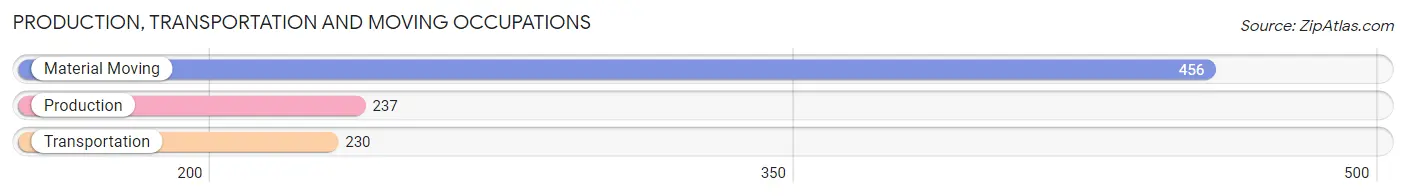
Production, Transportation and Moving Occupations by Sex
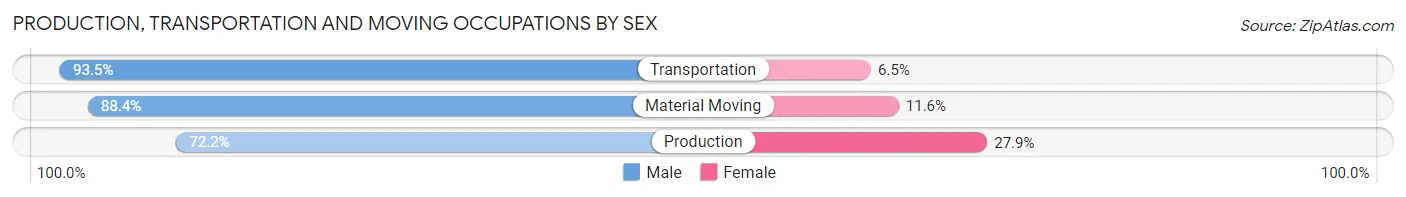
| Occupation | Male | Female |
| Production | 171 (72.2%) | 66 (27.9%) |
| Transportation | 215 (93.5%) | 15 (6.5%) |
| Material Moving | 403 (88.4%) | 53 (11.6%) |
| Total (Category) | 789 (85.5%) | 134 (14.5%) |
| Total (Overall) | 3,610 (56.8%) | 2,741 (43.2%) |
Employment Industries by Sex in Mesquite
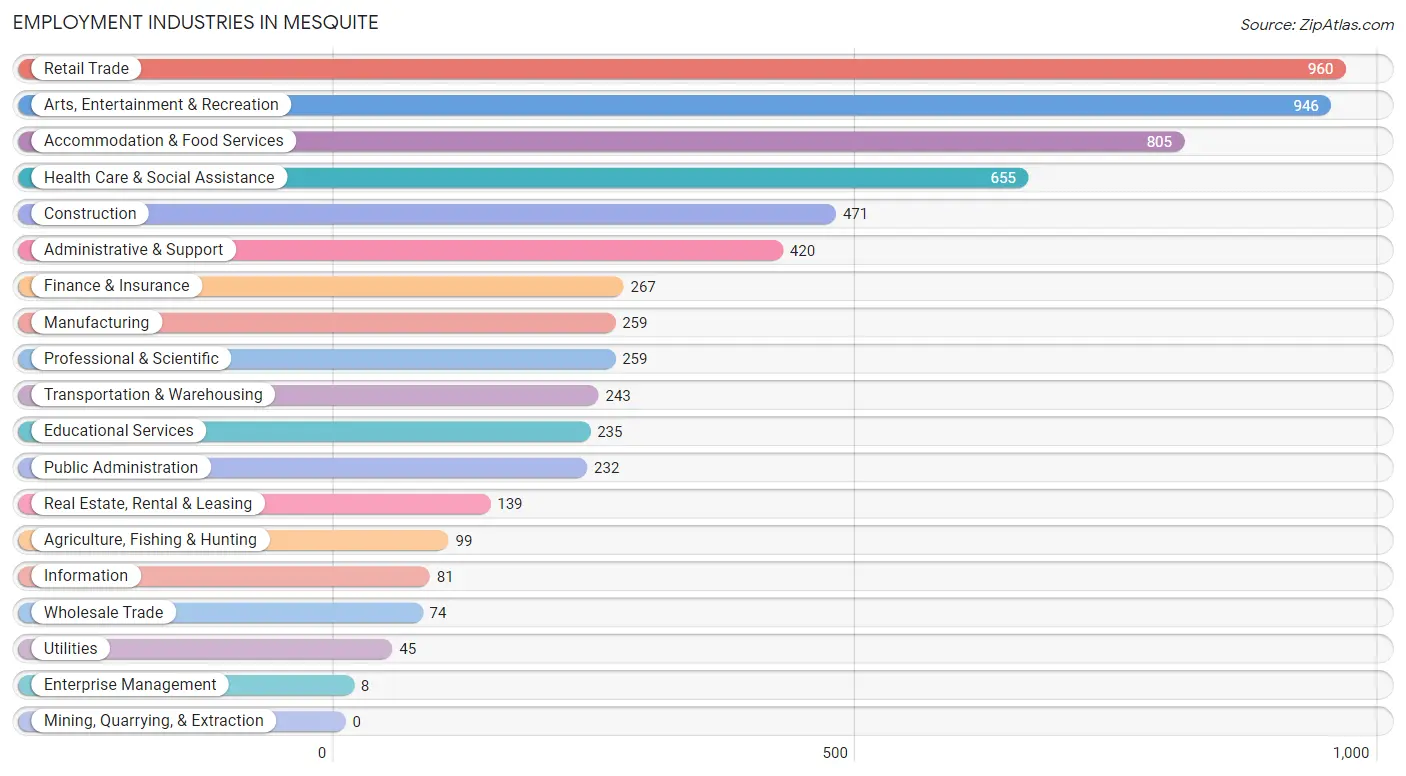
Employment Industries in Mesquite
The major employment industries in Mesquite include Retail Trade (960 | 15.1%), Arts, Entertainment & Recreation (946 | 14.9%), Accommodation & Food Services (805 | 12.7%), Health Care & Social Assistance (655 | 10.3%), and Construction (471 | 7.4%).
Employment Industries by Sex in Mesquite
The Mesquite industries that see more men than women are Utilities (100.0%), Manufacturing (97.7%), and Construction (92.8%), whereas the industries that tend to have a higher number of women are Enterprise Management (100.0%), Health Care & Social Assistance (88.2%), and Real Estate, Rental & Leasing (75.5%).
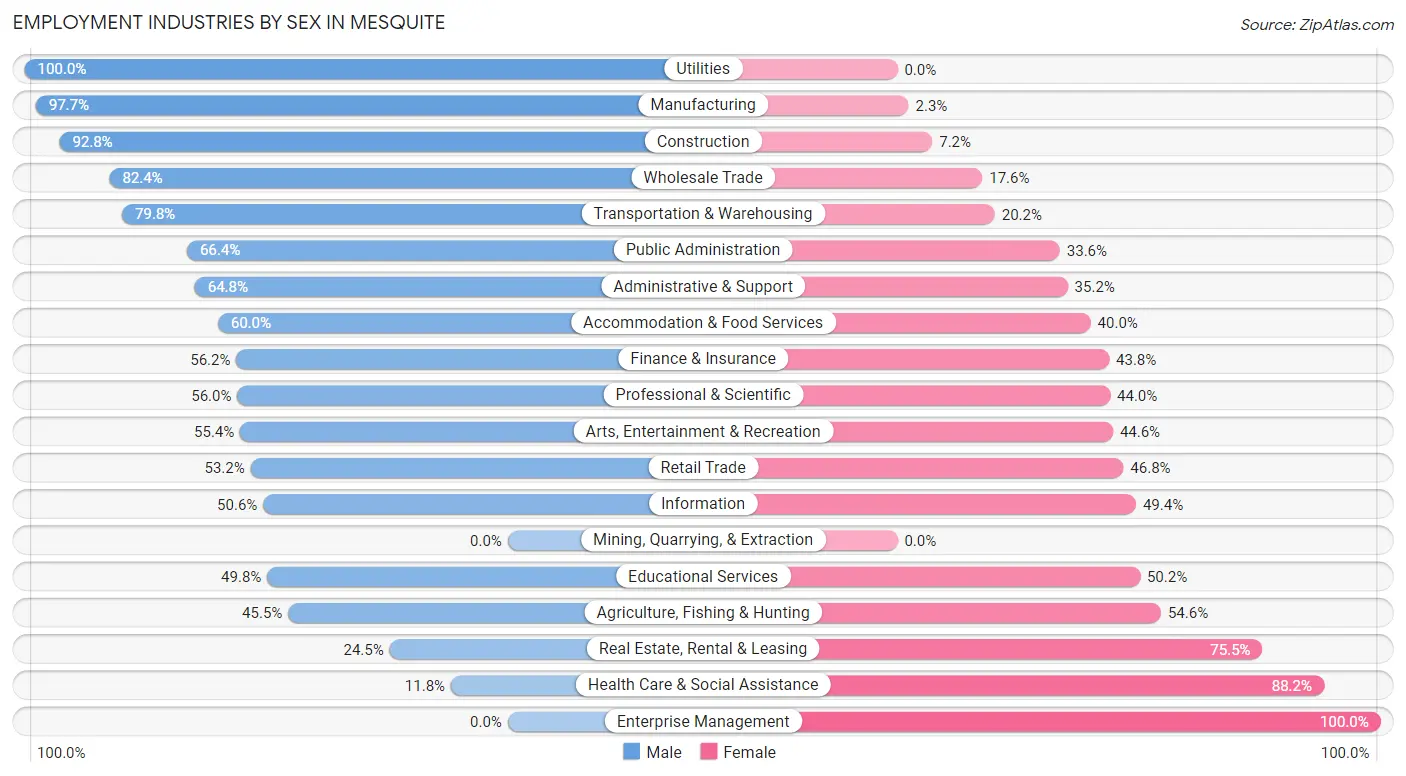
| Industry | Male | Female |
| Agriculture, Fishing & Hunting | 45 (45.5%) | 54 (54.5%) |
| Mining, Quarrying, & Extraction | 0 (0.0%) | 0 (0.0%) |
| Construction | 437 (92.8%) | 34 (7.2%) |
| Manufacturing | 253 (97.7%) | 6 (2.3%) |
| Wholesale Trade | 61 (82.4%) | 13 (17.6%) |
| Retail Trade | 511 (53.2%) | 449 (46.8%) |
| Transportation & Warehousing | 194 (79.8%) | 49 (20.2%) |
| Utilities | 45 (100.0%) | 0 (0.0%) |
| Information | 41 (50.6%) | 40 (49.4%) |
| Finance & Insurance | 150 (56.2%) | 117 (43.8%) |
| Real Estate, Rental & Leasing | 34 (24.5%) | 105 (75.5%) |
| Professional & Scientific | 145 (56.0%) | 114 (44.0%) |
| Enterprise Management | 0 (0.0%) | 8 (100.0%) |
| Administrative & Support | 272 (64.8%) | 148 (35.2%) |
| Educational Services | 117 (49.8%) | 118 (50.2%) |
| Health Care & Social Assistance | 77 (11.8%) | 578 (88.2%) |
| Arts, Entertainment & Recreation | 524 (55.4%) | 422 (44.6%) |
| Accommodation & Food Services | 483 (60.0%) | 322 (40.0%) |
| Public Administration | 154 (66.4%) | 78 (33.6%) |
| Total | 3,610 (56.8%) | 2,741 (43.2%) |
Education in Mesquite
School Enrollment in Mesquite
The most common levels of schooling among the 2,682 students in Mesquite are high school (947 | 35.3%), elementary school (550 | 20.5%), and middle school (539 | 20.1%).
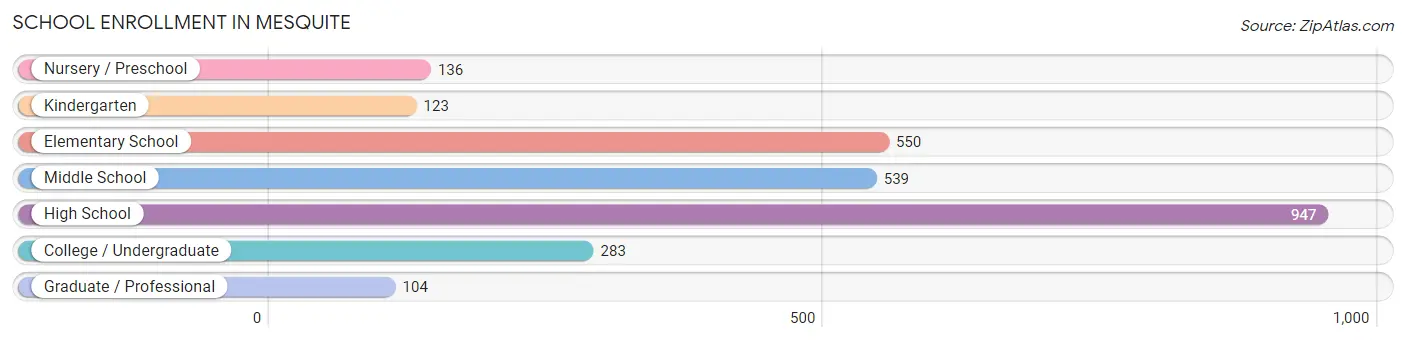
| School Level | # Students | % Students |
| Nursery / Preschool | 136 | 5.1% |
| Kindergarten | 123 | 4.6% |
| Elementary School | 550 | 20.5% |
| Middle School | 539 | 20.1% |
| High School | 947 | 35.3% |
| College / Undergraduate | 283 | 10.5% |
| Graduate / Professional | 104 | 3.9% |
| Total | 2,682 | 100.0% |
School Enrollment by Age by Funding Source in Mesquite
Out of a total of 2,682 students who are enrolled in schools in Mesquite, 139 (5.2%) attend a private institution, while the remaining 2,543 (94.8%) are enrolled in public schools. The age group of 20 to 24 year olds has the highest likelihood of being enrolled in private schools, with 22 (26.5% in the age bracket) enrolled. Conversely, the age group of 3 to 4 year olds has the lowest likelihood of being enrolled in a private school, with 97 (100.0% in the age bracket) attending a public institution.
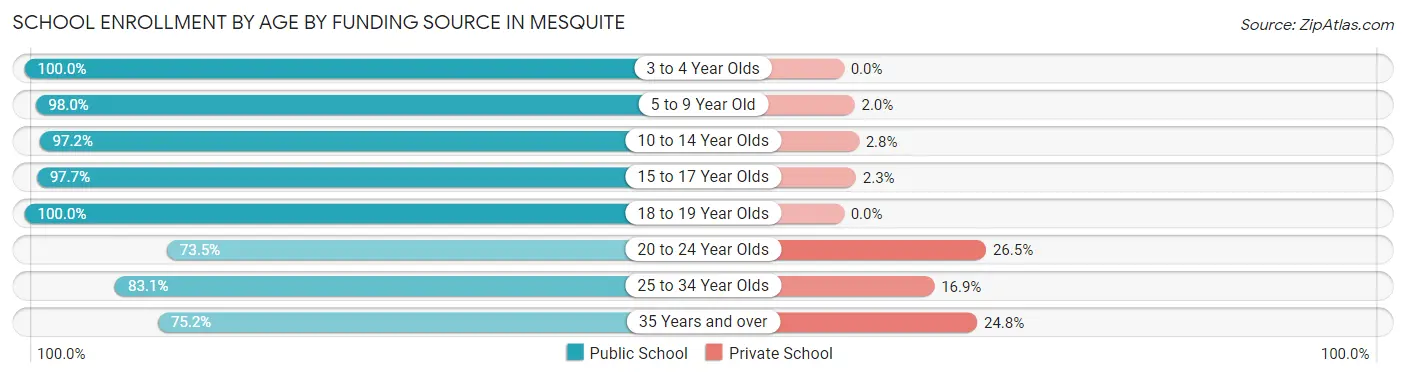
| Age Bracket | Public School | Private School |
| 3 to 4 Year Olds | 97 (100.0%) | 0 (0.0%) |
| 5 to 9 Year Old | 679 (98.0%) | 14 (2.0%) |
| 10 to 14 Year Olds | 694 (97.2%) | 20 (2.8%) |
| 15 to 17 Year Olds | 646 (97.7%) | 15 (2.3%) |
| 18 to 19 Year Olds | 101 (100.0%) | 0 (0.0%) |
| 20 to 24 Year Olds | 61 (73.5%) | 22 (26.5%) |
| 25 to 34 Year Olds | 143 (83.1%) | 29 (16.9%) |
| 35 Years and over | 121 (75.2%) | 40 (24.8%) |
| Total | 2,543 (94.8%) | 139 (5.2%) |
Educational Attainment by Field of Study in Mesquite
Education (856 | 18.9%), business (834 | 18.4%), social sciences (549 | 12.1%), engineering (387 | 8.5%), and science & technology (374 | 8.2%) are the most common fields of study among 4,542 individuals in Mesquite who have obtained a bachelor's degree or higher.
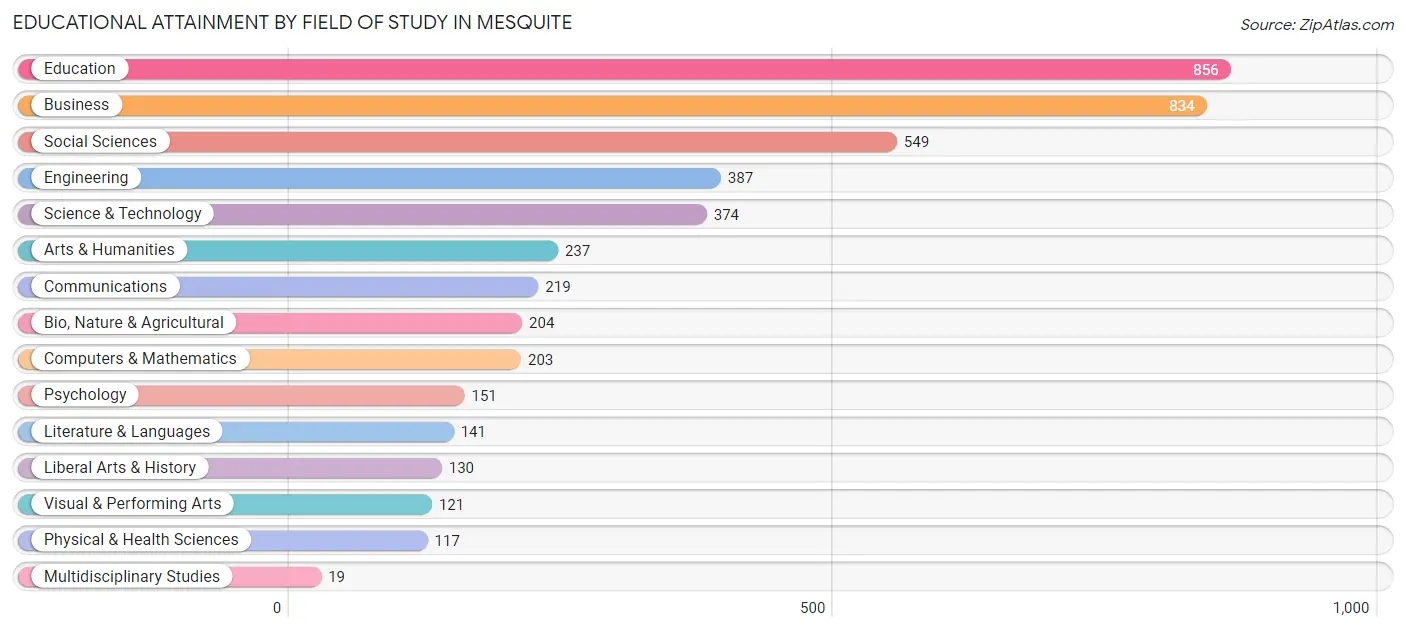
| Field of Study | # Graduates | % Graduates |
| Computers & Mathematics | 203 | 4.5% |
| Bio, Nature & Agricultural | 204 | 4.5% |
| Physical & Health Sciences | 117 | 2.6% |
| Psychology | 151 | 3.3% |
| Social Sciences | 549 | 12.1% |
| Engineering | 387 | 8.5% |
| Multidisciplinary Studies | 19 | 0.4% |
| Science & Technology | 374 | 8.2% |
| Business | 834 | 18.4% |
| Education | 856 | 18.9% |
| Literature & Languages | 141 | 3.1% |
| Liberal Arts & History | 130 | 2.9% |
| Visual & Performing Arts | 121 | 2.7% |
| Communications | 219 | 4.8% |
| Arts & Humanities | 237 | 5.2% |
| Total | 4,542 | 100.0% |
Transportation & Commute in Mesquite
Vehicle Availability by Sex in Mesquite
The most prevalent vehicle ownership categories in Mesquite are males with 2 vehicles (1,595, accounting for 44.8%) and females with 2 vehicles (1,165, making up 60.4%).
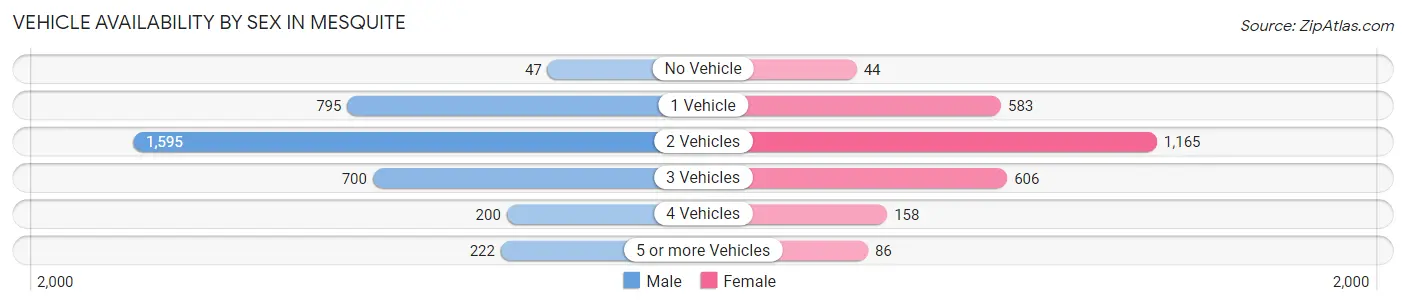
| Vehicles Available | Male | Female |
| No Vehicle | 47 (1.3%) | 44 (1.7%) |
| 1 Vehicle | 795 (22.3%) | 583 (22.1%) |
| 2 Vehicles | 1,595 (44.8%) | 1,165 (44.1%) |
| 3 Vehicles | 700 (19.7%) | 606 (22.9%) |
| 4 Vehicles | 200 (5.6%) | 158 (6.0%) |
| 5 or more Vehicles | 222 (6.2%) | 86 (3.3%) |
| Total | 3,559 (100.0%) | 2,642 (100.0%) |
Commute Time in Mesquite
The most frequently occuring commute durations in Mesquite are 5 to 9 minutes (2,250 commuters, 39.0%), 10 to 14 minutes (1,356 commuters, 23.5%), and 15 to 19 minutes (584 commuters, 10.1%).
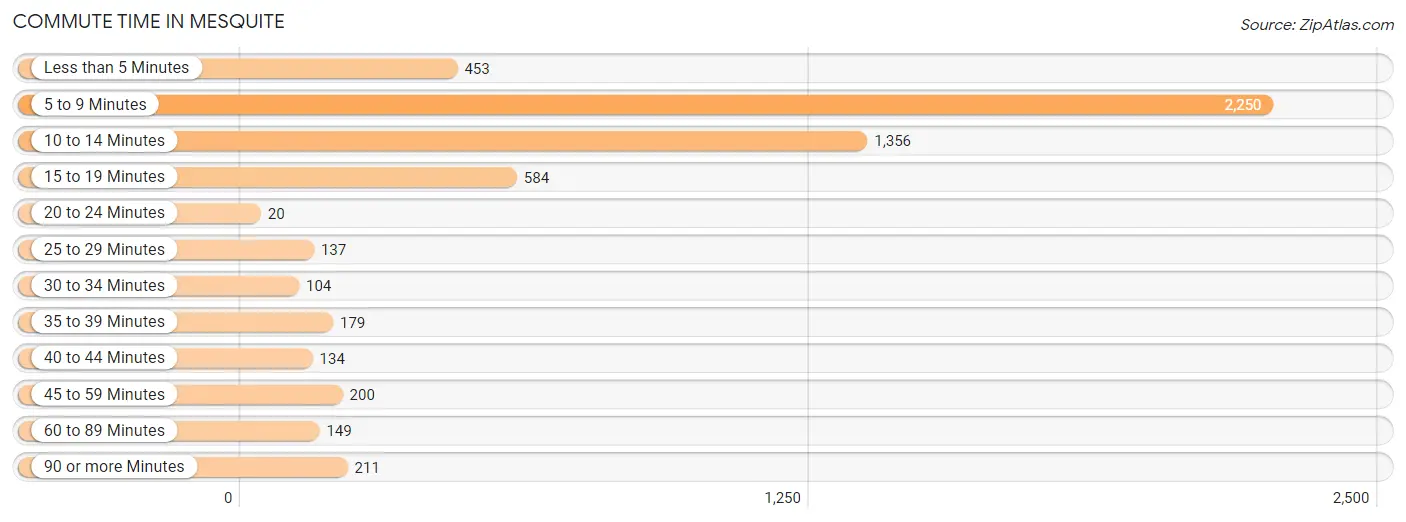
| Commute Time | # Commuters | % Commuters |
| Less than 5 Minutes | 453 | 7.8% |
| 5 to 9 Minutes | 2,250 | 39.0% |
| 10 to 14 Minutes | 1,356 | 23.5% |
| 15 to 19 Minutes | 584 | 10.1% |
| 20 to 24 Minutes | 20 | 0.4% |
| 25 to 29 Minutes | 137 | 2.4% |
| 30 to 34 Minutes | 104 | 1.8% |
| 35 to 39 Minutes | 179 | 3.1% |
| 40 to 44 Minutes | 134 | 2.3% |
| 45 to 59 Minutes | 200 | 3.5% |
| 60 to 89 Minutes | 149 | 2.6% |
| 90 or more Minutes | 211 | 3.6% |
Commute Time by Sex in Mesquite
The most common commute times in Mesquite are 5 to 9 minutes (1,161 commuters, 35.0%) for males and 5 to 9 minutes (1,089 commuters, 44.2%) for females.
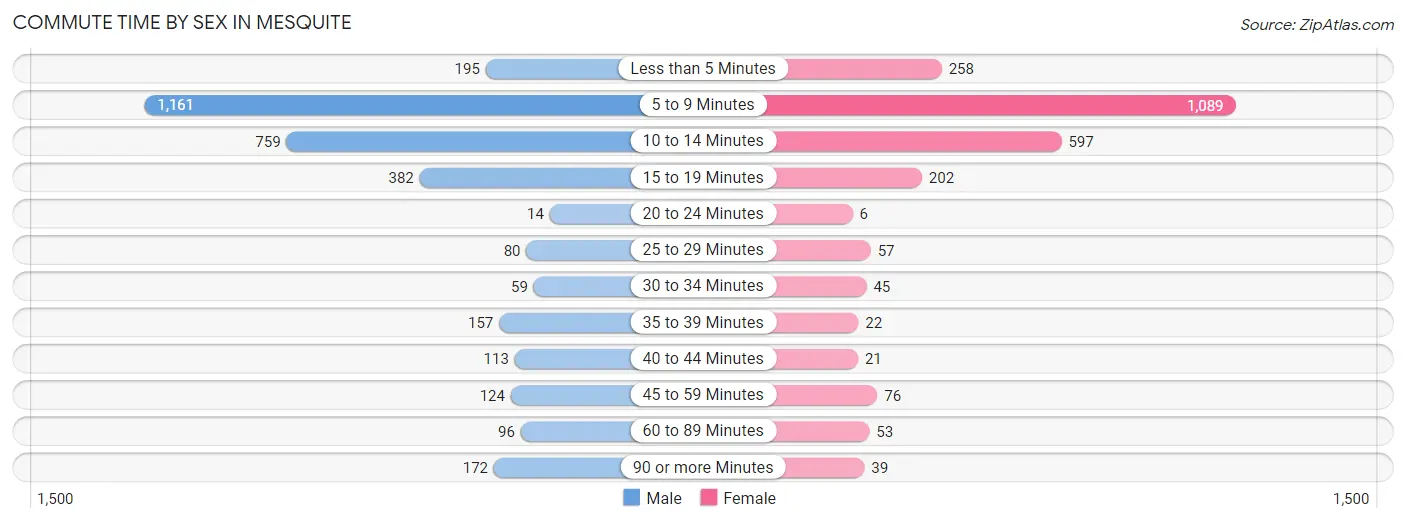
| Commute Time | Male | Female |
| Less than 5 Minutes | 195 (5.9%) | 258 (10.5%) |
| 5 to 9 Minutes | 1,161 (35.0%) | 1,089 (44.2%) |
| 10 to 14 Minutes | 759 (22.9%) | 597 (24.2%) |
| 15 to 19 Minutes | 382 (11.5%) | 202 (8.2%) |
| 20 to 24 Minutes | 14 (0.4%) | 6 (0.2%) |
| 25 to 29 Minutes | 80 (2.4%) | 57 (2.3%) |
| 30 to 34 Minutes | 59 (1.8%) | 45 (1.8%) |
| 35 to 39 Minutes | 157 (4.7%) | 22 (0.9%) |
| 40 to 44 Minutes | 113 (3.4%) | 21 (0.9%) |
| 45 to 59 Minutes | 124 (3.7%) | 76 (3.1%) |
| 60 to 89 Minutes | 96 (2.9%) | 53 (2.1%) |
| 90 or more Minutes | 172 (5.2%) | 39 (1.6%) |
Time of Departure to Work by Sex in Mesquite
The most frequent times of departure to work in Mesquite are 12:00 PM to 3:59 PM (560, 16.9%) for males and 7:30 AM to 7:59 AM (412, 16.7%) for females.
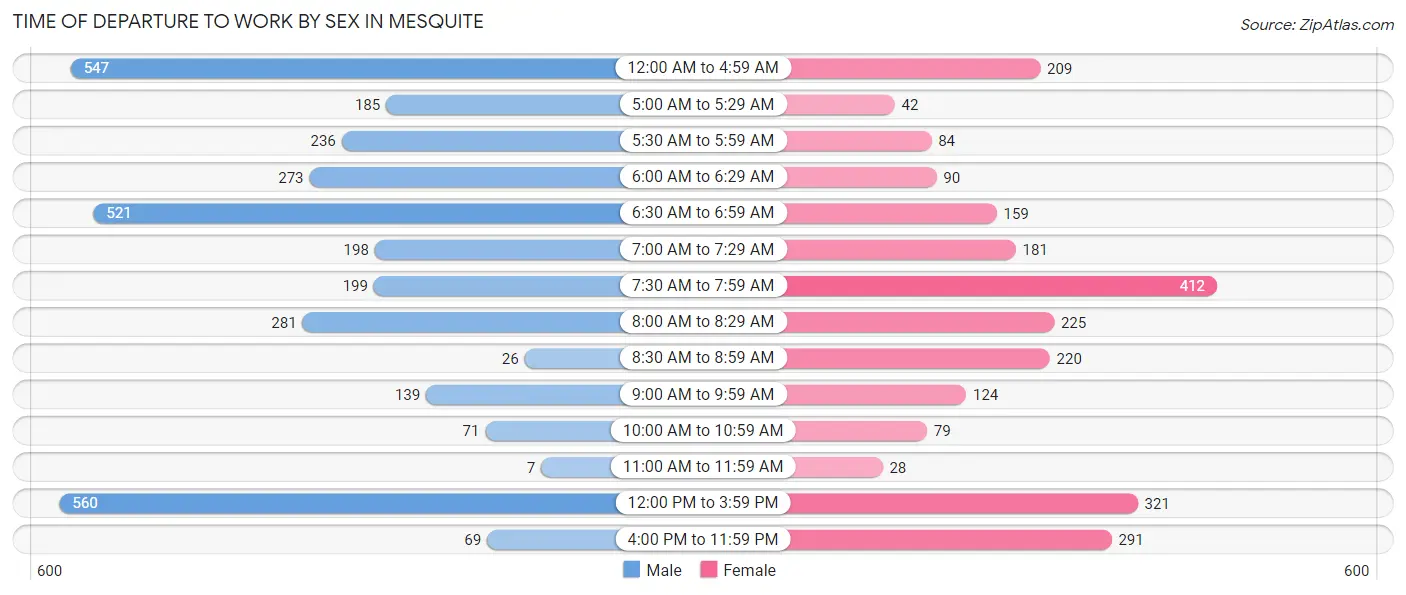
| Time of Departure | Male | Female |
| 12:00 AM to 4:59 AM | 547 (16.5%) | 209 (8.5%) |
| 5:00 AM to 5:29 AM | 185 (5.6%) | 42 (1.7%) |
| 5:30 AM to 5:59 AM | 236 (7.1%) | 84 (3.4%) |
| 6:00 AM to 6:29 AM | 273 (8.2%) | 90 (3.6%) |
| 6:30 AM to 6:59 AM | 521 (15.7%) | 159 (6.5%) |
| 7:00 AM to 7:29 AM | 198 (6.0%) | 181 (7.3%) |
| 7:30 AM to 7:59 AM | 199 (6.0%) | 412 (16.7%) |
| 8:00 AM to 8:29 AM | 281 (8.5%) | 225 (9.1%) |
| 8:30 AM to 8:59 AM | 26 (0.8%) | 220 (8.9%) |
| 9:00 AM to 9:59 AM | 139 (4.2%) | 124 (5.0%) |
| 10:00 AM to 10:59 AM | 71 (2.1%) | 79 (3.2%) |
| 11:00 AM to 11:59 AM | 7 (0.2%) | 28 (1.1%) |
| 12:00 PM to 3:59 PM | 560 (16.9%) | 321 (13.0%) |
| 4:00 PM to 11:59 PM | 69 (2.1%) | 291 (11.8%) |
| Total | 3,312 (100.0%) | 2,465 (100.0%) |
Housing Occupancy in Mesquite
Occupancy by Ownership in Mesquite
Of the total 9,048 dwellings in Mesquite, owner-occupied units account for 7,120 (78.7%), while renter-occupied units make up 1,928 (21.3%).
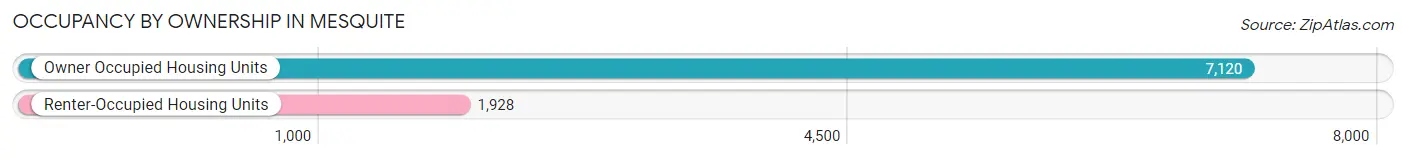
| Occupancy | # Housing Units | % Housing Units |
| Owner Occupied Housing Units | 7,120 | 78.7% |
| Renter-Occupied Housing Units | 1,928 | 21.3% |
| Total Occupied Housing Units | 9,048 | 100.0% |
Occupancy by Household Size in Mesquite
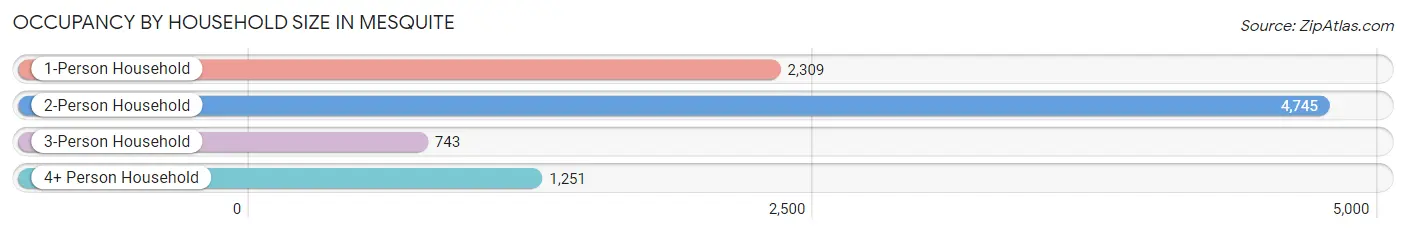
| Household Size | # Housing Units | % Housing Units |
| 1-Person Household | 2,309 | 25.5% |
| 2-Person Household | 4,745 | 52.4% |
| 3-Person Household | 743 | 8.2% |
| 4+ Person Household | 1,251 | 13.8% |
| Total Housing Units | 9,048 | 100.0% |
Occupancy by Ownership by Household Size in Mesquite
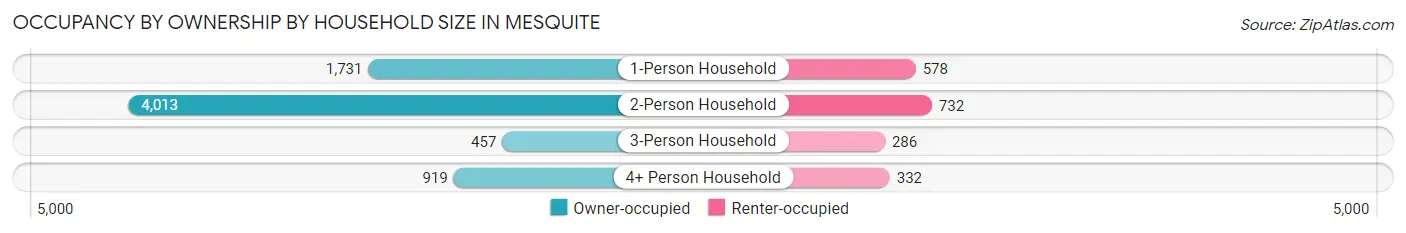
| Household Size | Owner-occupied | Renter-occupied |
| 1-Person Household | 1,731 (75.0%) | 578 (25.0%) |
| 2-Person Household | 4,013 (84.6%) | 732 (15.4%) |
| 3-Person Household | 457 (61.5%) | 286 (38.5%) |
| 4+ Person Household | 919 (73.5%) | 332 (26.5%) |
| Total Housing Units | 7,120 (78.7%) | 1,928 (21.3%) |
Occupancy by Educational Attainment in Mesquite
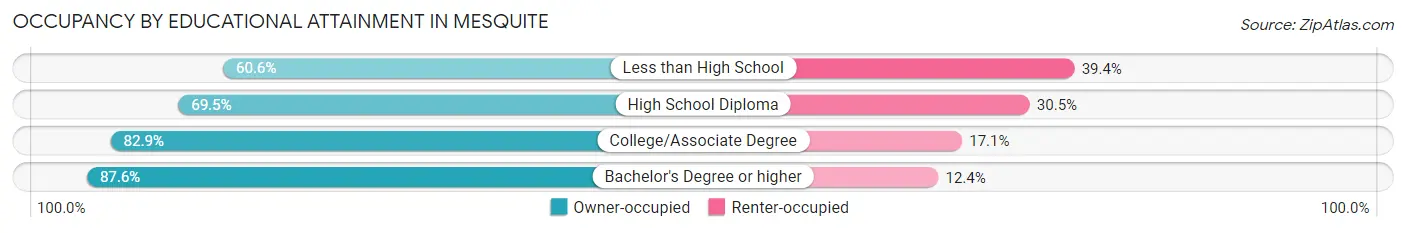
| Household Size | Owner-occupied | Renter-occupied |
| Less than High School | 396 (60.6%) | 257 (39.4%) |
| High School Diploma | 1,845 (69.5%) | 809 (30.5%) |
| College/Associate Degree | 2,676 (82.9%) | 551 (17.1%) |
| Bachelor's Degree or higher | 2,203 (87.6%) | 311 (12.4%) |
Occupancy by Age of Householder in Mesquite
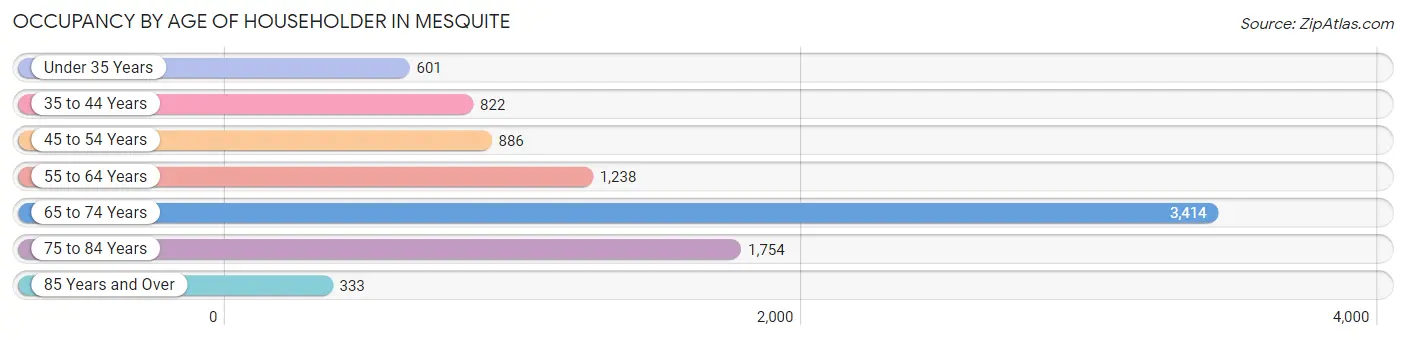
| Age Bracket | # Households | % Households |
| Under 35 Years | 601 | 6.6% |
| 35 to 44 Years | 822 | 9.1% |
| 45 to 54 Years | 886 | 9.8% |
| 55 to 64 Years | 1,238 | 13.7% |
| 65 to 74 Years | 3,414 | 37.7% |
| 75 to 84 Years | 1,754 | 19.4% |
| 85 Years and Over | 333 | 3.7% |
| Total | 9,048 | 100.0% |
Housing Finances in Mesquite
Median Income by Occupancy in Mesquite
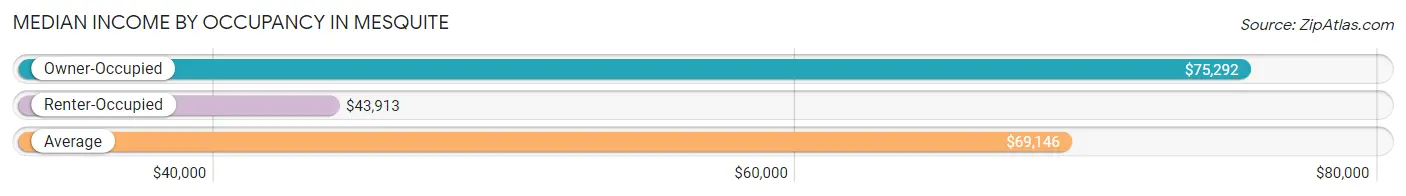
| Occupancy Type | # Households | Median Income |
| Owner-Occupied | 7,120 (78.7%) | $75,292 |
| Renter-Occupied | 1,928 (21.3%) | $43,913 |
| Average | 9,048 (100.0%) | $69,146 |
Occupancy by Householder Income Bracket in Mesquite
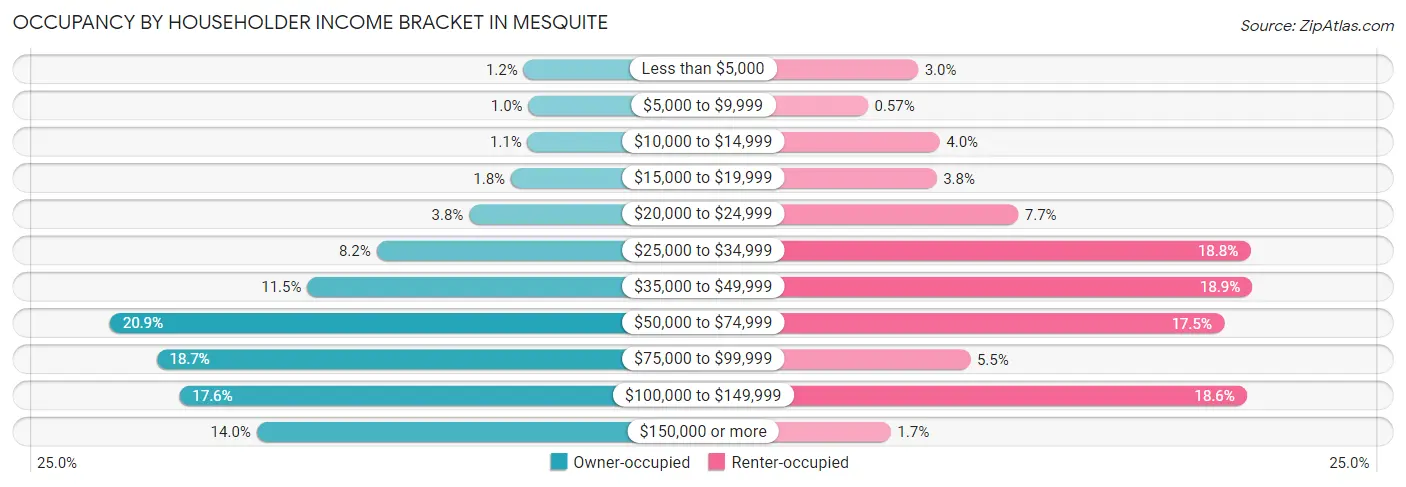
| Income Bracket | Owner-occupied | Renter-occupied |
| Less than $5,000 | 88 (1.2%) | 57 (3.0%) |
| $5,000 to $9,999 | 72 (1.0%) | 11 (0.6%) |
| $10,000 to $14,999 | 75 (1.1%) | 77 (4.0%) |
| $15,000 to $19,999 | 131 (1.8%) | 74 (3.8%) |
| $20,000 to $24,999 | 273 (3.8%) | 149 (7.7%) |
| $25,000 to $34,999 | 587 (8.2%) | 362 (18.8%) |
| $35,000 to $49,999 | 822 (11.5%) | 364 (18.9%) |
| $50,000 to $74,999 | 1,491 (20.9%) | 338 (17.5%) |
| $75,000 to $99,999 | 1,333 (18.7%) | 105 (5.4%) |
| $100,000 to $149,999 | 1,255 (17.6%) | 359 (18.6%) |
| $150,000 or more | 993 (14.0%) | 32 (1.7%) |
| Total | 7,120 (100.0%) | 1,928 (100.0%) |
Monthly Housing Cost Tiers in Mesquite
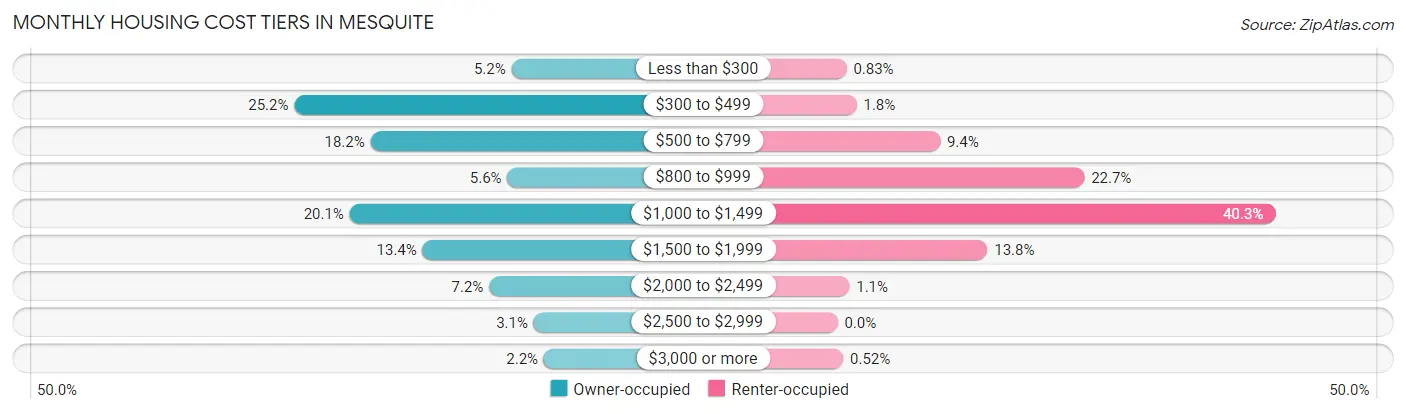
| Monthly Cost | Owner-occupied | Renter-occupied |
| Less than $300 | 368 (5.2%) | 16 (0.8%) |
| $300 to $499 | 1,792 (25.2%) | 34 (1.8%) |
| $500 to $799 | 1,292 (18.1%) | 182 (9.4%) |
| $800 to $999 | 395 (5.6%) | 438 (22.7%) |
| $1,000 to $1,499 | 1,429 (20.1%) | 777 (40.3%) |
| $1,500 to $1,999 | 951 (13.4%) | 266 (13.8%) |
| $2,000 to $2,499 | 515 (7.2%) | 21 (1.1%) |
| $2,500 to $2,999 | 222 (3.1%) | 0 (0.0%) |
| $3,000 or more | 156 (2.2%) | 10 (0.5%) |
| Total | 7,120 (100.0%) | 1,928 (100.0%) |
Physical Housing Characteristics in Mesquite
Housing Structures in Mesquite
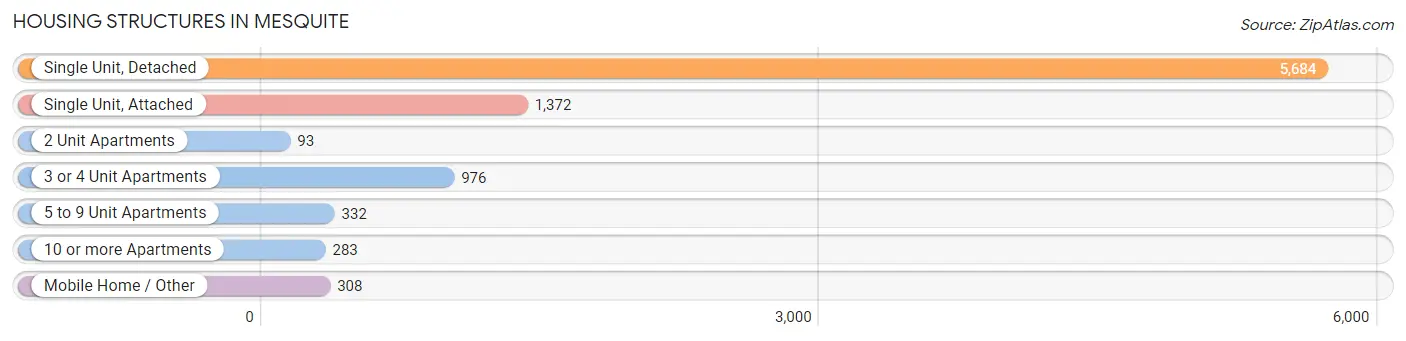
| Structure Type | # Housing Units | % Housing Units |
| Single Unit, Detached | 5,684 | 62.8% |
| Single Unit, Attached | 1,372 | 15.2% |
| 2 Unit Apartments | 93 | 1.0% |
| 3 or 4 Unit Apartments | 976 | 10.8% |
| 5 to 9 Unit Apartments | 332 | 3.7% |
| 10 or more Apartments | 283 | 3.1% |
| Mobile Home / Other | 308 | 3.4% |
| Total | 9,048 | 100.0% |
Housing Structures by Occupancy in Mesquite
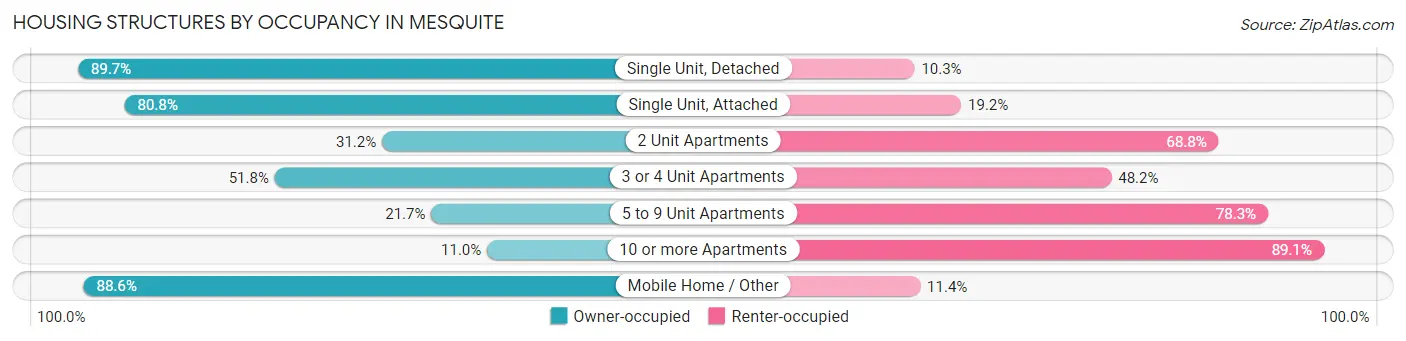
| Structure Type | Owner-occupied | Renter-occupied |
| Single Unit, Detached | 5,101 (89.7%) | 583 (10.3%) |
| Single Unit, Attached | 1,108 (80.8%) | 264 (19.2%) |
| 2 Unit Apartments | 29 (31.2%) | 64 (68.8%) |
| 3 or 4 Unit Apartments | 506 (51.8%) | 470 (48.2%) |
| 5 to 9 Unit Apartments | 72 (21.7%) | 260 (78.3%) |
| 10 or more Apartments | 31 (11.0%) | 252 (89.0%) |
| Mobile Home / Other | 273 (88.6%) | 35 (11.4%) |
| Total | 7,120 (78.7%) | 1,928 (21.3%) |
Housing Structures by Number of Rooms in Mesquite
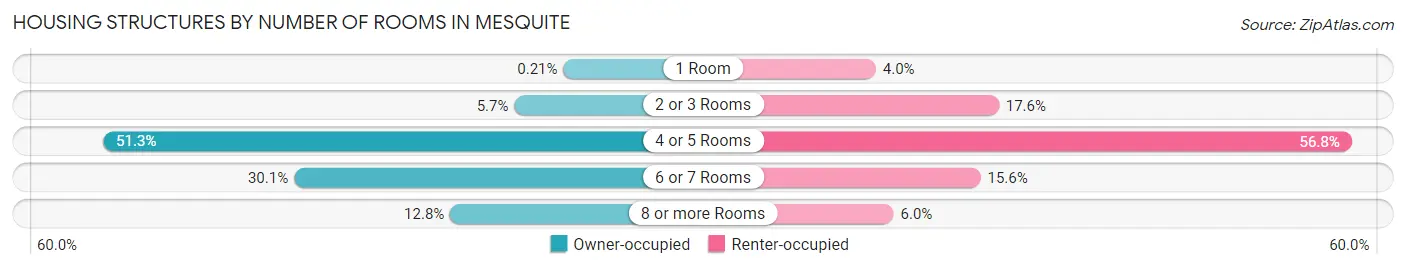
| Number of Rooms | Owner-occupied | Renter-occupied |
| 1 Room | 15 (0.2%) | 77 (4.0%) |
| 2 or 3 Rooms | 402 (5.7%) | 340 (17.6%) |
| 4 or 5 Rooms | 3,651 (51.3%) | 1,095 (56.8%) |
| 6 or 7 Rooms | 2,143 (30.1%) | 301 (15.6%) |
| 8 or more Rooms | 909 (12.8%) | 115 (6.0%) |
| Total | 7,120 (100.0%) | 1,928 (100.0%) |
Housing Structure by Heating Type in Mesquite
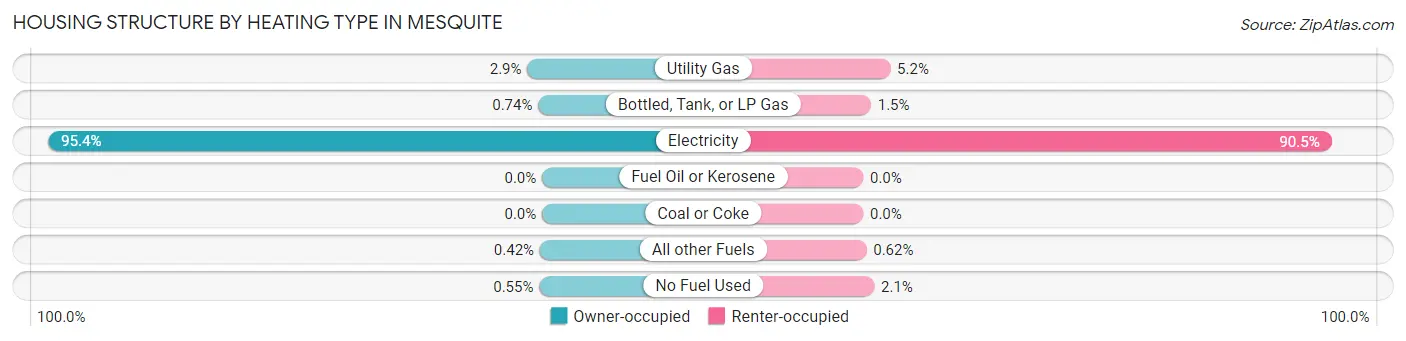
| Heating Type | Owner-occupied | Renter-occupied |
| Utility Gas | 203 (2.9%) | 101 (5.2%) |
| Bottled, Tank, or LP Gas | 53 (0.7%) | 29 (1.5%) |
| Electricity | 6,795 (95.4%) | 1,745 (90.5%) |
| Fuel Oil or Kerosene | 0 (0.0%) | 0 (0.0%) |
| Coal or Coke | 0 (0.0%) | 0 (0.0%) |
| All other Fuels | 30 (0.4%) | 12 (0.6%) |
| No Fuel Used | 39 (0.5%) | 41 (2.1%) |
| Total | 7,120 (100.0%) | 1,928 (100.0%) |
Household Vehicle Usage in Mesquite
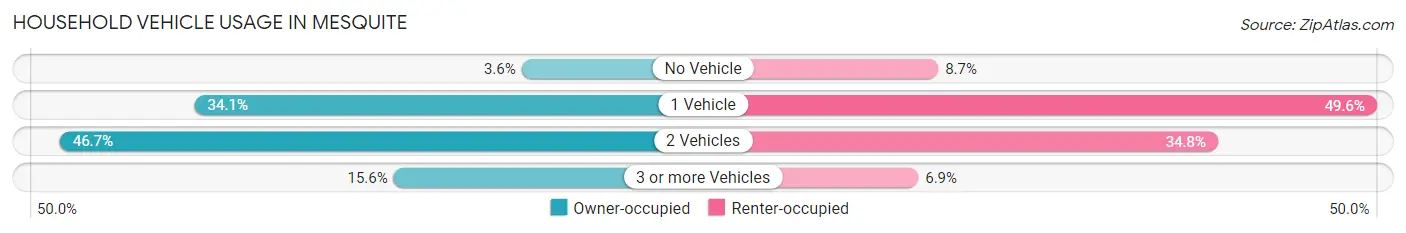
| Vehicles per Household | Owner-occupied | Renter-occupied |
| No Vehicle | 257 (3.6%) | 168 (8.7%) |
| 1 Vehicle | 2,429 (34.1%) | 957 (49.6%) |
| 2 Vehicles | 3,326 (46.7%) | 671 (34.8%) |
| 3 or more Vehicles | 1,108 (15.6%) | 132 (6.9%) |
| Total | 7,120 (100.0%) | 1,928 (100.0%) |
Real Estate & Mortgages in Mesquite
Real Estate and Mortgage Overview in Mesquite
| Characteristic | Without Mortgage | With Mortgage |
| Housing Units | 3,415 | 3,705 |
| Median Property Value | $334,500 | $332,500 |
| Median Household Income | $65,563 | $559 |
| Monthly Housing Costs | $450 | $140 |
| Real Estate Taxes | $2,112 | $41 |
Property Value by Mortgage Status in Mesquite
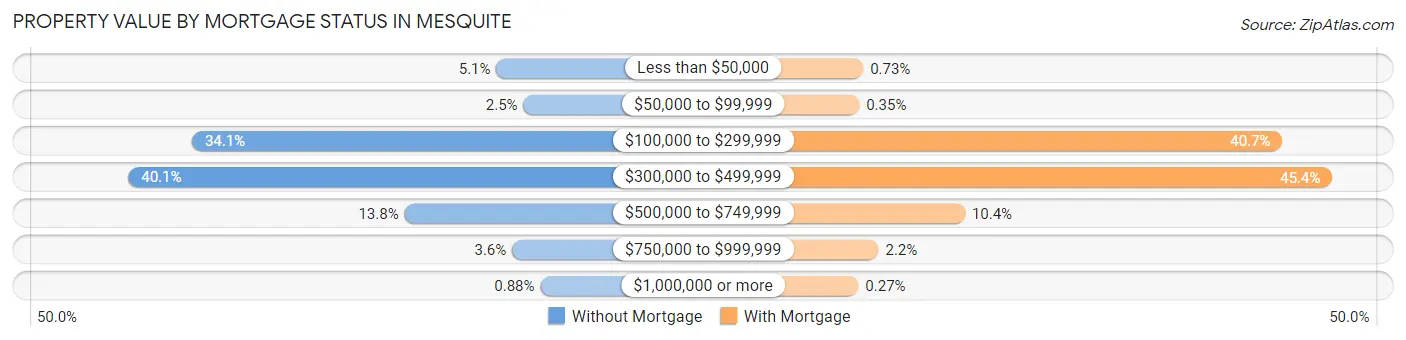
| Property Value | Without Mortgage | With Mortgage |
| Less than $50,000 | 173 (5.1%) | 27 (0.7%) |
| $50,000 to $99,999 | 85 (2.5%) | 13 (0.4%) |
| $100,000 to $299,999 | 1,163 (34.1%) | 1,506 (40.6%) |
| $300,000 to $499,999 | 1,370 (40.1%) | 1,682 (45.4%) |
| $500,000 to $749,999 | 472 (13.8%) | 386 (10.4%) |
| $750,000 to $999,999 | 122 (3.6%) | 81 (2.2%) |
| $1,000,000 or more | 30 (0.9%) | 10 (0.3%) |
| Total | 3,415 (100.0%) | 3,705 (100.0%) |
Household Income by Mortgage Status in Mesquite
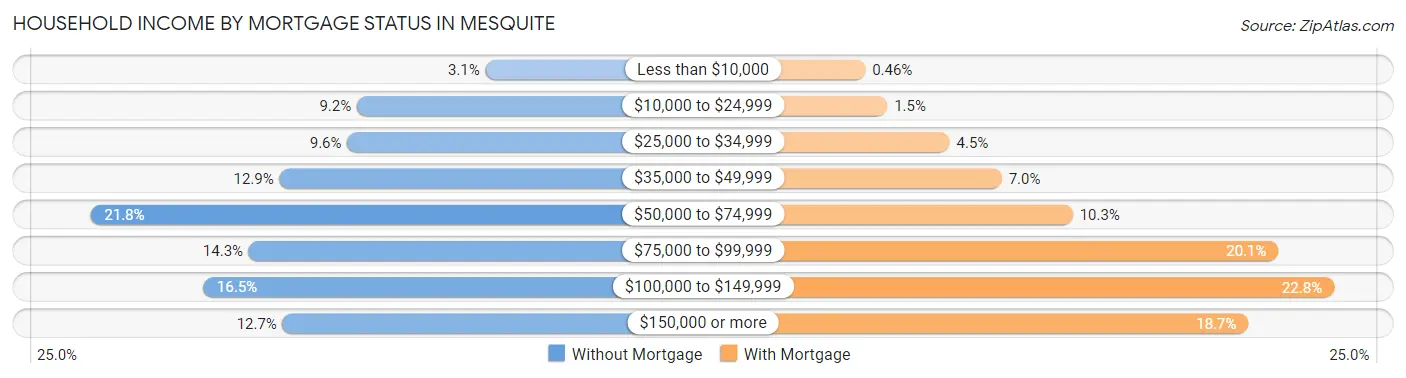
| Household Income | Without Mortgage | With Mortgage |
| Less than $10,000 | 104 (3.0%) | 17 (0.5%) |
| $10,000 to $24,999 | 313 (9.2%) | 56 (1.5%) |
| $25,000 to $34,999 | 329 (9.6%) | 166 (4.5%) |
| $35,000 to $49,999 | 439 (12.9%) | 258 (7.0%) |
| $50,000 to $74,999 | 745 (21.8%) | 383 (10.3%) |
| $75,000 to $99,999 | 489 (14.3%) | 746 (20.1%) |
| $100,000 to $149,999 | 562 (16.5%) | 844 (22.8%) |
| $150,000 or more | 434 (12.7%) | 693 (18.7%) |
| Total | 3,415 (100.0%) | 3,705 (100.0%) |
Property Value to Household Income Ratio in Mesquite
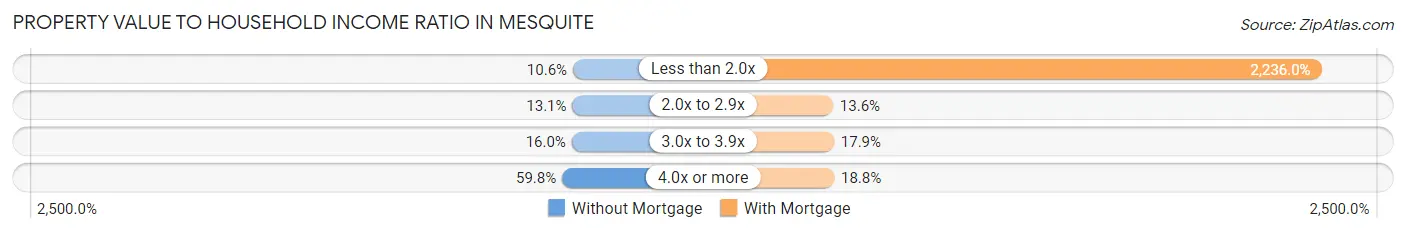
| Value-to-Income Ratio | Without Mortgage | With Mortgage |
| Less than 2.0x | 362 (10.6%) | 82,843 (2,236.0%) |
| 2.0x to 2.9x | 448 (13.1%) | 504 (13.6%) |
| 3.0x to 3.9x | 547 (16.0%) | 663 (17.9%) |
| 4.0x or more | 2,043 (59.8%) | 695 (18.8%) |
| Total | 3,415 (100.0%) | 3,705 (100.0%) |
Real Estate Taxes by Mortgage Status in Mesquite
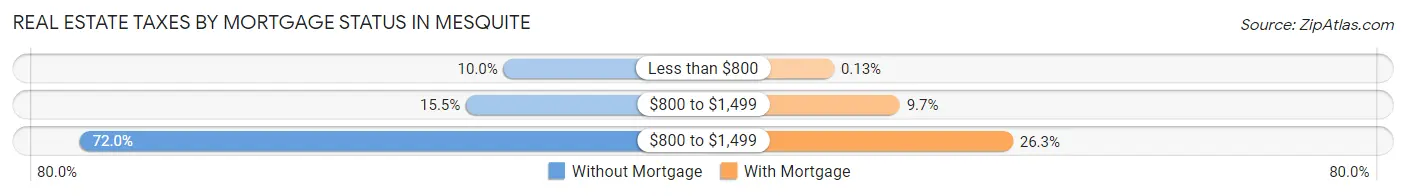
| Property Taxes | Without Mortgage | With Mortgage |
| Less than $800 | 342 (10.0%) | 5 (0.1%) |
| $800 to $1,499 | 529 (15.5%) | 361 (9.7%) |
| $800 to $1,499 | 2,457 (72.0%) | 973 (26.3%) |
| Total | 3,415 (100.0%) | 3,705 (100.0%) |
Health & Disability in Mesquite
Health Insurance Coverage by Age in Mesquite
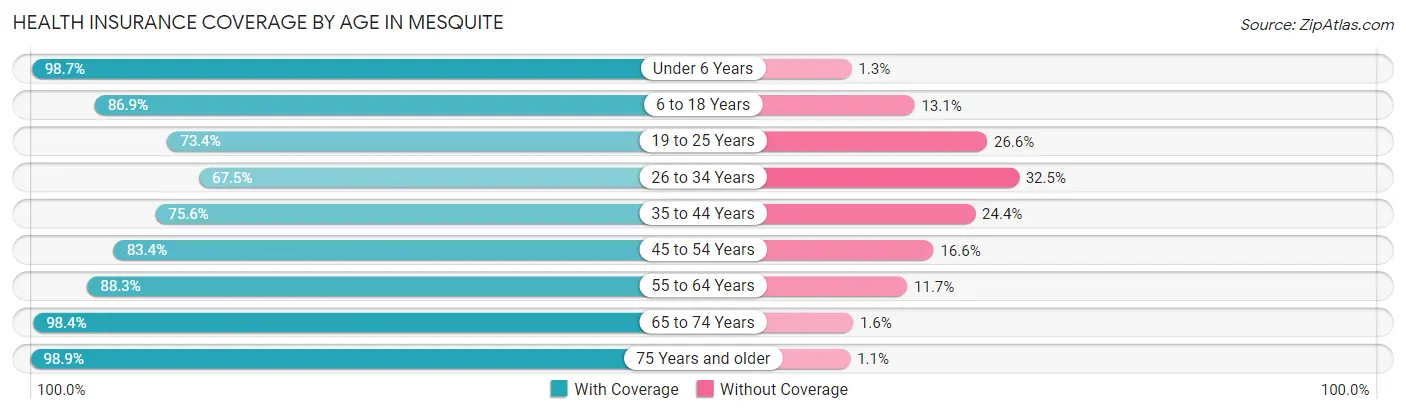
| Age Bracket | With Coverage | Without Coverage |
| Under 6 Years | 893 (98.7%) | 12 (1.3%) |
| 6 to 18 Years | 1,899 (86.9%) | 286 (13.1%) |
| 19 to 25 Years | 543 (73.4%) | 197 (26.6%) |
| 26 to 34 Years | 898 (67.5%) | 433 (32.5%) |
| 35 to 44 Years | 1,140 (75.6%) | 368 (24.4%) |
| 45 to 54 Years | 1,694 (83.4%) | 338 (16.6%) |
| 55 to 64 Years | 2,338 (88.3%) | 310 (11.7%) |
| 65 to 74 Years | 5,397 (98.4%) | 89 (1.6%) |
| 75 Years and older | 3,701 (98.9%) | 41 (1.1%) |
| Total | 18,503 (89.9%) | 2,074 (10.1%) |
Health Insurance Coverage by Citizenship Status in Mesquite
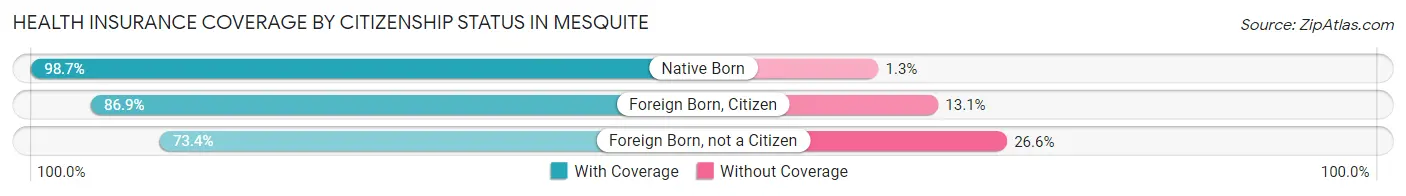
| Citizenship Status | With Coverage | Without Coverage |
| Native Born | 893 (98.7%) | 12 (1.3%) |
| Foreign Born, Citizen | 1,899 (86.9%) | 286 (13.1%) |
| Foreign Born, not a Citizen | 543 (73.4%) | 197 (26.6%) |
Health Insurance Coverage by Household Income in Mesquite
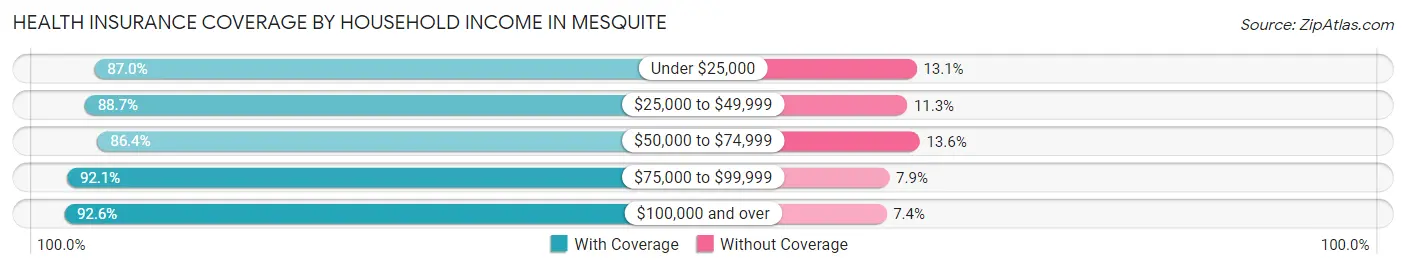
| Household Income | With Coverage | Without Coverage |
| Under $25,000 | 1,459 (87.0%) | 219 (13.1%) |
| $25,000 to $49,999 | 3,938 (88.7%) | 500 (11.3%) |
| $50,000 to $74,999 | 3,728 (86.4%) | 588 (13.6%) |
| $75,000 to $99,999 | 3,016 (92.1%) | 260 (7.9%) |
| $100,000 and over | 6,359 (92.6%) | 507 (7.4%) |
Public vs Private Health Insurance Coverage by Age in Mesquite
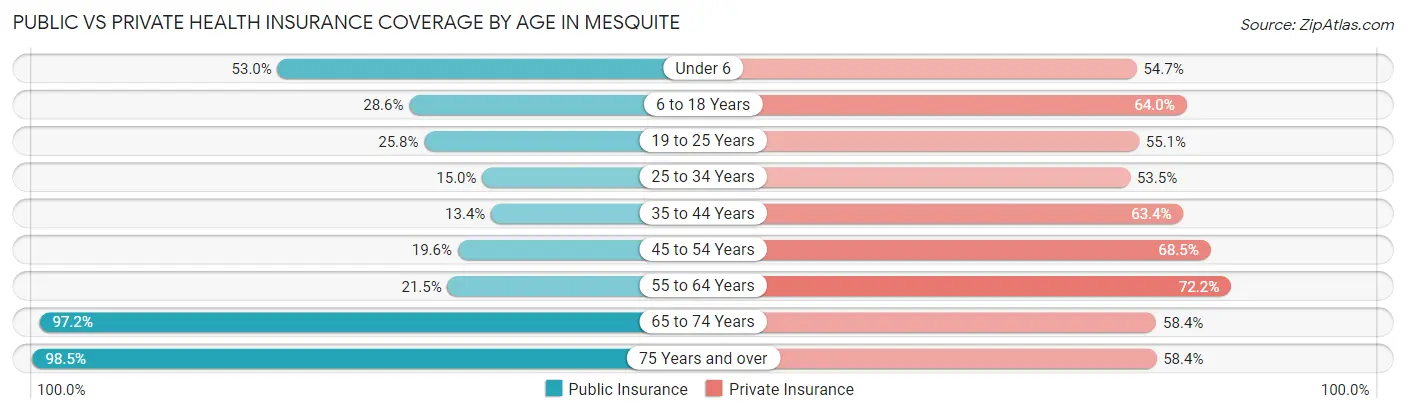
| Age Bracket | Public Insurance | Private Insurance |
| Under 6 | 480 (53.0%) | 495 (54.7%) |
| 6 to 18 Years | 625 (28.6%) | 1,398 (64.0%) |
| 19 to 25 Years | 191 (25.8%) | 408 (55.1%) |
| 25 to 34 Years | 200 (15.0%) | 712 (53.5%) |
| 35 to 44 Years | 202 (13.4%) | 956 (63.4%) |
| 45 to 54 Years | 398 (19.6%) | 1,391 (68.4%) |
| 55 to 64 Years | 569 (21.5%) | 1,913 (72.2%) |
| 65 to 74 Years | 5,334 (97.2%) | 3,201 (58.4%) |
| 75 Years and over | 3,687 (98.5%) | 2,184 (58.4%) |
| Total | 11,686 (56.8%) | 12,658 (61.5%) |
Disability Status by Sex by Age in Mesquite
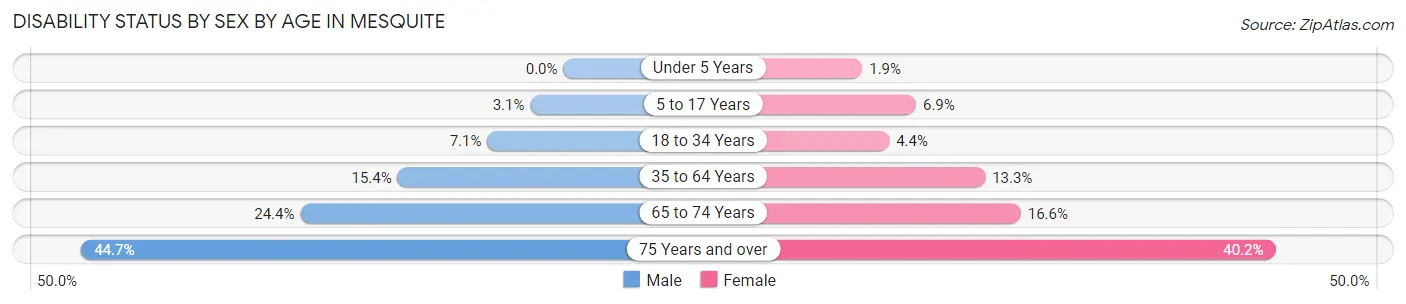
| Age Bracket | Male | Female |
| Under 5 Years | 0 (0.0%) | 6 (1.9%) |
| 5 to 17 Years | 31 (3.1%) | 77 (6.9%) |
| 18 to 34 Years | 86 (7.1%) | 45 (4.4%) |
| 35 to 64 Years | 454 (15.4%) | 431 (13.3%) |
| 65 to 74 Years | 660 (24.4%) | 462 (16.6%) |
| 75 Years and over | 939 (44.7%) | 661 (40.2%) |
Disability Class by Sex by Age in Mesquite
Disability Class: Hearing Difficulty
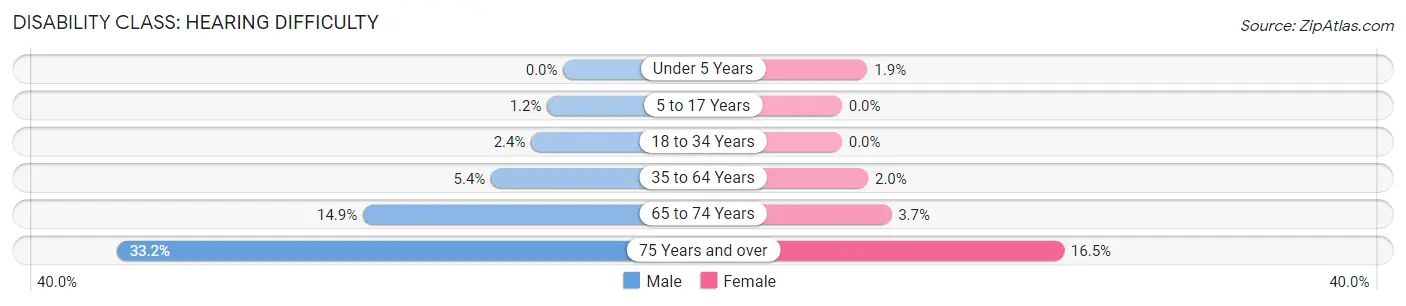
| Age Bracket | Male | Female |
| Under 5 Years | 0 (0.0%) | 6 (1.9%) |
| 5 to 17 Years | 12 (1.2%) | 0 (0.0%) |
| 18 to 34 Years | 29 (2.4%) | 0 (0.0%) |
| 35 to 64 Years | 158 (5.4%) | 63 (1.9%) |
| 65 to 74 Years | 402 (14.9%) | 102 (3.7%) |
| 75 Years and over | 696 (33.2%) | 271 (16.5%) |
Disability Class: Vision Difficulty
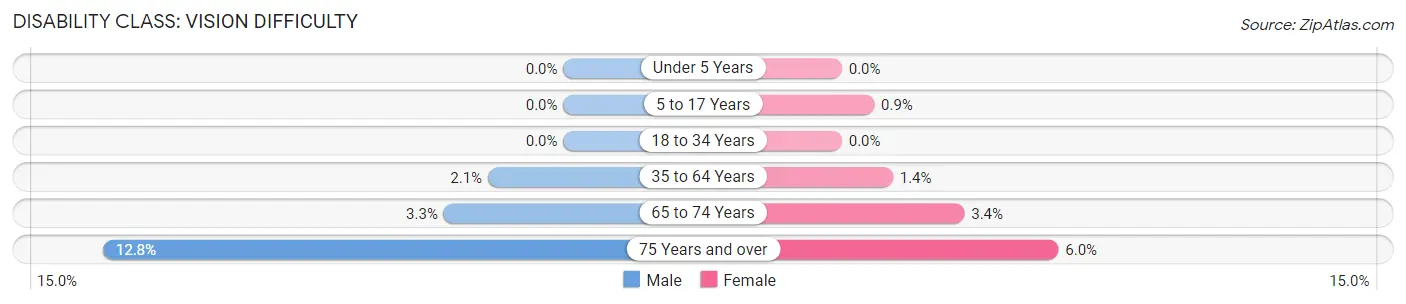
| Age Bracket | Male | Female |
| Under 5 Years | 0 (0.0%) | 0 (0.0%) |
| 5 to 17 Years | 0 (0.0%) | 10 (0.9%) |
| 18 to 34 Years | 0 (0.0%) | 0 (0.0%) |
| 35 to 64 Years | 62 (2.1%) | 46 (1.4%) |
| 65 to 74 Years | 90 (3.3%) | 95 (3.4%) |
| 75 Years and over | 269 (12.8%) | 99 (6.0%) |
Disability Class: Cognitive Difficulty
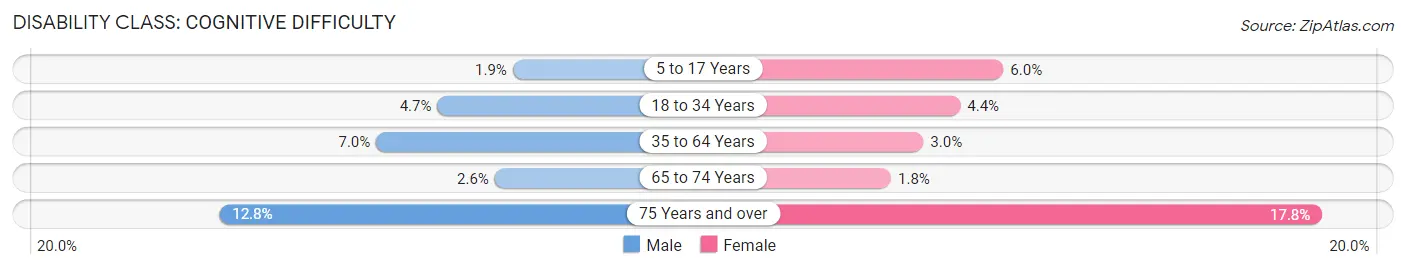
| Age Bracket | Male | Female |
| 5 to 17 Years | 19 (1.9%) | 67 (6.0%) |
| 18 to 34 Years | 57 (4.7%) | 45 (4.4%) |
| 35 to 64 Years | 205 (7.0%) | 98 (3.0%) |
| 65 to 74 Years | 69 (2.5%) | 51 (1.8%) |
| 75 Years and over | 268 (12.8%) | 293 (17.8%) |
Disability Class: Ambulatory Difficulty
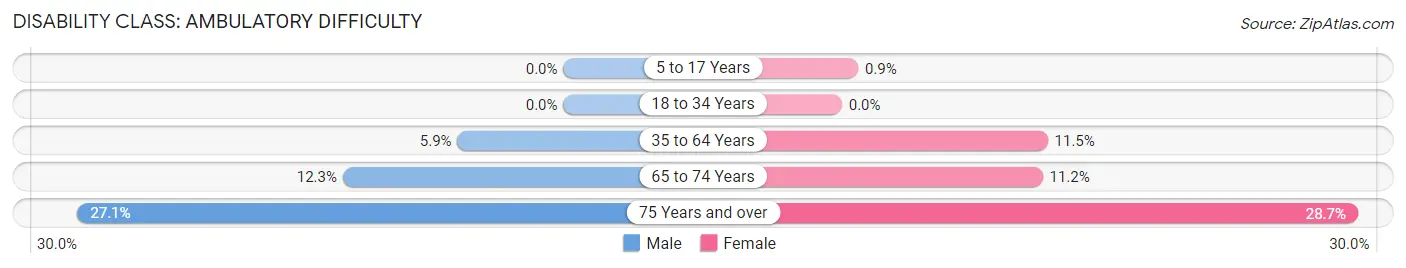
| Age Bracket | Male | Female |
| 5 to 17 Years | 0 (0.0%) | 10 (0.9%) |
| 18 to 34 Years | 0 (0.0%) | 0 (0.0%) |
| 35 to 64 Years | 174 (5.9%) | 371 (11.5%) |
| 65 to 74 Years | 332 (12.3%) | 311 (11.2%) |
| 75 Years and over | 568 (27.1%) | 472 (28.7%) |
Disability Class: Self-Care Difficulty
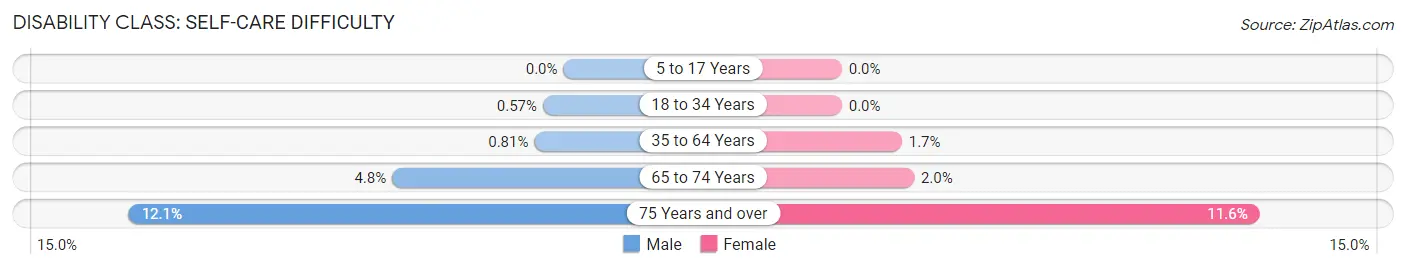
| Age Bracket | Male | Female |
| 5 to 17 Years | 0 (0.0%) | 0 (0.0%) |
| 18 to 34 Years | 7 (0.6%) | 0 (0.0%) |
| 35 to 64 Years | 24 (0.8%) | 54 (1.7%) |
| 65 to 74 Years | 129 (4.8%) | 56 (2.0%) |
| 75 Years and over | 254 (12.1%) | 191 (11.6%) |
Technology Access in Mesquite
Computing Device Access in Mesquite
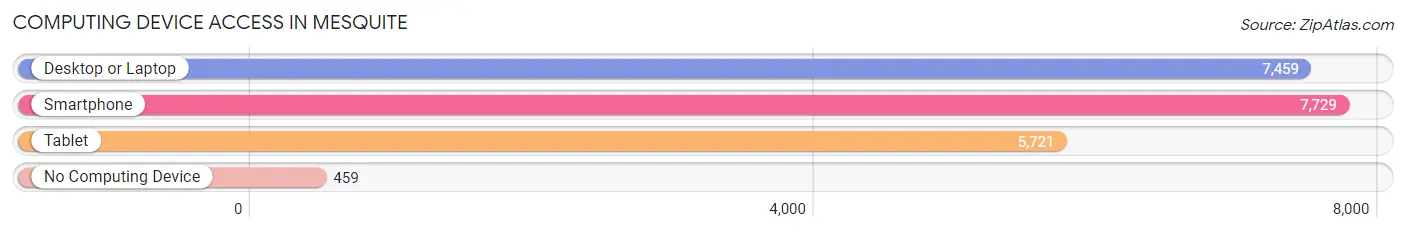
| Device Type | # Households | % Households |
| Desktop or Laptop | 7,459 | 82.4% |
| Smartphone | 7,729 | 85.4% |
| Tablet | 5,721 | 63.2% |
| No Computing Device | 459 | 5.1% |
| Total | 9,048 | 100.0% |
Internet Access in Mesquite
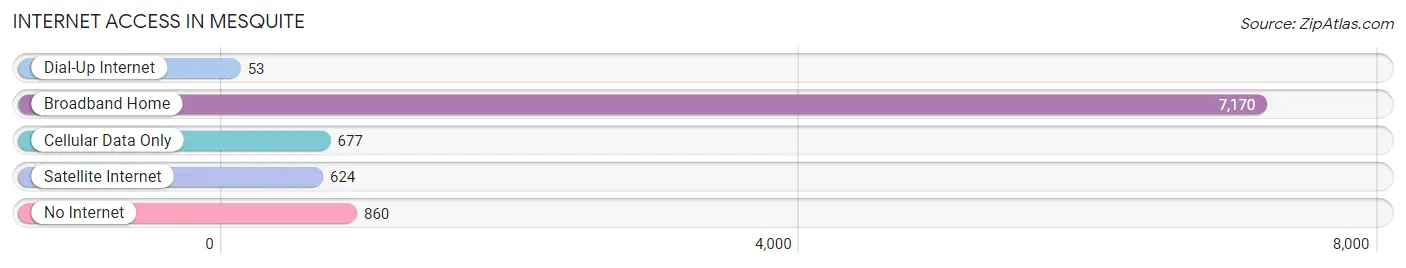
| Internet Type | # Households | % Households |
| Dial-Up Internet | 53 | 0.6% |
| Broadband Home | 7,170 | 79.2% |
| Cellular Data Only | 677 | 7.5% |
| Satellite Internet | 624 | 6.9% |
| No Internet | 860 | 9.5% |
| Total | 9,048 | 100.0% |
Mesquite Summary
Mesquite is a city located in Clark County, Nevada, United States, approximately 80 miles northeast of Las Vegas. It is located near the Arizona border and is the largest city in Clark County. The population was 15,276 at the 2010 census.
Geography
Mesquite is located at 36°47′3″N 114°48′59″W (36.784167, -114.816389). According to the United States Census Bureau, the city has a total area of 16.2 square miles (41.8 km2), all of it land.
History
Mesquite was founded in 1880 as a stop on the San Pedro, Los Angeles and Salt Lake Railroad. The city was named after the mesquite trees that grew in the area. The city was incorporated in 1984.
Economy
Mesquite is a popular tourist destination due to its proximity to Las Vegas. The city is home to several casinos, including the Eureka Casino Resort, the Virgin River Hotel and Casino, and the CasaBlanca Resort and Casino. The city also has a variety of restaurants, shopping centers, and other attractions.
Demographics
As of the census of 2010, there were 15,276 people, 6,945 households, and 4,072 families residing in the city. The population density was 941.2 people per square mile (362.9/km2). There were 8,817 housing units at an average density of 545.3 per square mile (210.7/km2). The racial makeup of the city was 79.2% White, 1.2% African American, 1.3% Native American, 1.4% Asian, 0.3% Pacific Islander, 13.8% from other races, and 2.6% from two or more races. Hispanic or Latino of any race were 24.8% of the population.
There were 6,945 households, out of which 24.2% had children under the age of 18 living with them, 44.2% were married couples living together, 11.7% had a female householder with no husband present, and 38.7% were non-families. 32.2% of all households were made up of individuals, and 13.5% had someone living alone who was 65 years of age or older. The average household size was 2.20 and the average family size was 2.76.
In the city, the population was spread out, with 20.9% under the age of 18, 7.3% from 18 to 24, 24.6% from 25 to 44, 27.7% from 45 to 64, and 19.5% who were 65 years of age or older. The median age was 42 years. For every 100 females, there were 97.9 males. For every 100 females age 18 and over, there were 95.2 males.
The median income for a household in the city was $37,813, and the median income for a family was $45,906. Males had a median income of $31,813 versus $22,813 for females. The per capita income for the city was $20,945. About 9.2% of families and 11.9% of the population were below the poverty line, including 16.2% of those under age 18 and 6.3% of those age 65 or over.
Common Questions
What is Per Capita Income in Mesquite?
Per Capita income in Mesquite is $37,788.
What is the Median Family Income in Mesquite?
Median Family Income in Mesquite is $76,653.
What is the Median Household income in Mesquite?
Median Household Income in Mesquite is $69,146.
What is Income or Wage Gap in Mesquite?
Income or Wage Gap in Mesquite is 29.7%.
Women in Mesquite earn 70.3 cents for every dollar earned by a man.
What is Family Income Deficit in Mesquite?
Family Income Deficit in Mesquite is $8,525.
Families that are below poverty line in Mesquite earn $8,525 less on average than the poverty threshold level.
What is Inequality or Gini Index in Mesquite?
Inequality or Gini Index in Mesquite is 0.40.
What is the Total Population of Mesquite?
Total Population of Mesquite is 20,659.
What is the Total Male Population of Mesquite?
Total Male Population of Mesquite is 10,514.
What is the Total Female Population of Mesquite?
Total Female Population of Mesquite is 10,145.
What is the Ratio of Males per 100 Females in Mesquite?
There are 103.64 Males per 100 Females in Mesquite.
What is the Ratio of Females per 100 Males in Mesquite?
There are 96.49 Females per 100 Males in Mesquite.
What is the Median Population Age in Mesquite?
Median Population Age in Mesquite is 62.3 Years.
What is the Average Family Size in Mesquite
Average Family Size in Mesquite is 2.7 People.
What is the Average Household Size in Mesquite
Average Household Size in Mesquite is 2.3 People.
How Large is the Labor Force in Mesquite?
There are 6,878 People in the Labor Forcein in Mesquite.
What is the Percentage of People in the Labor Force in Mesquite?
37.8% of People are in the Labor Force in Mesquite.
What is the Unemployment Rate in Mesquite?
Unemployment Rate in Mesquite is 7.6%.