Winnemucca, NV Map & Demographics
Winnemucca Map
Winnemucca Overview
$41,467
PER CAPITA INCOME
$110,139
AVG FAMILY INCOME
$78,161
AVG HOUSEHOLD INCOME
58.5%
WAGE / INCOME GAP [ % ]
41.5¢/ $1
WAGE / INCOME GAP [ $ ]
0.50
INEQUALITY / GINI INDEX
8,354
TOTAL POPULATION
4,494
MALE POPULATION
3,860
FEMALE POPULATION
116.42
MALES / 100 FEMALES
85.89
FEMALES / 100 MALES
33.9
MEDIAN AGE
3.2
AVG FAMILY SIZE
2.3
AVG HOUSEHOLD SIZE
4,268
LABOR FORCE [ PEOPLE ]
67.2%
PERCENT IN LABOR FORCE
4.4%
UNEMPLOYMENT RATE
Winnemucca Area Codes
Income in Winnemucca
Income Overview in Winnemucca
Per Capita Income in Winnemucca is $41,467, while median incomes of families and households are $110,139 and $78,161 respectively.
| Characteristic | Number | Measure |
| Per Capita Income | 8,354 | $41,467 |
| Median Family Income | 1,964 | $110,139 |
| Mean Family Income | 1,964 | $114,159 |
| Median Household Income | 3,643 | $78,161 |
| Mean Household Income | 3,643 | $101,157 |
| Income Deficit | 1,964 | $0 |
| Wage / Income Gap (%) | 8,354 | 58.47% |
| Wage / Income Gap ($) | 8,354 | 41.53¢ per $1 |
| Gini / Inequality Index | 8,354 | 0.50 |
Earnings by Sex in Winnemucca
Average Earnings in Winnemucca are $65,318, $79,767 for men and $33,128 for women, a difference of 58.5%.
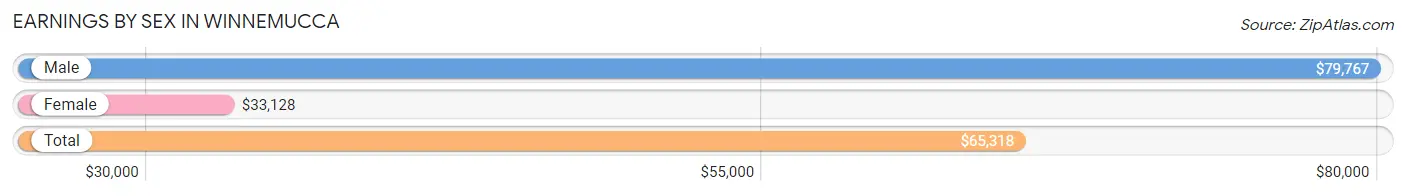
| Sex | Number | Average Earnings |
| Male | 2,594 (59.5%) | $79,767 |
| Female | 1,765 (40.5%) | $33,128 |
| Total | 4,359 (100.0%) | $65,318 |
Earnings by Sex by Income Bracket in Winnemucca
The most common earnings brackets in Winnemucca are $100,000+ for men (871 | 33.6%) and $30,000 to $34,999 for women (217 | 12.3%).
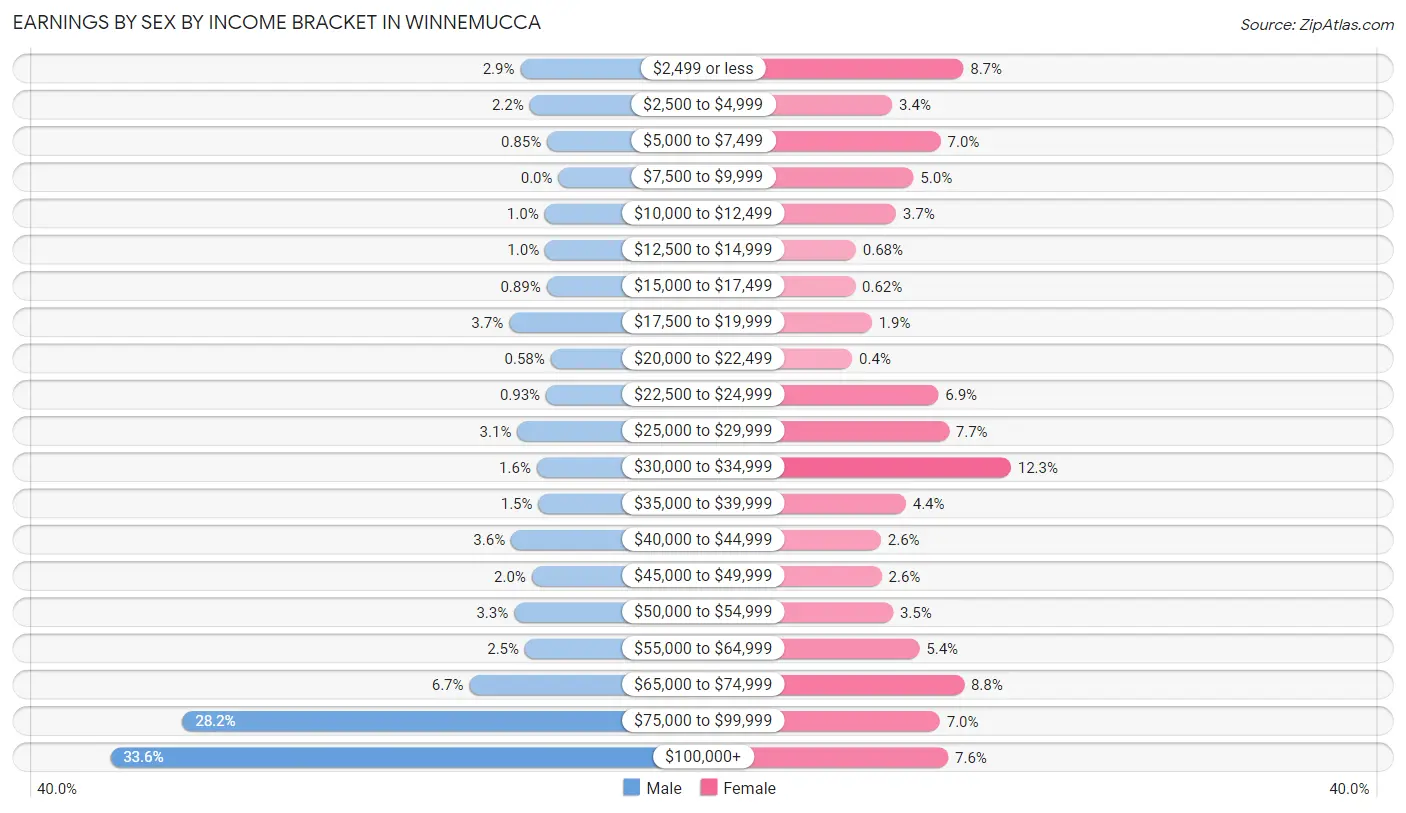
| Income | Male | Female |
| $2,499 or less | 74 (2.9%) | 154 (8.7%) |
| $2,500 to $4,999 | 56 (2.2%) | 60 (3.4%) |
| $5,000 to $7,499 | 22 (0.9%) | 124 (7.0%) |
| $7,500 to $9,999 | 0 (0.0%) | 88 (5.0%) |
| $10,000 to $12,499 | 27 (1.0%) | 65 (3.7%) |
| $12,500 to $14,999 | 26 (1.0%) | 12 (0.7%) |
| $15,000 to $17,499 | 23 (0.9%) | 11 (0.6%) |
| $17,500 to $19,999 | 96 (3.7%) | 33 (1.9%) |
| $20,000 to $22,499 | 15 (0.6%) | 7 (0.4%) |
| $22,500 to $24,999 | 24 (0.9%) | 121 (6.9%) |
| $25,000 to $29,999 | 80 (3.1%) | 135 (7.6%) |
| $30,000 to $34,999 | 42 (1.6%) | 217 (12.3%) |
| $35,000 to $39,999 | 39 (1.5%) | 78 (4.4%) |
| $40,000 to $44,999 | 92 (3.5%) | 45 (2.5%) |
| $45,000 to $49,999 | 52 (2.0%) | 46 (2.6%) |
| $50,000 to $54,999 | 86 (3.3%) | 61 (3.5%) |
| $55,000 to $64,999 | 65 (2.5%) | 96 (5.4%) |
| $65,000 to $74,999 | 173 (6.7%) | 155 (8.8%) |
| $75,000 to $99,999 | 731 (28.2%) | 123 (7.0%) |
| $100,000+ | 871 (33.6%) | 134 (7.6%) |
| Total | 2,594 (100.0%) | 1,765 (100.0%) |
Earnings by Sex by Educational Attainment in Winnemucca
Average earnings in Winnemucca are $85,803 for men and $34,100 for women, a difference of 60.3%. Men with an educational attainment of college or associate's degree enjoy the highest average annual earnings of $104,455, while those with graduate degree education earn the least with $56,146. Women with an educational attainment of graduate degree earn the most with the average annual earnings of $64,756, while those with high school diploma education have the smallest earnings of $32,500.
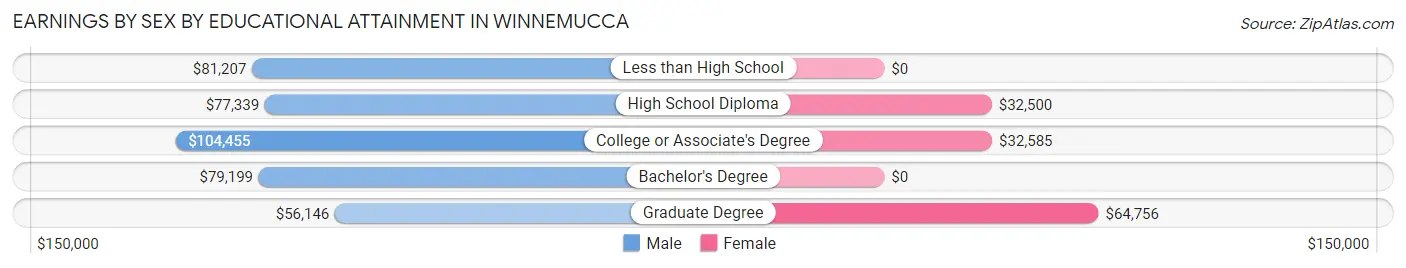
| Educational Attainment | Male Income | Female Income |
| Less than High School | $81,207 | $0 |
| High School Diploma | $77,339 | $32,500 |
| College or Associate's Degree | $104,455 | $32,585 |
| Bachelor's Degree | $79,199 | $0 |
| Graduate Degree | $56,146 | $64,756 |
| Total | $85,803 | $34,100 |
Family Income in Winnemucca
Family Income Brackets in Winnemucca
According to the Winnemucca family income data, there are 481 families falling into the $100,000 to $149,999 income range, which is the most common income bracket and makes up 24.5% of all families. Conversely, the less than $10,000 income bracket is the least frequent group with only 20 families (1.0%) belonging to this category.
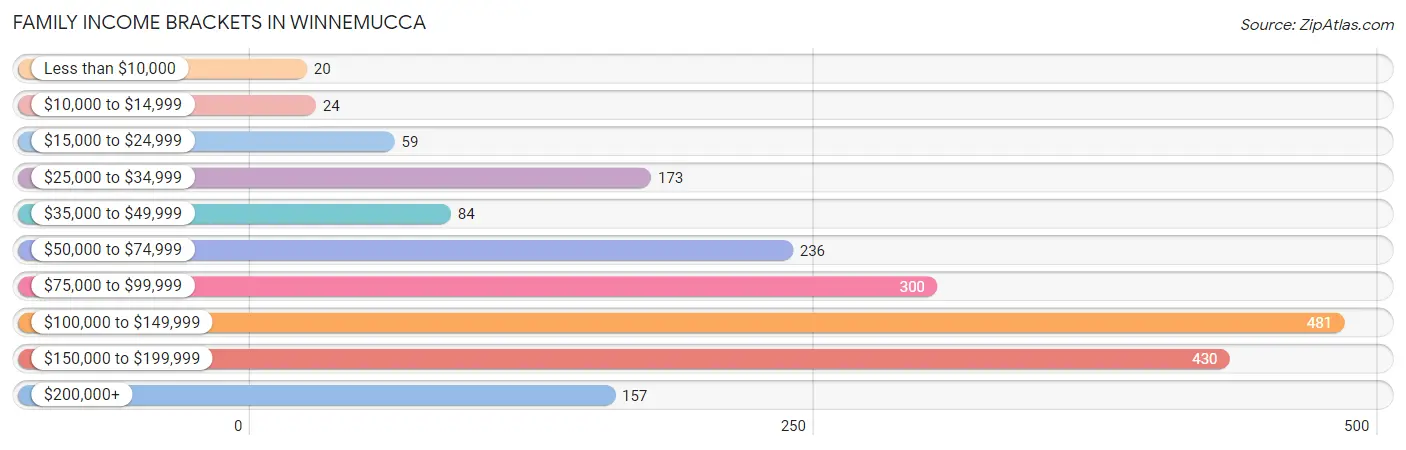
| Income Bracket | # Families | % Families |
| Less than $10,000 | 20 | 1.0% |
| $10,000 to $14,999 | 24 | 1.2% |
| $15,000 to $24,999 | 59 | 3.0% |
| $25,000 to $34,999 | 173 | 8.8% |
| $35,000 to $49,999 | 84 | 4.3% |
| $50,000 to $74,999 | 236 | 12.0% |
| $75,000 to $99,999 | 300 | 15.3% |
| $100,000 to $149,999 | 481 | 24.5% |
| $150,000 to $199,999 | 430 | 21.9% |
| $200,000+ | 157 | 8.0% |
Family Income by Famaliy Size in Winnemucca
4-person families (415 | 21.1%) account for the highest median family income in Winnemucca with $153,064 per family, while 2-person families (1,006 | 51.2%) have the highest median income of $46,548 per family member.
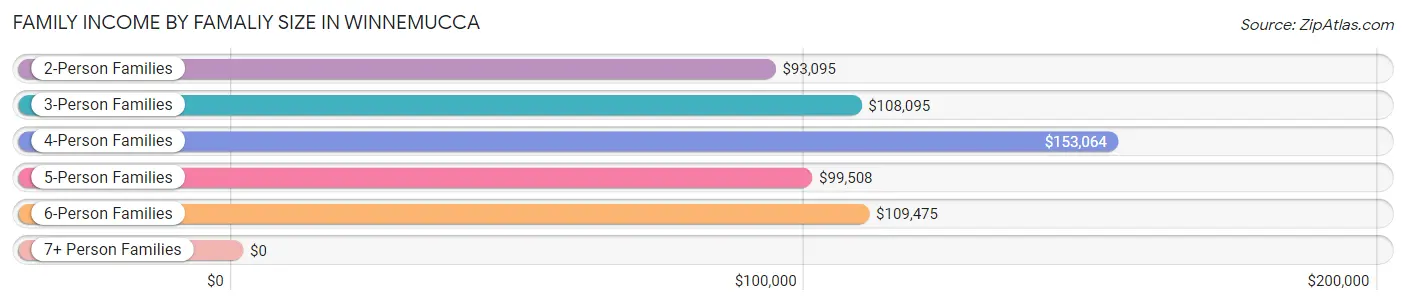
| Income Bracket | # Families | Median Income |
| 2-Person Families | 1,006 (51.2%) | $93,095 |
| 3-Person Families | 224 (11.4%) | $108,095 |
| 4-Person Families | 415 (21.1%) | $153,064 |
| 5-Person Families | 211 (10.7%) | $99,508 |
| 6-Person Families | 99 (5.0%) | $109,475 |
| 7+ Person Families | 9 (0.5%) | $0 |
| Total | 1,964 (100.0%) | $110,139 |
Family Income by Number of Earners in Winnemucca
The median family income in Winnemucca is $110,139, with families comprising 3+ earners (160) having the highest median family income of $139,615, while families with no earners (189) have the lowest median family income of $70,313, accounting for 8.2% and 9.6% of families, respectively.
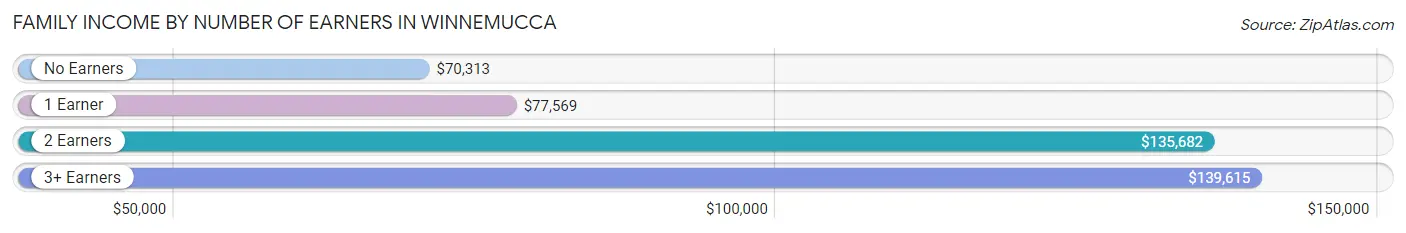
| Number of Earners | # Families | Median Income |
| No Earners | 189 (9.6%) | $70,313 |
| 1 Earner | 513 (26.1%) | $77,569 |
| 2 Earners | 1,102 (56.1%) | $135,682 |
| 3+ Earners | 160 (8.2%) | $139,615 |
| Total | 1,964 (100.0%) | $110,139 |
Household Income in Winnemucca
Household Income Brackets in Winnemucca
With 590 households falling in the category, the $100,000 to $149,999 income range is the most frequent in Winnemucca, accounting for 16.2% of all households. In contrast, only 171 households (4.7%) fall into the $35,000 to $49,999 income bracket, making it the least populous group.
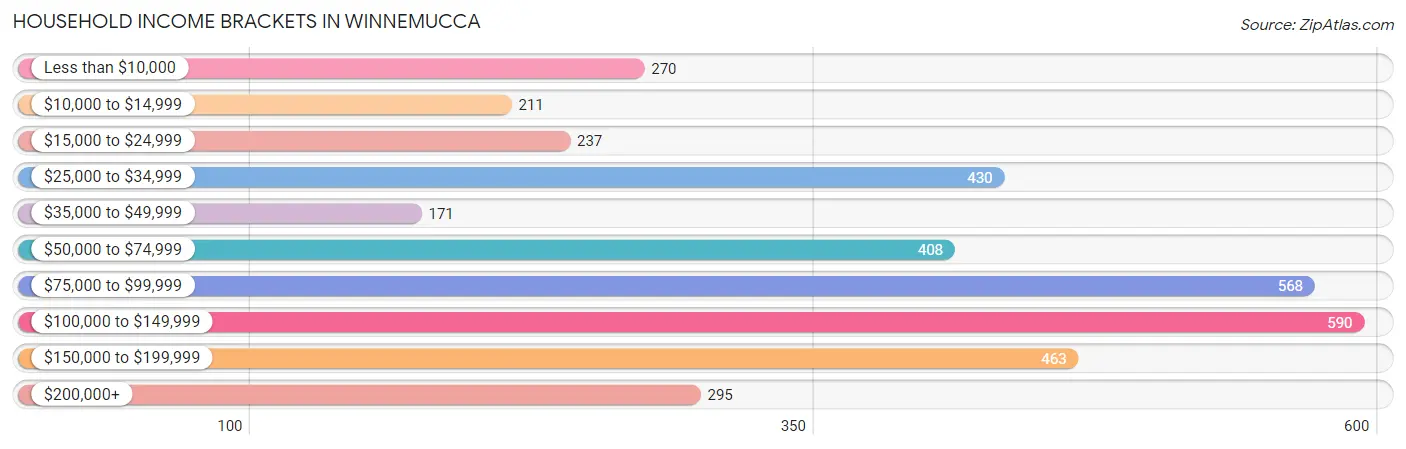
| Income Bracket | # Households | % Households |
| Less than $10,000 | 270 | 7.4% |
| $10,000 to $14,999 | 211 | 5.8% |
| $15,000 to $24,999 | 237 | 6.5% |
| $25,000 to $34,999 | 430 | 11.8% |
| $35,000 to $49,999 | 171 | 4.7% |
| $50,000 to $74,999 | 408 | 11.2% |
| $75,000 to $99,999 | 568 | 15.6% |
| $100,000 to $149,999 | 590 | 16.2% |
| $150,000 to $199,999 | 463 | 12.7% |
| $200,000+ | 295 | 8.1% |
Household Income by Householder Age in Winnemucca
The median household income in Winnemucca is $78,161, with the highest median household income of $117,542 found in the 25 to 44 years age bracket for the primary householder. A total of 1,321 households (36.3%) fall into this category. Meanwhile, the 15 to 24 years age bracket for the primary householder has the lowest median household income of $21,851, with 223 households (6.1%) in this group.
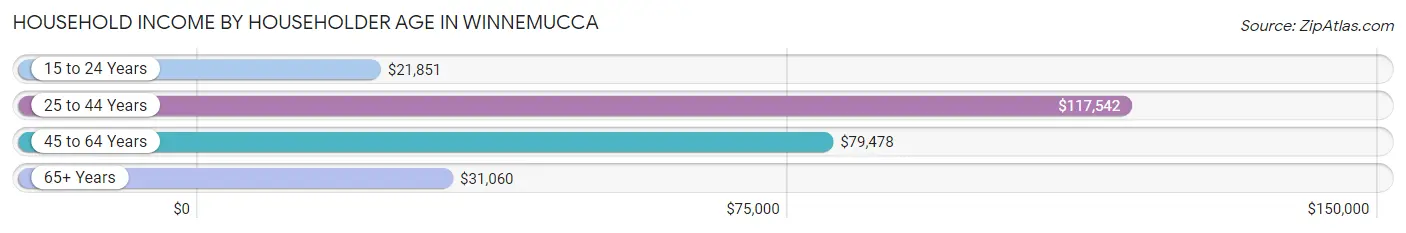
| Income Bracket | # Households | Median Income |
| 15 to 24 Years | 223 (6.1%) | $21,851 |
| 25 to 44 Years | 1,321 (36.3%) | $117,542 |
| 45 to 64 Years | 1,148 (31.5%) | $79,478 |
| 65+ Years | 951 (26.1%) | $31,060 |
| Total | 3,643 (100.0%) | $78,161 |
Poverty in Winnemucca
Income Below Poverty by Sex and Age in Winnemucca
With 8.5% poverty level for males and 17.0% for females among the residents of Winnemucca, 16 and 17 year old males and 16 and 17 year old females are the most vulnerable to poverty, with 78 males (54.9%) and 60 females (52.6%) in their respective age groups living below the poverty level.
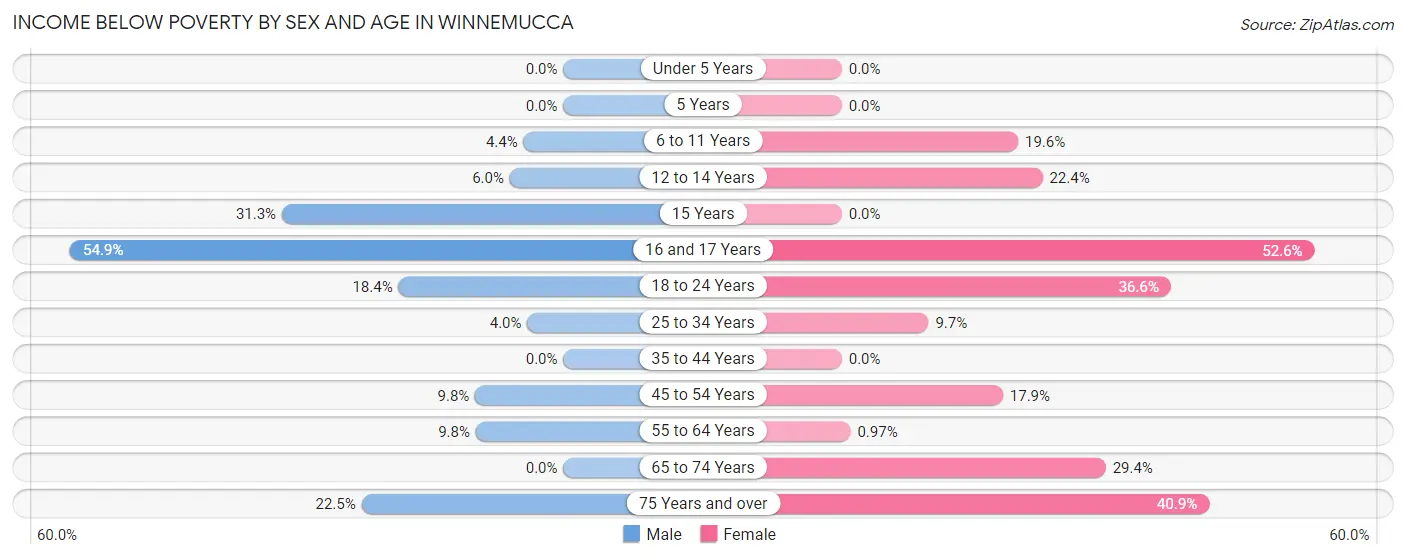
| Age Bracket | Male | Female |
| Under 5 Years | 0 (0.0%) | 0 (0.0%) |
| 5 Years | 0 (0.0%) | 0 (0.0%) |
| 6 to 11 Years | 17 (4.4%) | 75 (19.6%) |
| 12 to 14 Years | 18 (6.0%) | 40 (22.4%) |
| 15 Years | 21 (31.3%) | 0 (0.0%) |
| 16 and 17 Years | 78 (54.9%) | 60 (52.6%) |
| 18 to 24 Years | 65 (18.4%) | 111 (36.6%) |
| 25 to 34 Years | 29 (4.0%) | 60 (9.7%) |
| 35 to 44 Years | 0 (0.0%) | 0 (0.0%) |
| 45 to 54 Years | 39 (9.8%) | 80 (17.9%) |
| 55 to 64 Years | 59 (9.8%) | 3 (1.0%) |
| 65 to 74 Years | 0 (0.0%) | 97 (29.4%) |
| 75 Years and over | 51 (22.5%) | 126 (40.9%) |
| Total | 377 (8.5%) | 652 (17.0%) |
Income Above Poverty by Sex and Age in Winnemucca
According to the poverty statistics in Winnemucca, males aged under 5 years and females aged under 5 years are the age groups that are most secure financially, with 100.0% of males and 100.0% of females in these age groups living above the poverty line.
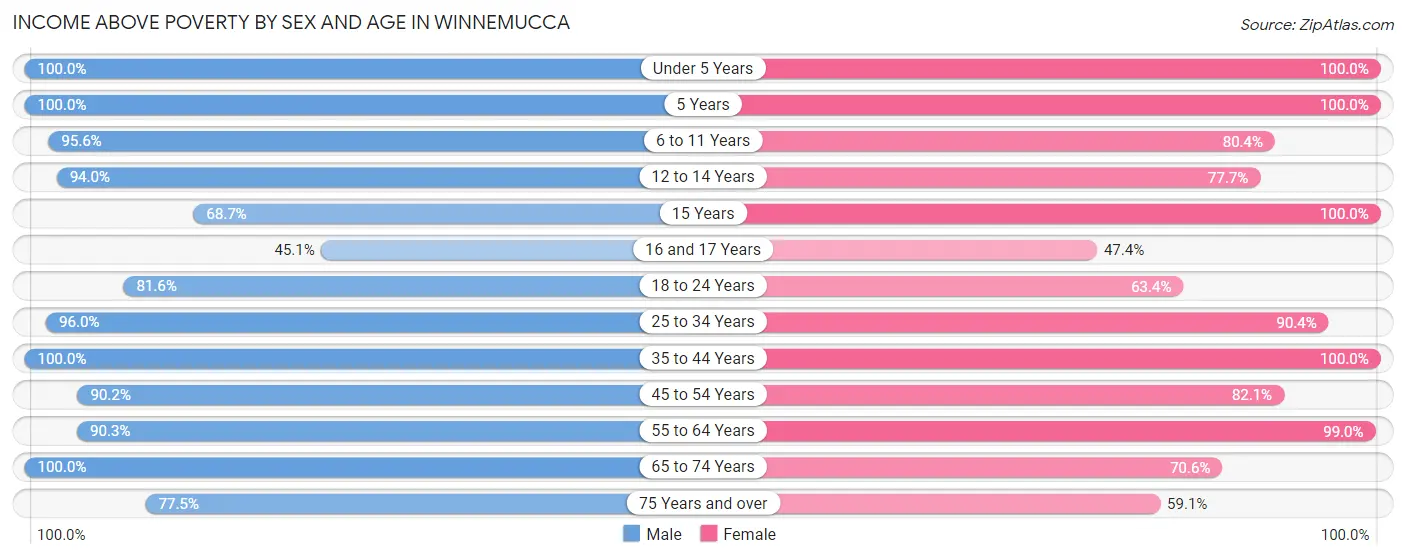
| Age Bracket | Male | Female |
| Under 5 Years | 217 (100.0%) | 307 (100.0%) |
| 5 Years | 80 (100.0%) | 63 (100.0%) |
| 6 to 11 Years | 367 (95.6%) | 307 (80.4%) |
| 12 to 14 Years | 284 (94.0%) | 139 (77.6%) |
| 15 Years | 46 (68.7%) | 21 (100.0%) |
| 16 and 17 Years | 64 (45.1%) | 54 (47.4%) |
| 18 to 24 Years | 289 (81.6%) | 192 (63.4%) |
| 25 to 34 Years | 694 (96.0%) | 562 (90.3%) |
| 35 to 44 Years | 564 (100.0%) | 461 (100.0%) |
| 45 to 54 Years | 358 (90.2%) | 366 (82.1%) |
| 55 to 64 Years | 546 (90.2%) | 305 (99.0%) |
| 65 to 74 Years | 375 (100.0%) | 233 (70.6%) |
| 75 Years and over | 176 (77.5%) | 182 (59.1%) |
| Total | 4,060 (91.5%) | 3,192 (83.0%) |
Income Below Poverty Among Married-Couple Families in Winnemucca
The poverty statistics for married-couple families in Winnemucca show that 1.3% or 20 of the total 1,567 families live below the poverty line. Families with no children have the highest poverty rate of 2.4%, comprising of 20 families. On the other hand, families with 1 or 2 children have the lowest poverty rate of 0.0%, which includes 0 families.
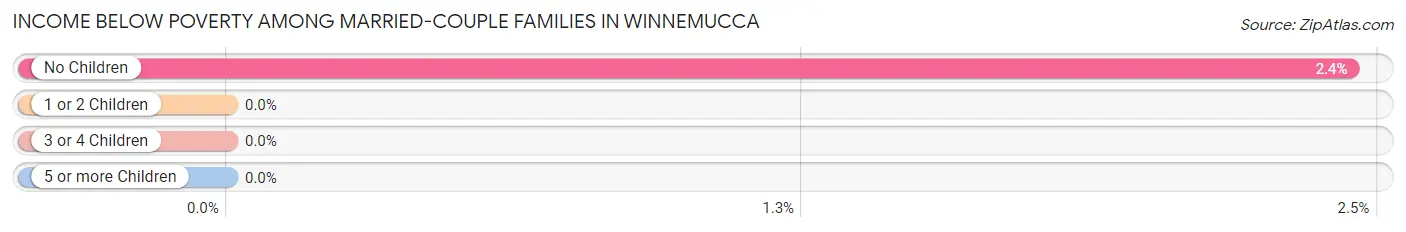
| Children | Above Poverty | Below Poverty |
| No Children | 798 (97.6%) | 20 (2.4%) |
| 1 or 2 Children | 577 (100.0%) | 0 (0.0%) |
| 3 or 4 Children | 163 (100.0%) | 0 (0.0%) |
| 5 or more Children | 9 (100.0%) | 0 (0.0%) |
| Total | 1,547 (98.7%) | 20 (1.3%) |
Income Below Poverty Among Single-Parent Households in Winnemucca
According to the poverty data in Winnemucca, 40.6% or 54 single-father households and 12.1% or 32 single-mother households are living below the poverty line. Among single-father households, those with 3 or 4 children have the highest poverty rate, with 54 households (91.5%) experiencing poverty. Likewise, among single-mother households, those with 5 or more children have the highest poverty rate, with 10 households (100.0%) falling below the poverty line.
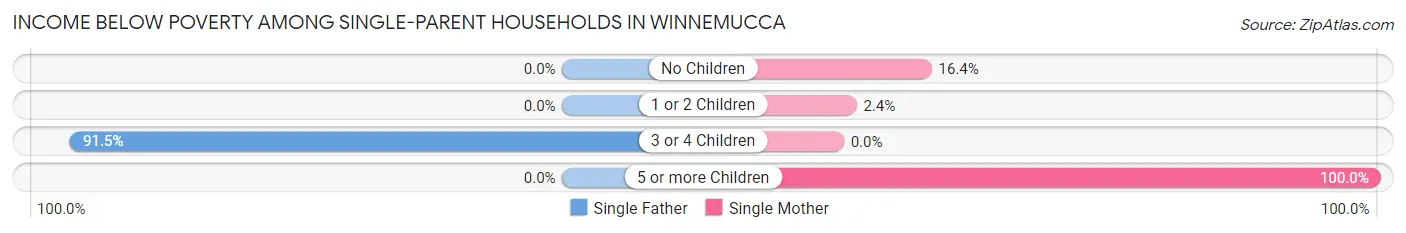
| Children | Single Father | Single Mother |
| No Children | 0 (0.0%) | 19 (16.4%) |
| 1 or 2 Children | 0 (0.0%) | 3 (2.4%) |
| 3 or 4 Children | 54 (91.5%) | 0 (0.0%) |
| 5 or more Children | 0 (0.0%) | 10 (100.0%) |
| Total | 54 (40.6%) | 32 (12.1%) |
Income Below Poverty Among Married-Couple vs Single-Parent Households in Winnemucca
The poverty data for Winnemucca shows that 20 of the married-couple family households (1.3%) and 86 of the single-parent households (21.7%) are living below the poverty level. Within the married-couple family households, those with no children have the highest poverty rate, with 20 households (2.4%) falling below the poverty line. Among the single-parent households, those with 5 or more children have the highest poverty rate, with 10 household (100.0%) living below poverty.
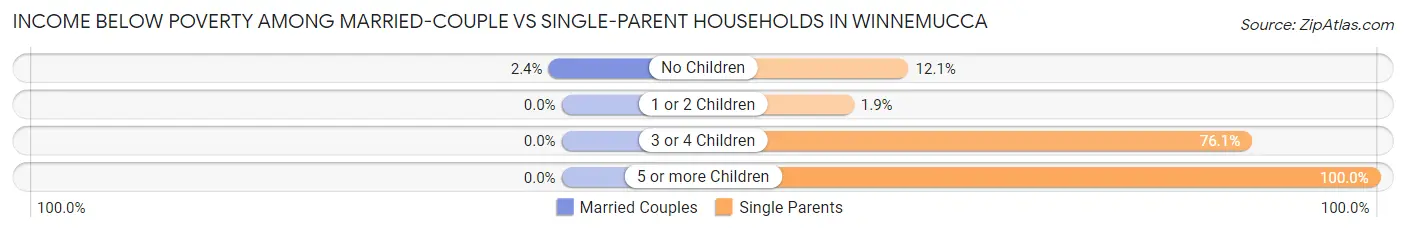
| Children | Married-Couple Families | Single-Parent Households |
| No Children | 20 (2.4%) | 19 (12.1%) |
| 1 or 2 Children | 0 (0.0%) | 3 (1.9%) |
| 3 or 4 Children | 0 (0.0%) | 54 (76.1%) |
| 5 or more Children | 0 (0.0%) | 10 (100.0%) |
| Total | 20 (1.3%) | 86 (21.7%) |
Race in Winnemucca
The most populous races in Winnemucca are White / Caucasian (6,258 | 74.9%), Hispanic or Latino (2,261 | 27.1%), and Two or more Races (893 | 10.7%).
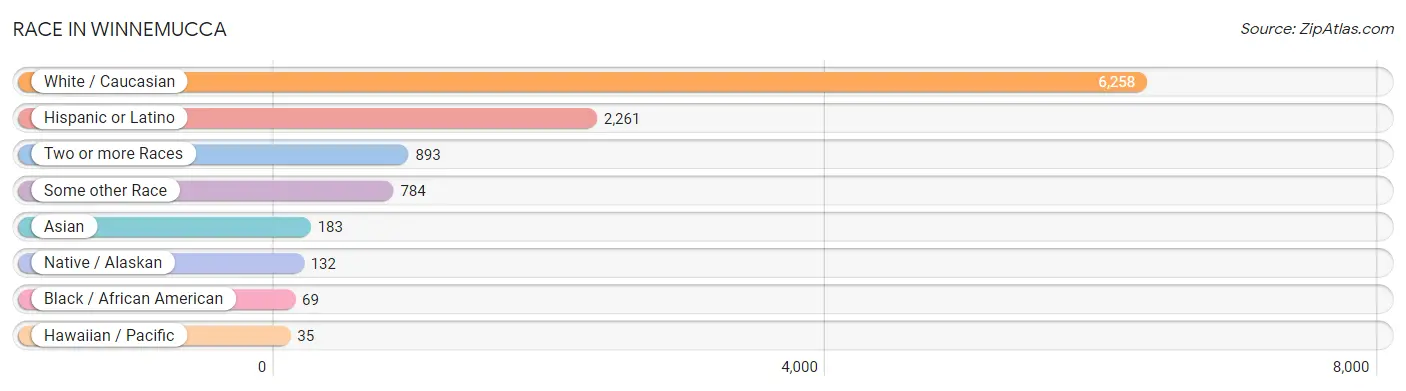
| Race | # Population | % Population |
| Asian | 183 | 2.2% |
| Black / African American | 69 | 0.8% |
| Hawaiian / Pacific | 35 | 0.4% |
| Hispanic or Latino | 2,261 | 27.1% |
| Native / Alaskan | 132 | 1.6% |
| White / Caucasian | 6,258 | 74.9% |
| Two or more Races | 893 | 10.7% |
| Some other Race | 784 | 9.4% |
| Total | 8,354 | 100.0% |
Ancestry in Winnemucca
The most populous ancestries reported in Winnemucca are Mexican (2,082 | 24.9%), German (1,862 | 22.3%), Irish (1,110 | 13.3%), English (1,003 | 12.0%), and Italian (557 | 6.7%), together accounting for 79.2% of all Winnemucca residents.
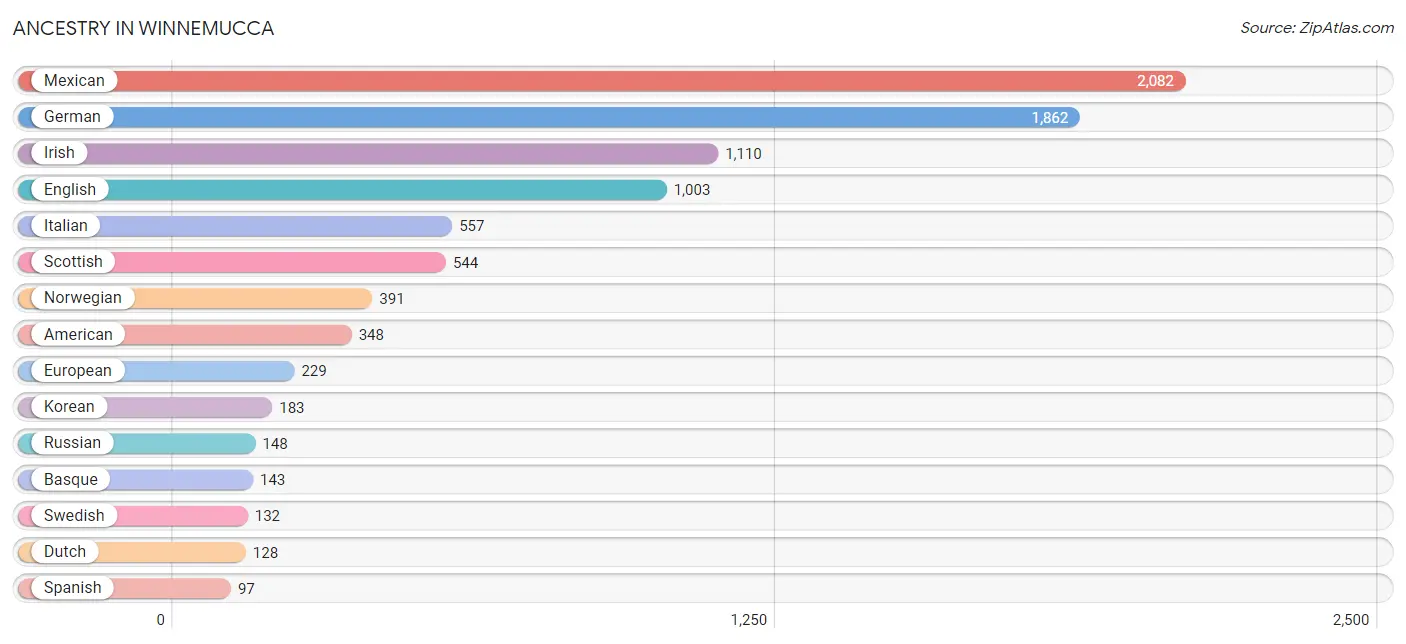
| Ancestry | # Population | % Population |
| American | 348 | 4.2% |
| Arab | 25 | 0.3% |
| Austrian | 12 | 0.1% |
| Basque | 143 | 1.7% |
| Bhutanese | 2 | 0.0% |
| British | 43 | 0.5% |
| Canadian | 29 | 0.4% |
| Cherokee | 36 | 0.4% |
| Choctaw | 13 | 0.2% |
| Danish | 17 | 0.2% |
| Dutch | 128 | 1.5% |
| Egyptian | 5 | 0.1% |
| English | 1,003 | 12.0% |
| European | 229 | 2.7% |
| French | 84 | 1.0% |
| French Canadian | 38 | 0.4% |
| German | 1,862 | 22.3% |
| Ghanaian | 20 | 0.2% |
| Greek | 7 | 0.1% |
| Hungarian | 30 | 0.4% |
| Icelander | 14 | 0.2% |
| Irish | 1,110 | 13.3% |
| Italian | 557 | 6.7% |
| Korean | 183 | 2.2% |
| Lebanese | 20 | 0.2% |
| Mexican | 2,082 | 24.9% |
| Native Hawaiian | 35 | 0.4% |
| Northern European | 22 | 0.3% |
| Norwegian | 391 | 4.7% |
| Paiute | 91 | 1.1% |
| Polish | 64 | 0.8% |
| Puerto Rican | 25 | 0.3% |
| Russian | 148 | 1.8% |
| Scandinavian | 70 | 0.8% |
| Scottish | 544 | 6.5% |
| Shoshone | 15 | 0.2% |
| Sioux | 22 | 0.3% |
| Spaniard | 57 | 0.7% |
| Spanish | 97 | 1.2% |
| Subsaharan African | 20 | 0.2% |
| Swedish | 132 | 1.6% |
| Swiss | 6 | 0.1% | View All 42 Rows |
Immigrants in Winnemucca
The most numerous immigrant groups reported in Winnemucca came from Central America (621 | 7.4%), Latin America (621 | 7.4%), Mexico (621 | 7.4%), Asia (156 | 1.9%), and Philippines (156 | 1.9%), together accounting for 26.0% of all Winnemucca residents.

| Immigration Origin | # Population | % Population |
| Africa | 38 | 0.4% |
| Asia | 156 | 1.9% |
| Canada | 54 | 0.6% |
| Central America | 621 | 7.4% |
| Egypt | 5 | 0.1% |
| Europe | 23 | 0.3% |
| Germany | 4 | 0.1% |
| Ghana | 20 | 0.2% |
| Latin America | 621 | 7.4% |
| Mexico | 621 | 7.4% |
| Northern Africa | 5 | 0.1% |
| Philippines | 156 | 1.9% |
| South Africa | 13 | 0.2% |
| South Eastern Asia | 156 | 1.9% |
| Southern Europe | 19 | 0.2% |
| Spain | 19 | 0.2% |
| Western Africa | 20 | 0.2% |
| Western Europe | 4 | 0.1% | View All 18 Rows |
Sex and Age in Winnemucca
Sex and Age in Winnemucca
The most populous age groups in Winnemucca are 60 to 64 Years (445 | 9.9%) for men and 5 to 9 Years (351 | 9.1%) for women.
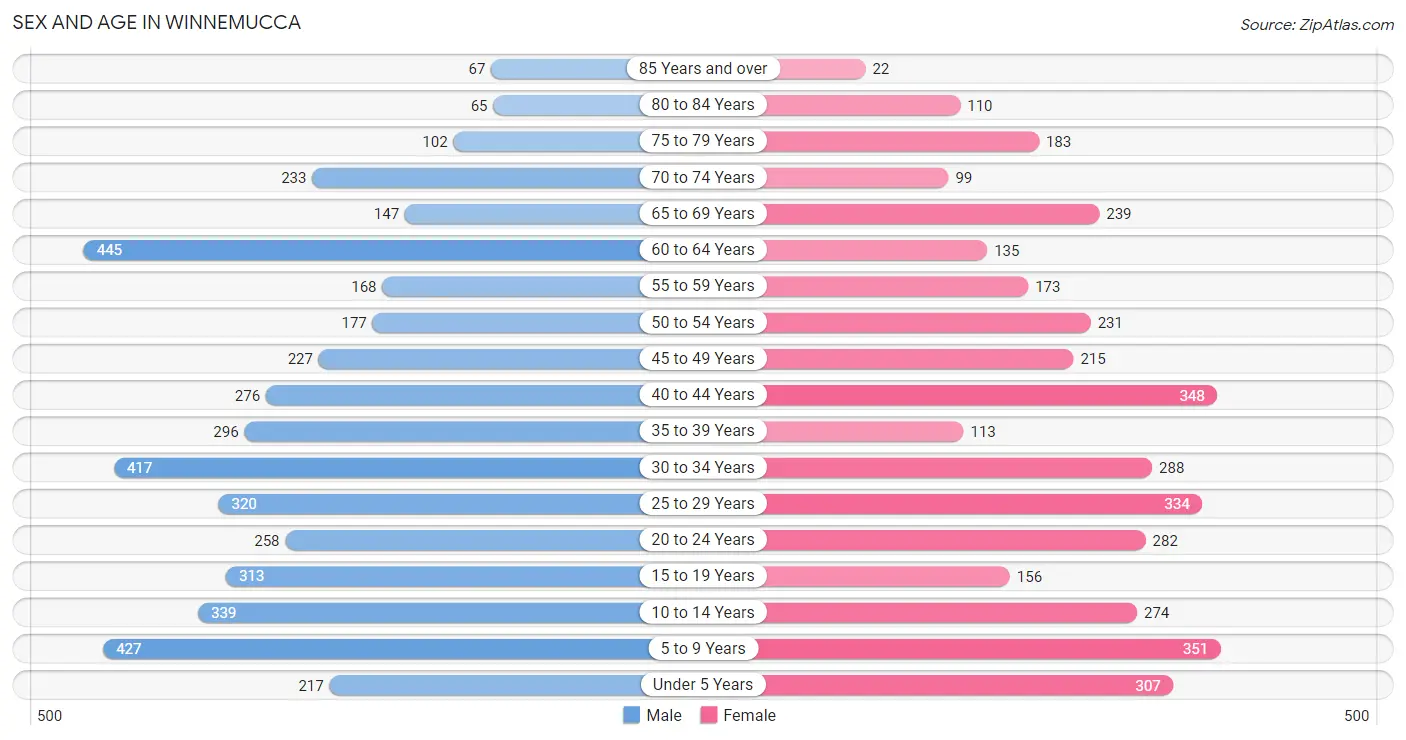
| Age Bracket | Male | Female |
| Under 5 Years | 217 (4.8%) | 307 (8.0%) |
| 5 to 9 Years | 427 (9.5%) | 351 (9.1%) |
| 10 to 14 Years | 339 (7.5%) | 274 (7.1%) |
| 15 to 19 Years | 313 (7.0%) | 156 (4.0%) |
| 20 to 24 Years | 258 (5.7%) | 282 (7.3%) |
| 25 to 29 Years | 320 (7.1%) | 334 (8.6%) |
| 30 to 34 Years | 417 (9.3%) | 288 (7.5%) |
| 35 to 39 Years | 296 (6.6%) | 113 (2.9%) |
| 40 to 44 Years | 276 (6.1%) | 348 (9.0%) |
| 45 to 49 Years | 227 (5.1%) | 215 (5.6%) |
| 50 to 54 Years | 177 (3.9%) | 231 (6.0%) |
| 55 to 59 Years | 168 (3.7%) | 173 (4.5%) |
| 60 to 64 Years | 445 (9.9%) | 135 (3.5%) |
| 65 to 69 Years | 147 (3.3%) | 239 (6.2%) |
| 70 to 74 Years | 233 (5.2%) | 99 (2.6%) |
| 75 to 79 Years | 102 (2.3%) | 183 (4.7%) |
| 80 to 84 Years | 65 (1.5%) | 110 (2.9%) |
| 85 Years and over | 67 (1.5%) | 22 (0.6%) |
| Total | 4,494 (100.0%) | 3,860 (100.0%) |
Families and Households in Winnemucca
Median Family Size in Winnemucca
The median family size in Winnemucca is 3.21 persons per family, with married-couple families (1,567 | 79.8%) accounting for the largest median family size of 3.25 persons per family. On the other hand, single male/father families (133 | 6.8%) represent the smallest median family size with 2.70 persons per family.
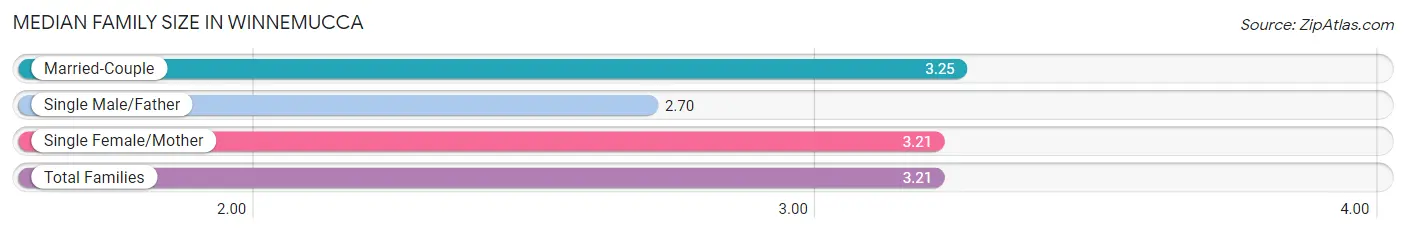
| Family Type | # Families | Family Size |
| Married-Couple | 1,567 (79.8%) | 3.25 |
| Single Male/Father | 133 (6.8%) | 2.70 |
| Single Female/Mother | 264 (13.4%) | 3.21 |
| Total Families | 1,964 (100.0%) | 3.21 |
Median Household Size in Winnemucca
The median household size in Winnemucca is 2.27 persons per household, with single female/mother households (264 | 7.2%) accounting for the largest median household size of 3.34 persons per household. non-family households (1,679 | 46.1%) represent the smallest median household size with 1.15 persons per household.
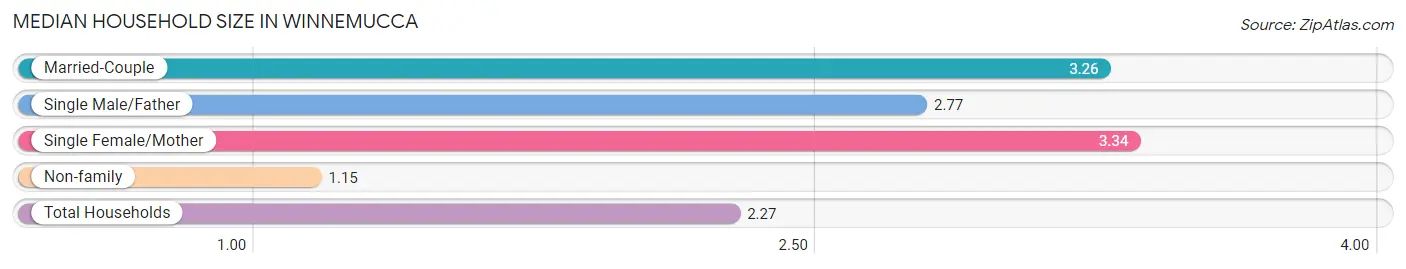
| Household Type | # Households | Household Size |
| Married-Couple | 1,567 (43.0%) | 3.26 |
| Single Male/Father | 133 (3.6%) | 2.77 |
| Single Female/Mother | 264 (7.2%) | 3.34 |
| Non-family | 1,679 (46.1%) | 1.15 |
| Total Households | 3,643 (100.0%) | 2.27 |
Household Size by Marriage Status in Winnemucca
Out of a total of 3,643 households in Winnemucca, 1,964 (53.9%) are family households, while 1,679 (46.1%) are nonfamily households. The most numerous type of family households are 2-person households, comprising 963, and the most common type of nonfamily households are 1-person households, comprising 1,434.
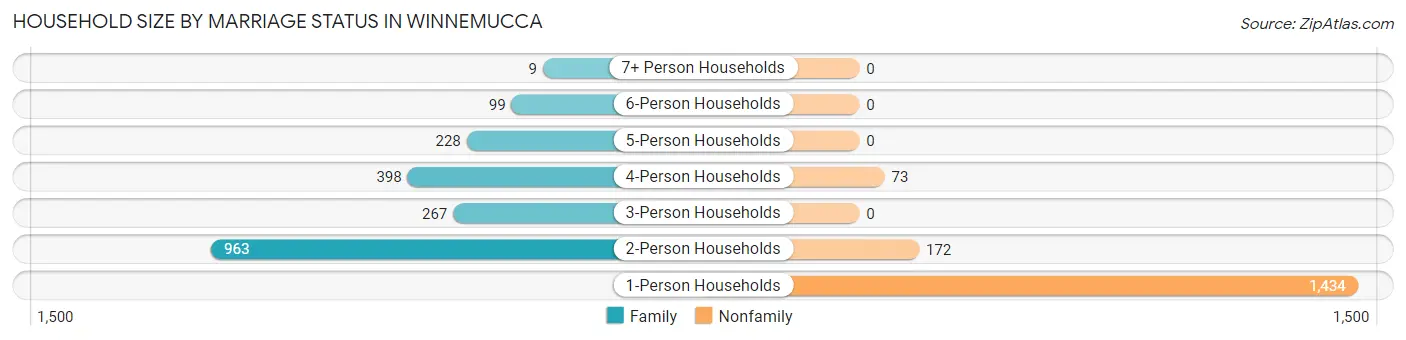
| Household Size | Family Households | Nonfamily Households |
| 1-Person Households | - | 1,434 (39.4%) |
| 2-Person Households | 963 (26.4%) | 172 (4.7%) |
| 3-Person Households | 267 (7.3%) | 0 (0.0%) |
| 4-Person Households | 398 (10.9%) | 73 (2.0%) |
| 5-Person Households | 228 (6.3%) | 0 (0.0%) |
| 6-Person Households | 99 (2.7%) | 0 (0.0%) |
| 7+ Person Households | 9 (0.3%) | 0 (0.0%) |
| Total | 1,964 (53.9%) | 1,679 (46.1%) |
Female Fertility in Winnemucca
Fertility by Age in Winnemucca
Average fertility rate in Winnemucca is 79.0 births per 1,000 women. Women in the age bracket of 20 to 34 years have the highest fertility rate with 154.0 births per 1,000 women. Women in the age bracket of 20 to 34 years acount for 98.6% of all women with births.
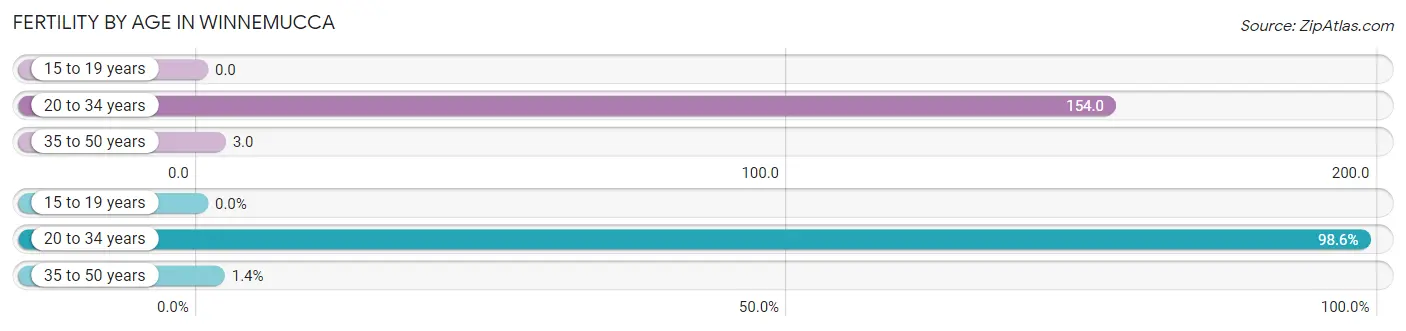
| Age Bracket | Women with Births | Births / 1,000 Women |
| 15 to 19 years | 0 (0.0%) | 0.0 |
| 20 to 34 years | 139 (98.6%) | 154.0 |
| 35 to 50 years | 2 (1.4%) | 3.0 |
| Total | 141 (100.0%) | 79.0 |
Fertility by Age by Marriage Status in Winnemucca
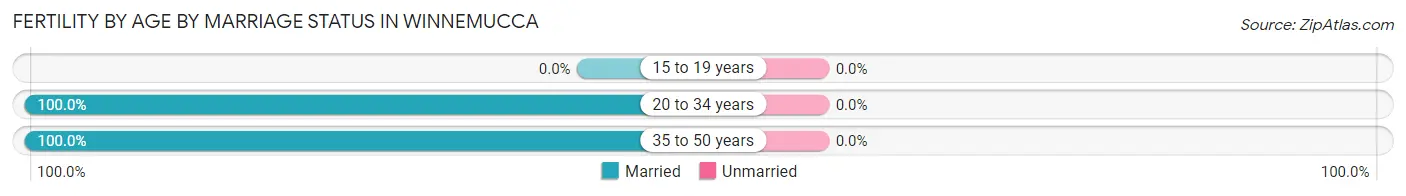
| Age Bracket | Married | Unmarried |
| 15 to 19 years | 0 (0.0%) | 0 (0.0%) |
| 20 to 34 years | 139 (100.0%) | 0 (0.0%) |
| 35 to 50 years | 2 (100.0%) | 0 (0.0%) |
| Total | 141 (100.0%) | 0 (0.0%) |
Fertility by Education in Winnemucca
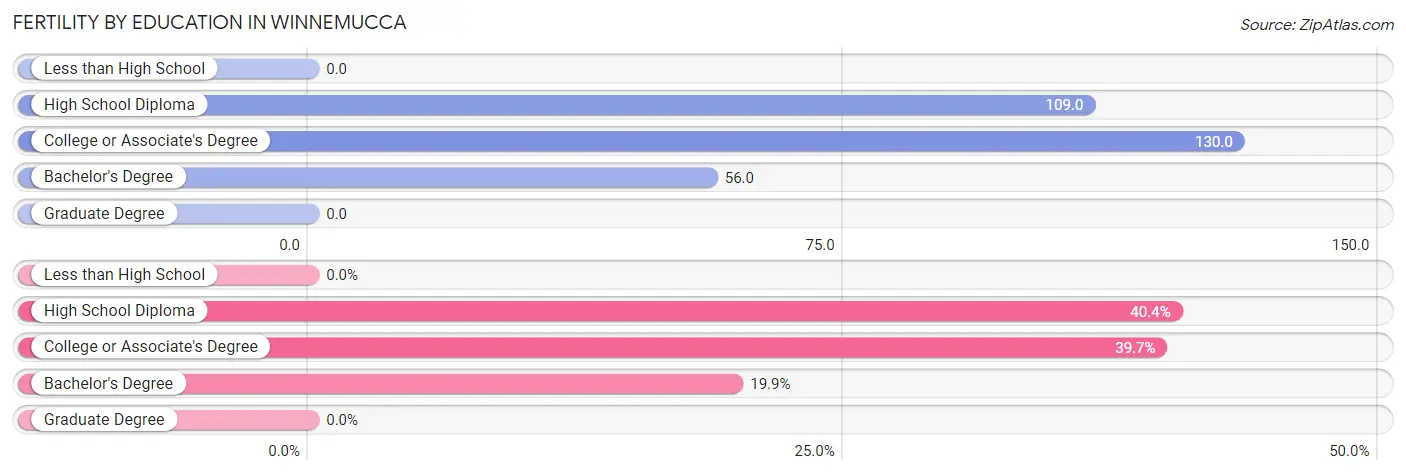
| Educational Attainment | Women with Births | Births / 1,000 Women |
| Less than High School | 0 (0.0%) | 0.0 |
| High School Diploma | 57 (40.4%) | 109.0 |
| College or Associate's Degree | 56 (39.7%) | 130.0 |
| Bachelor's Degree | 28 (19.9%) | 56.0 |
| Graduate Degree | 0 (0.0%) | 0.0 |
| Total | 141 (100.0%) | 79.0 |
Fertility by Education by Marriage Status in Winnemucca
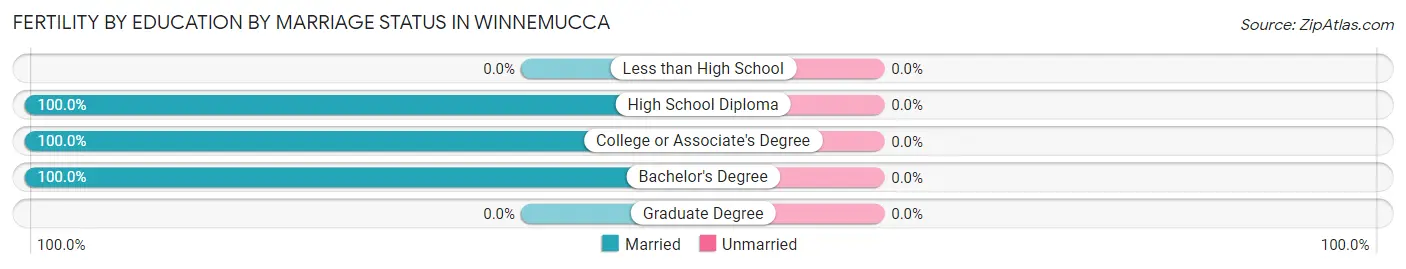
| Educational Attainment | Married | Unmarried |
| Less than High School | 0 (0.0%) | 0 (0.0%) |
| High School Diploma | 57 (100.0%) | 0 (0.0%) |
| College or Associate's Degree | 56 (100.0%) | 0 (0.0%) |
| Bachelor's Degree | 28 (100.0%) | 0 (0.0%) |
| Graduate Degree | 0 (0.0%) | 0 (0.0%) |
| Total | 141 (100.0%) | 0 (0.0%) |
Employment Characteristics in Winnemucca
Employment by Class of Employer in Winnemucca
Among the 4,017 employed individuals in Winnemucca, private company employees (2,357 | 58.7%), local government employees (587 | 14.6%), and state government employees (323 | 8.0%) make up the most common classes of employment.
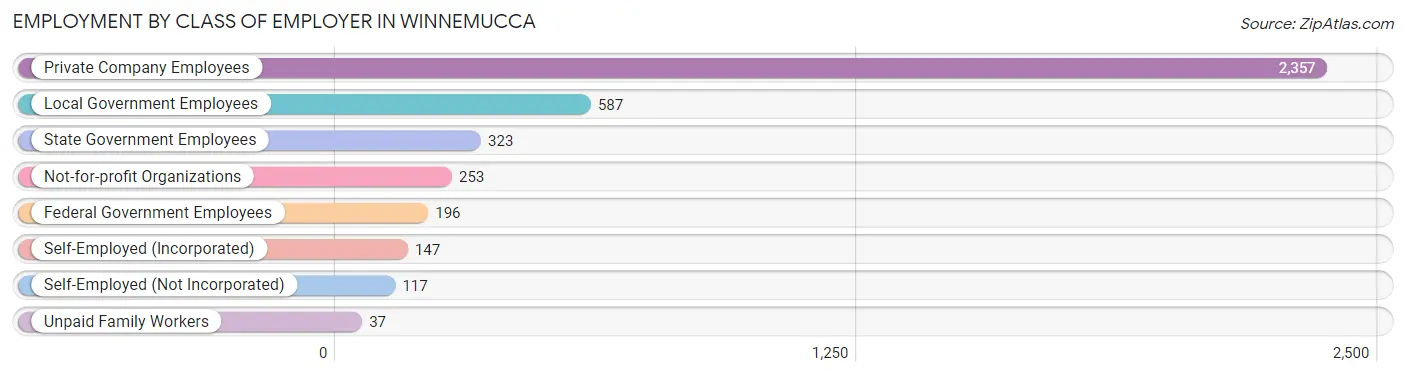
| Employer Class | # Employees | % Employees |
| Private Company Employees | 2,357 | 58.7% |
| Self-Employed (Incorporated) | 147 | 3.7% |
| Self-Employed (Not Incorporated) | 117 | 2.9% |
| Not-for-profit Organizations | 253 | 6.3% |
| Local Government Employees | 587 | 14.6% |
| State Government Employees | 323 | 8.0% |
| Federal Government Employees | 196 | 4.9% |
| Unpaid Family Workers | 37 | 0.9% |
| Total | 4,017 | 100.0% |
Employment Status by Age in Winnemucca
According to the labor force statistics for Winnemucca, out of the total population over 16 years of age (6,351), 67.2% or 4,268 individuals are in the labor force, with 4.4% or 188 of them unemployed. The age group with the highest labor force participation rate is 20 to 24 years, with 94.6% or 511 individuals in the labor force. Within the labor force, the 20 to 24 years age range has the highest percentage of unemployed individuals, with 21.5% or 110 of them being unemployed.
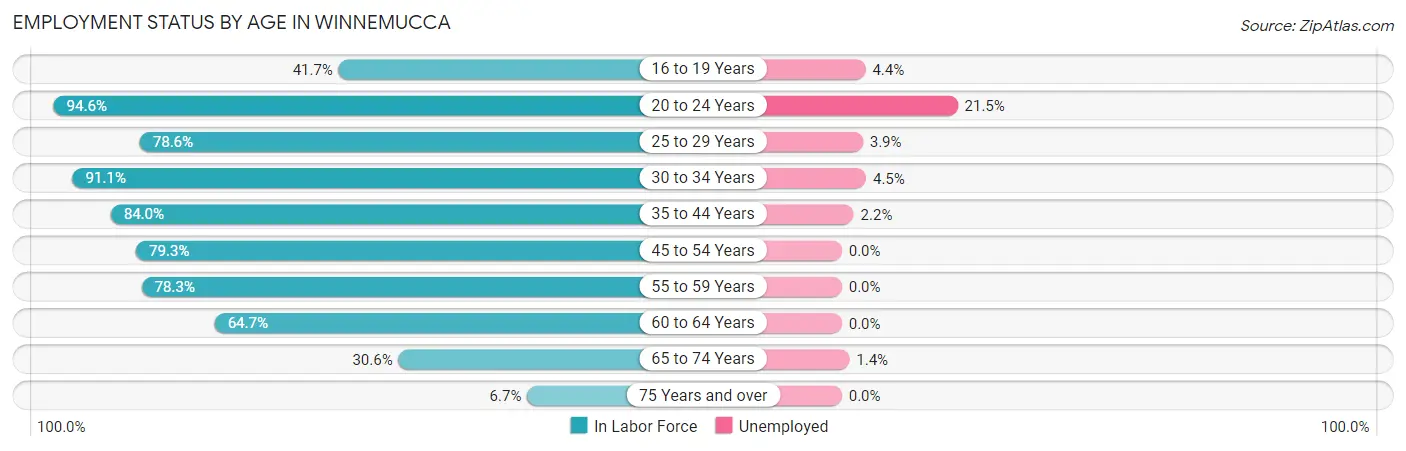
| Age Bracket | In Labor Force | Unemployed |
| 16 to 19 Years | 159 (41.7%) | 7 (4.4%) |
| 20 to 24 Years | 511 (94.6%) | 110 (21.5%) |
| 25 to 29 Years | 514 (78.6%) | 20 (3.9%) |
| 30 to 34 Years | 642 (91.1%) | 29 (4.5%) |
| 35 to 44 Years | 868 (84.0%) | 19 (2.2%) |
| 45 to 54 Years | 674 (79.3%) | 0 (0.0%) |
| 55 to 59 Years | 267 (78.3%) | 0 (0.0%) |
| 60 to 64 Years | 375 (64.7%) | 0 (0.0%) |
| 65 to 74 Years | 220 (30.6%) | 3 (1.4%) |
| 75 Years and over | 37 (6.7%) | 0 (0.0%) |
| Total | 4,268 (67.2%) | 188 (4.4%) |
Employment Status by Educational Attainment in Winnemucca
According to labor force statistics for Winnemucca, 80.2% of individuals (3,339) out of the total population between 25 and 64 years of age (4,163) are in the labor force, with 2.0% or 67 of them being unemployed. The group with the highest labor force participation rate are those with the educational attainment of college / associate degree, with 83.6% or 904 individuals in the labor force. Within the labor force, individuals with less than high school education have the highest percentage of unemployment, with 5.5% or 20 of them being unemployed.
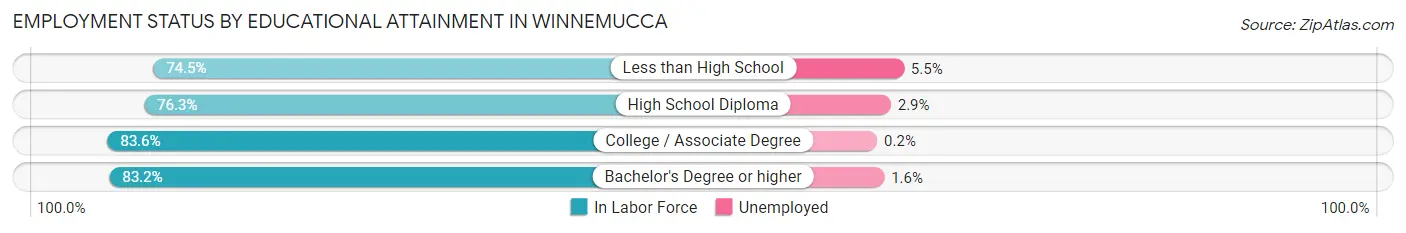
| Educational Attainment | In Labor Force | Unemployed |
| Less than High School | 366 (74.5%) | 27 (5.5%) |
| High School Diploma | 958 (76.3%) | 36 (2.9%) |
| College / Associate Degree | 904 (83.6%) | 2 (0.2%) |
| Bachelor's Degree or higher | 1,112 (83.2%) | 21 (1.6%) |
| Total | 3,339 (80.2%) | 83 (2.0%) |
Employment Occupations by Sex in Winnemucca
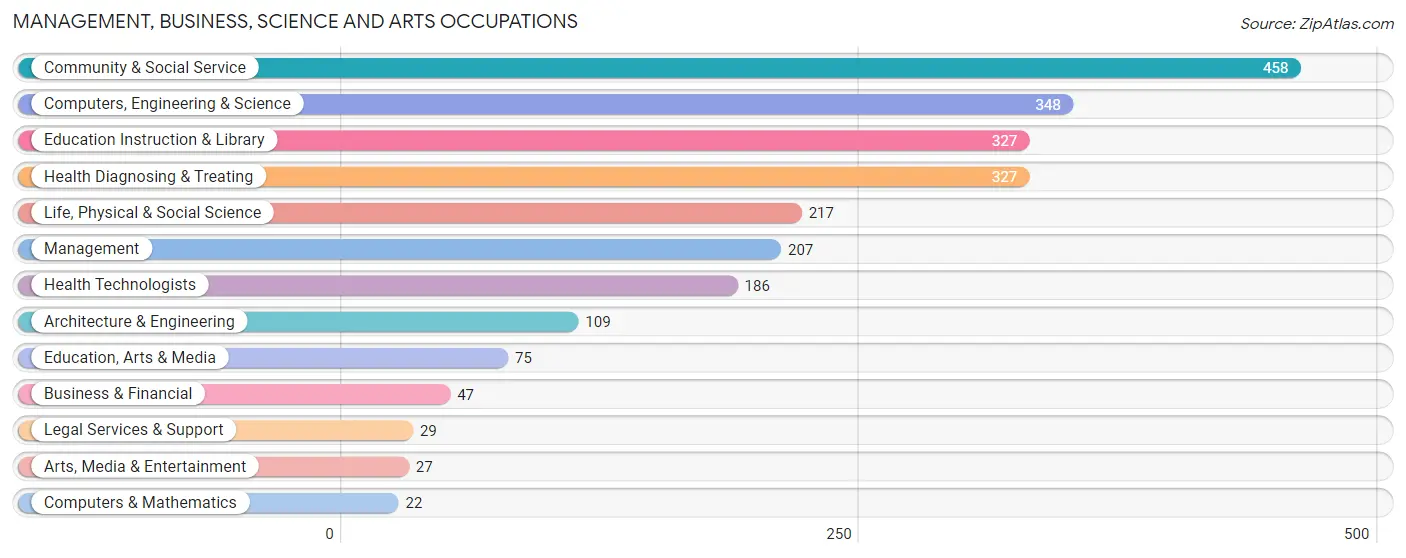
Management, Business, Science and Arts Occupations
The most common Management, Business, Science and Arts occupations in Winnemucca are Community & Social Service (458 | 11.2%), Computers, Engineering & Science (348 | 8.5%), Education Instruction & Library (327 | 8.0%), Health Diagnosing & Treating (327 | 8.0%), and Life, Physical & Social Science (217 | 5.3%).
Management, Business, Science and Arts Occupations by Sex
Within the Management, Business, Science and Arts occupations in Winnemucca, the most male-oriented occupations are Management (78.3%), Education Instruction & Library (75.5%), and Computers & Mathematics (59.1%), while the most female-oriented occupations are Education, Arts & Media (100.0%), Legal Services & Support (100.0%), and Arts, Media & Entertainment (74.1%).
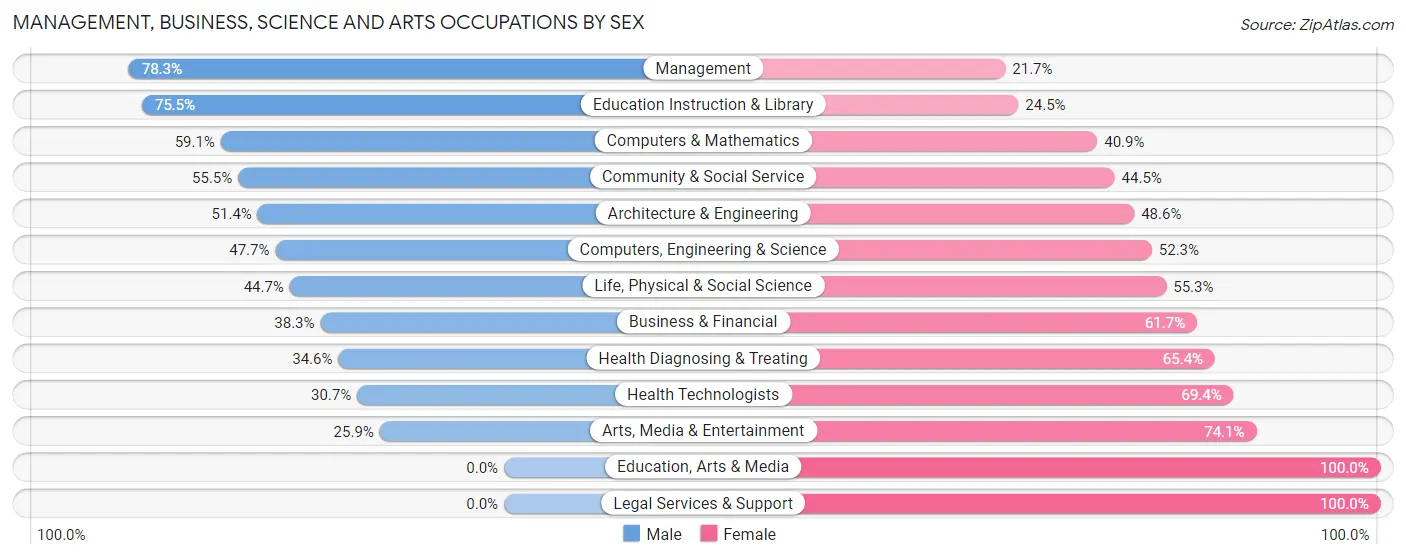
| Occupation | Male | Female |
| Management | 162 (78.3%) | 45 (21.7%) |
| Business & Financial | 18 (38.3%) | 29 (61.7%) |
| Computers, Engineering & Science | 166 (47.7%) | 182 (52.3%) |
| Computers & Mathematics | 13 (59.1%) | 9 (40.9%) |
| Architecture & Engineering | 56 (51.4%) | 53 (48.6%) |
| Life, Physical & Social Science | 97 (44.7%) | 120 (55.3%) |
| Community & Social Service | 254 (55.5%) | 204 (44.5%) |
| Education, Arts & Media | 0 (0.0%) | 75 (100.0%) |
| Legal Services & Support | 0 (0.0%) | 29 (100.0%) |
| Education Instruction & Library | 247 (75.5%) | 80 (24.5%) |
| Arts, Media & Entertainment | 7 (25.9%) | 20 (74.1%) |
| Health Diagnosing & Treating | 113 (34.6%) | 214 (65.4%) |
| Health Technologists | 57 (30.6%) | 129 (69.4%) |
| Total (Category) | 713 (51.4%) | 674 (48.6%) |
| Total (Overall) | 2,537 (62.2%) | 1,542 (37.8%) |
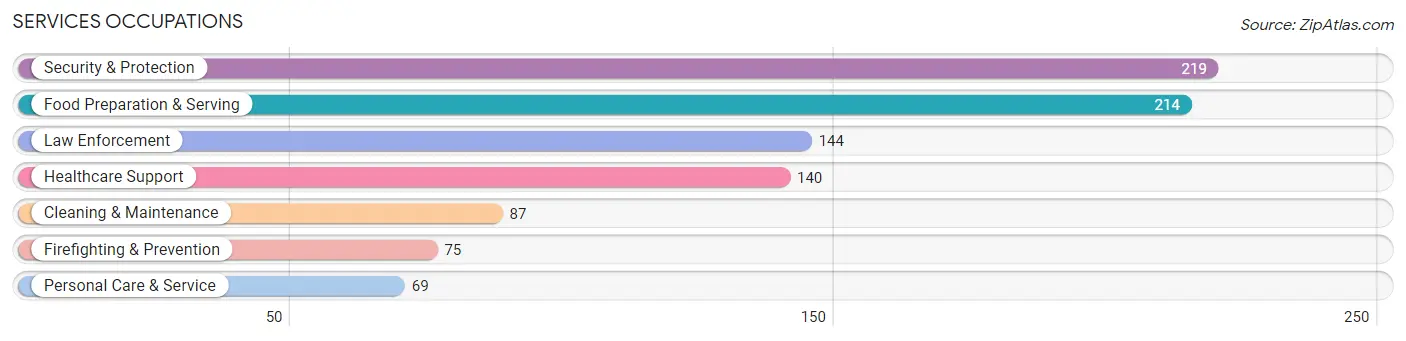
Services Occupations
The most common Services occupations in Winnemucca are Security & Protection (219 | 5.4%), Food Preparation & Serving (214 | 5.2%), Law Enforcement (144 | 3.5%), Healthcare Support (140 | 3.4%), and Cleaning & Maintenance (87 | 2.1%).
Services Occupations by Sex
Within the Services occupations in Winnemucca, the most male-oriented occupations are Law Enforcement (100.0%), Personal Care & Service (95.7%), and Security & Protection (91.3%), while the most female-oriented occupations are Healthcare Support (95.7%), Food Preparation & Serving (66.8%), and Cleaning & Maintenance (28.7%).
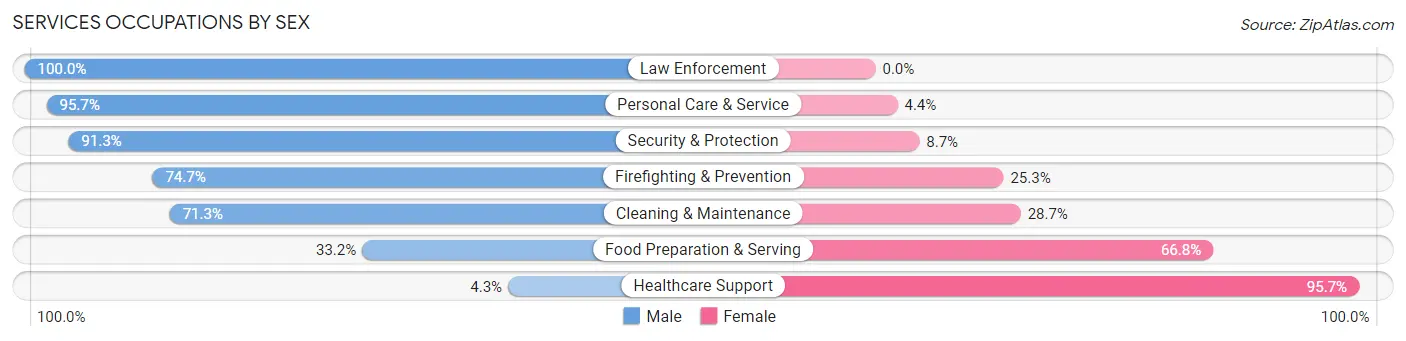
| Occupation | Male | Female |
| Healthcare Support | 6 (4.3%) | 134 (95.7%) |
| Security & Protection | 200 (91.3%) | 19 (8.7%) |
| Firefighting & Prevention | 56 (74.7%) | 19 (25.3%) |
| Law Enforcement | 144 (100.0%) | 0 (0.0%) |
| Food Preparation & Serving | 71 (33.2%) | 143 (66.8%) |
| Cleaning & Maintenance | 62 (71.3%) | 25 (28.7%) |
| Personal Care & Service | 66 (95.7%) | 3 (4.3%) |
| Total (Category) | 405 (55.6%) | 324 (44.4%) |
| Total (Overall) | 2,537 (62.2%) | 1,542 (37.8%) |
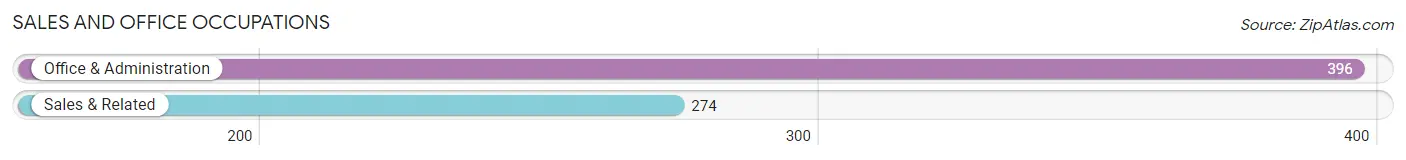
Sales and Office Occupations
The most common Sales and Office occupations in Winnemucca are Office & Administration (396 | 9.7%), and Sales & Related (274 | 6.7%).
Sales and Office Occupations by Sex
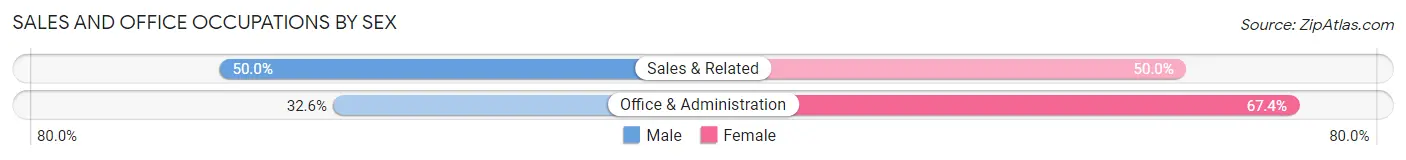
| Occupation | Male | Female |
| Sales & Related | 137 (50.0%) | 137 (50.0%) |
| Office & Administration | 129 (32.6%) | 267 (67.4%) |
| Total (Category) | 266 (39.7%) | 404 (60.3%) |
| Total (Overall) | 2,537 (62.2%) | 1,542 (37.8%) |
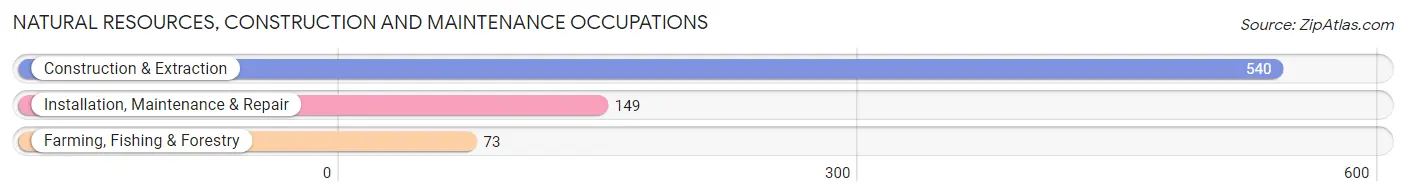
Natural Resources, Construction and Maintenance Occupations
The most common Natural Resources, Construction and Maintenance occupations in Winnemucca are Construction & Extraction (540 | 13.2%), Installation, Maintenance & Repair (149 | 3.6%), and Farming, Fishing & Forestry (73 | 1.8%).
Natural Resources, Construction and Maintenance Occupations by Sex
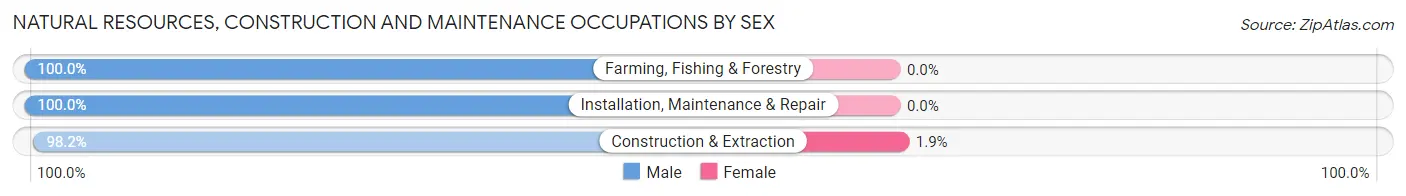
| Occupation | Male | Female |
| Farming, Fishing & Forestry | 73 (100.0%) | 0 (0.0%) |
| Construction & Extraction | 530 (98.2%) | 10 (1.8%) |
| Installation, Maintenance & Repair | 149 (100.0%) | 0 (0.0%) |
| Total (Category) | 752 (98.7%) | 10 (1.3%) |
| Total (Overall) | 2,537 (62.2%) | 1,542 (37.8%) |
Production, Transportation and Moving Occupations
The most common Production, Transportation and Moving occupations in Winnemucca are Material Moving (246 | 6.0%), Transportation (155 | 3.8%), and Production (130 | 3.2%).
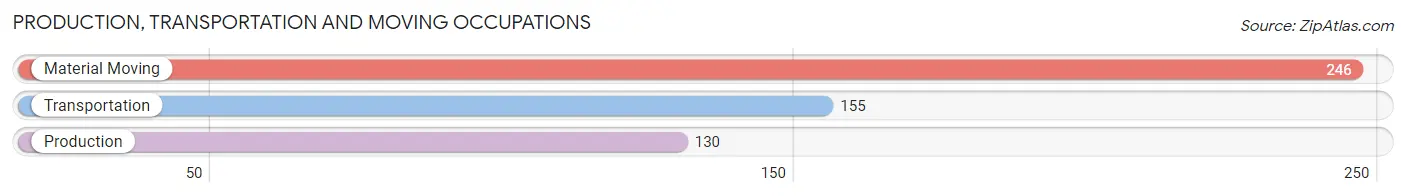
Production, Transportation and Moving Occupations by Sex
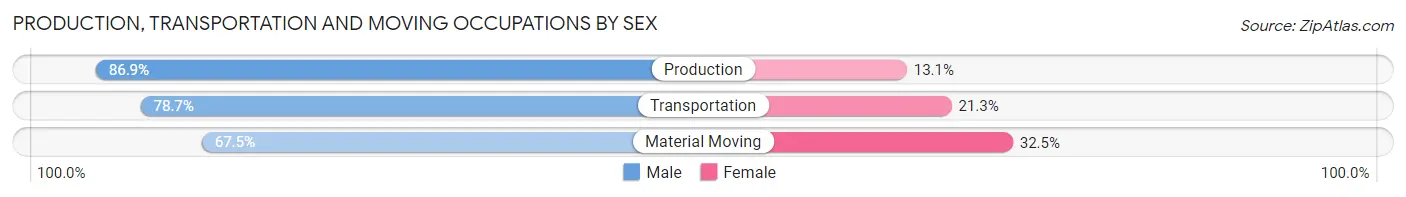
| Occupation | Male | Female |
| Production | 113 (86.9%) | 17 (13.1%) |
| Transportation | 122 (78.7%) | 33 (21.3%) |
| Material Moving | 166 (67.5%) | 80 (32.5%) |
| Total (Category) | 401 (75.5%) | 130 (24.5%) |
| Total (Overall) | 2,537 (62.2%) | 1,542 (37.8%) |
Employment Industries by Sex in Winnemucca
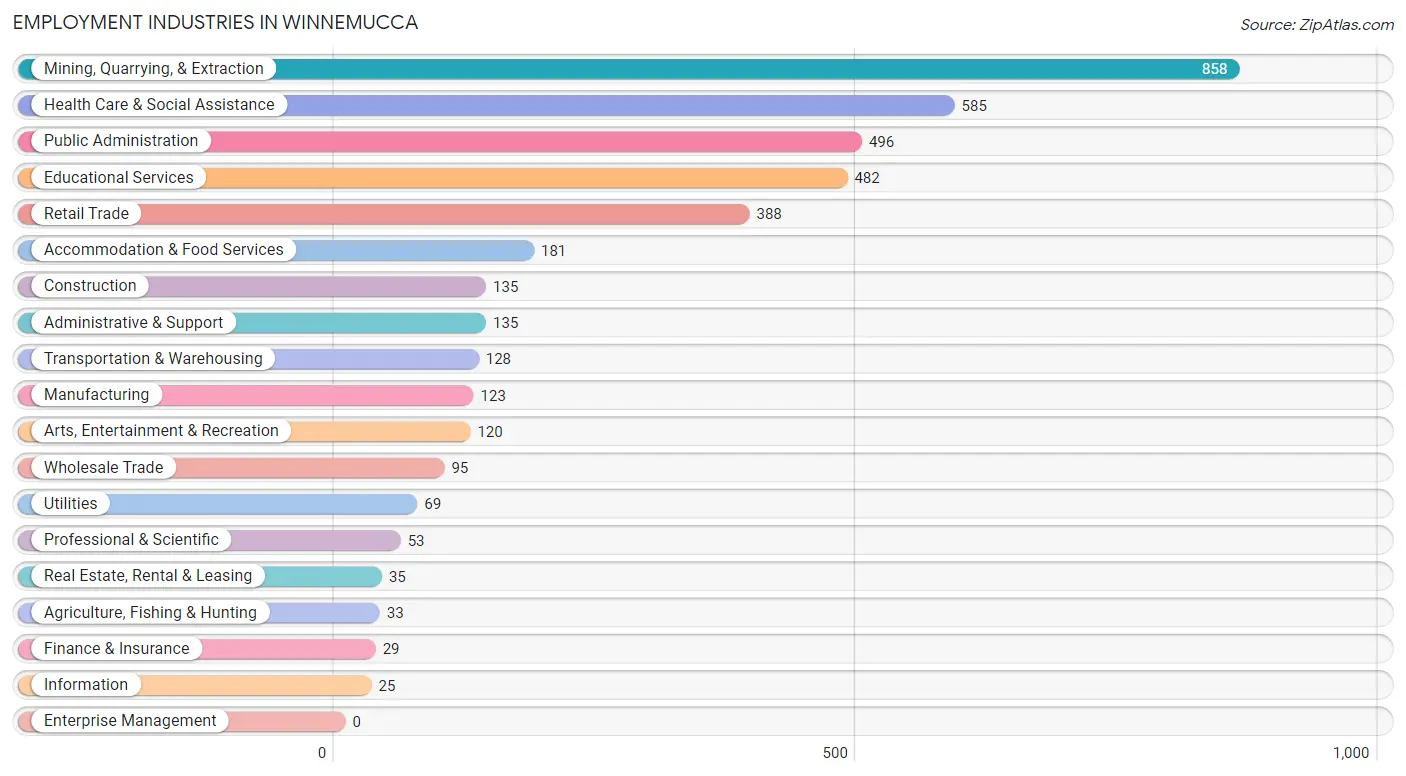
Employment Industries in Winnemucca
The major employment industries in Winnemucca include Mining, Quarrying, & Extraction (858 | 21.0%), Health Care & Social Assistance (585 | 14.3%), Public Administration (496 | 12.2%), Educational Services (482 | 11.8%), and Retail Trade (388 | 9.5%).
Employment Industries by Sex in Winnemucca
The Winnemucca industries that see more men than women are Agriculture, Fishing & Hunting (100.0%), Utilities (100.0%), and Construction (90.4%), whereas the industries that tend to have a higher number of women are Real Estate, Rental & Leasing (94.3%), Professional & Scientific (88.7%), and Information (76.0%).
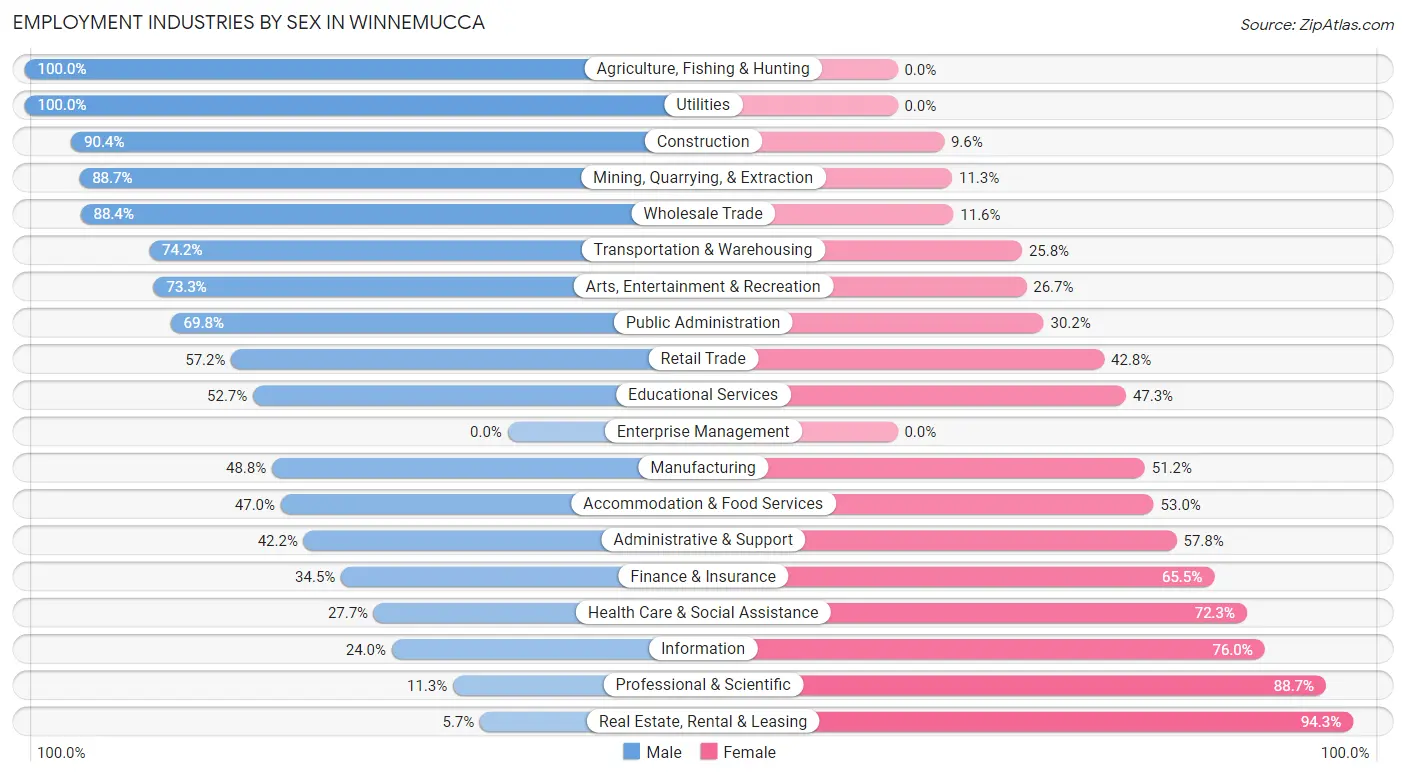
| Industry | Male | Female |
| Agriculture, Fishing & Hunting | 33 (100.0%) | 0 (0.0%) |
| Mining, Quarrying, & Extraction | 761 (88.7%) | 97 (11.3%) |
| Construction | 122 (90.4%) | 13 (9.6%) |
| Manufacturing | 60 (48.8%) | 63 (51.2%) |
| Wholesale Trade | 84 (88.4%) | 11 (11.6%) |
| Retail Trade | 222 (57.2%) | 166 (42.8%) |
| Transportation & Warehousing | 95 (74.2%) | 33 (25.8%) |
| Utilities | 69 (100.0%) | 0 (0.0%) |
| Information | 6 (24.0%) | 19 (76.0%) |
| Finance & Insurance | 10 (34.5%) | 19 (65.5%) |
| Real Estate, Rental & Leasing | 2 (5.7%) | 33 (94.3%) |
| Professional & Scientific | 6 (11.3%) | 47 (88.7%) |
| Enterprise Management | 0 (0.0%) | 0 (0.0%) |
| Administrative & Support | 57 (42.2%) | 78 (57.8%) |
| Educational Services | 254 (52.7%) | 228 (47.3%) |
| Health Care & Social Assistance | 162 (27.7%) | 423 (72.3%) |
| Arts, Entertainment & Recreation | 88 (73.3%) | 32 (26.7%) |
| Accommodation & Food Services | 85 (47.0%) | 96 (53.0%) |
| Public Administration | 346 (69.8%) | 150 (30.2%) |
| Total | 2,537 (62.2%) | 1,542 (37.8%) |
Education in Winnemucca
School Enrollment in Winnemucca
The most common levels of schooling among the 2,219 students in Winnemucca are elementary school (591 | 26.6%), middle school (544 | 24.5%), and college / undergraduate (468 | 21.1%).
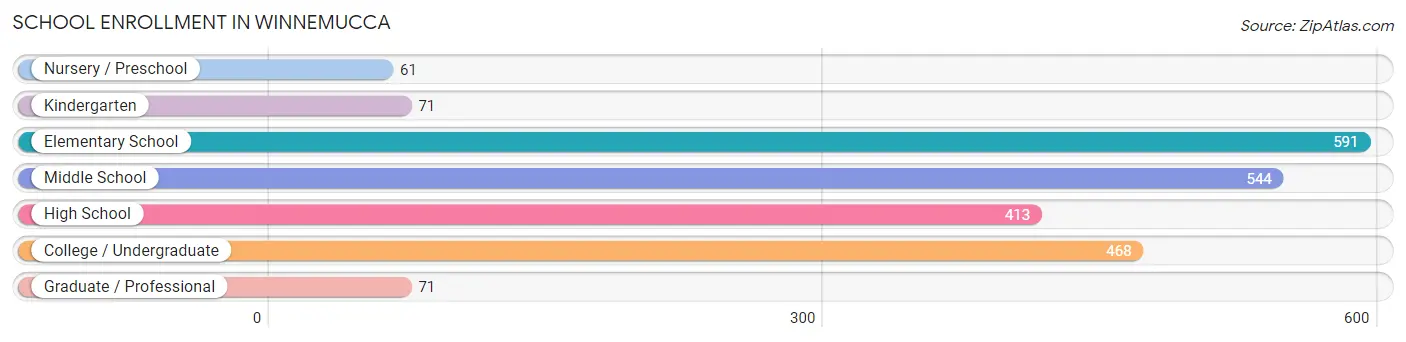
| School Level | # Students | % Students |
| Nursery / Preschool | 61 | 2.8% |
| Kindergarten | 71 | 3.2% |
| Elementary School | 591 | 26.6% |
| Middle School | 544 | 24.5% |
| High School | 413 | 18.6% |
| College / Undergraduate | 468 | 21.1% |
| Graduate / Professional | 71 | 3.2% |
| Total | 2,219 | 100.0% |
School Enrollment by Age by Funding Source in Winnemucca
Out of a total of 2,219 students who are enrolled in schools in Winnemucca, 149 (6.7%) attend a private institution, while the remaining 2,070 (93.3%) are enrolled in public schools. The age group of 3 to 4 year olds has the highest likelihood of being enrolled in private schools, with 25 (64.1% in the age bracket) enrolled. Conversely, the age group of 15 to 17 year olds has the lowest likelihood of being enrolled in a private school, with 332 (100.0% in the age bracket) attending a public institution.
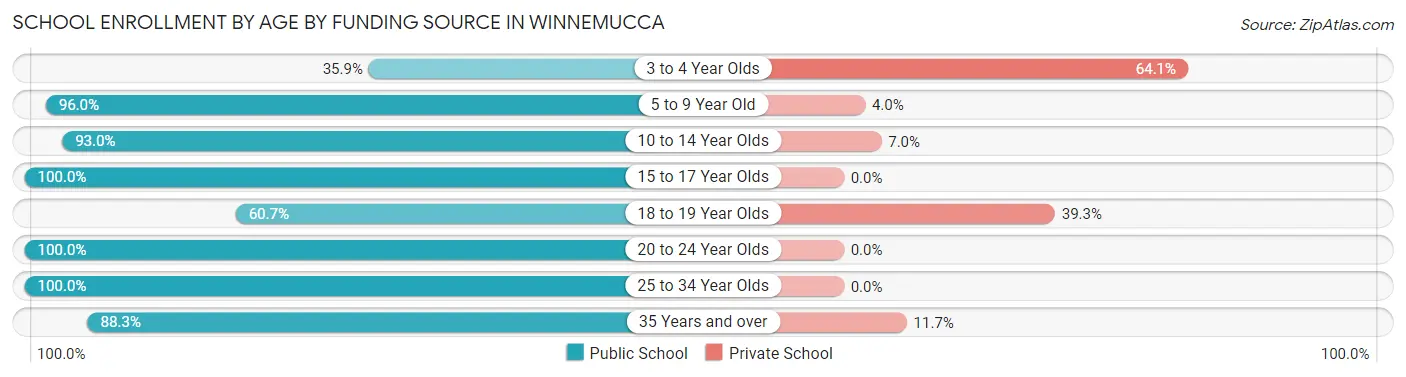
| Age Bracket | Public School | Private School |
| 3 to 4 Year Olds | 14 (35.9%) | 25 (64.1%) |
| 5 to 9 Year Old | 630 (96.0%) | 26 (4.0%) |
| 10 to 14 Year Olds | 570 (93.0%) | 43 (7.0%) |
| 15 to 17 Year Olds | 332 (100.0%) | 0 (0.0%) |
| 18 to 19 Year Olds | 54 (60.7%) | 35 (39.3%) |
| 20 to 24 Year Olds | 215 (100.0%) | 0 (0.0%) |
| 25 to 34 Year Olds | 113 (100.0%) | 0 (0.0%) |
| 35 Years and over | 143 (88.3%) | 19 (11.7%) |
| Total | 2,070 (93.3%) | 149 (6.7%) |
Educational Attainment by Field of Study in Winnemucca
Education (324 | 17.9%), arts & humanities (297 | 16.5%), science & technology (263 | 14.6%), bio, nature & agricultural (250 | 13.9%), and business (247 | 13.7%) are the most common fields of study among 1,805 individuals in Winnemucca who have obtained a bachelor's degree or higher.
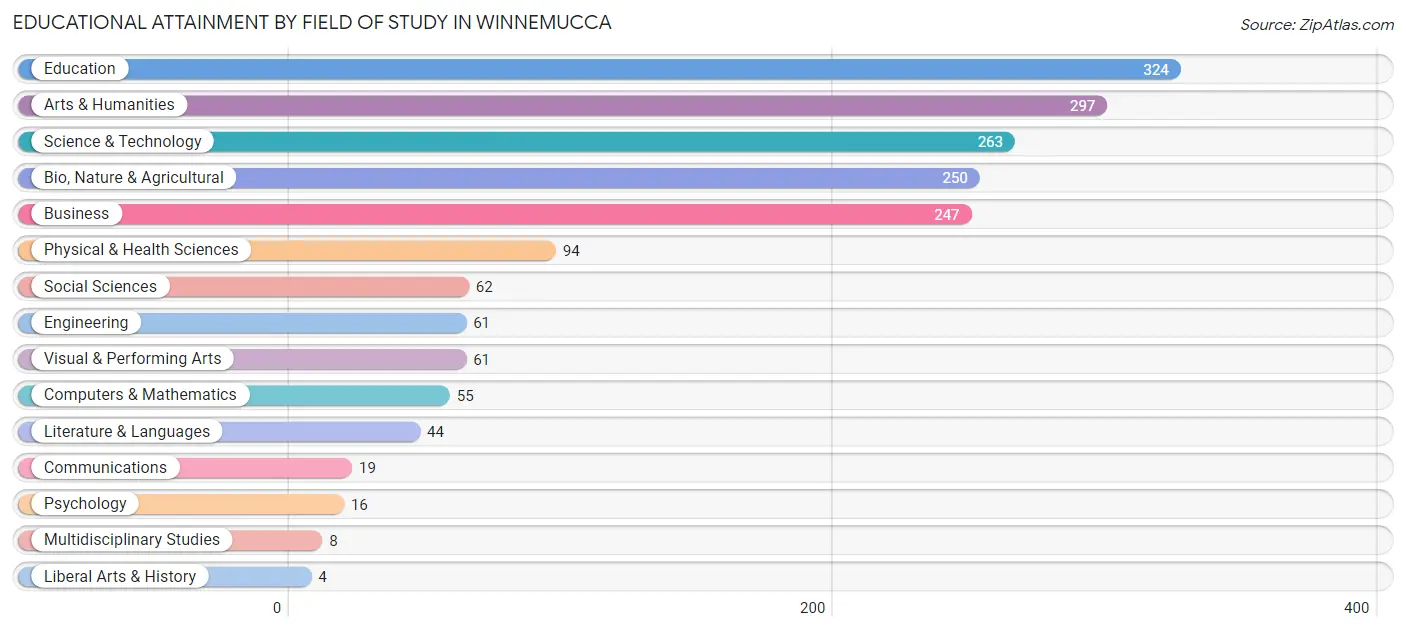
| Field of Study | # Graduates | % Graduates |
| Computers & Mathematics | 55 | 3.0% |
| Bio, Nature & Agricultural | 250 | 13.9% |
| Physical & Health Sciences | 94 | 5.2% |
| Psychology | 16 | 0.9% |
| Social Sciences | 62 | 3.4% |
| Engineering | 61 | 3.4% |
| Multidisciplinary Studies | 8 | 0.4% |
| Science & Technology | 263 | 14.6% |
| Business | 247 | 13.7% |
| Education | 324 | 17.9% |
| Literature & Languages | 44 | 2.4% |
| Liberal Arts & History | 4 | 0.2% |
| Visual & Performing Arts | 61 | 3.4% |
| Communications | 19 | 1.1% |
| Arts & Humanities | 297 | 16.5% |
| Total | 1,805 | 100.0% |
Transportation & Commute in Winnemucca
Vehicle Availability by Sex in Winnemucca
The most prevalent vehicle ownership categories in Winnemucca are males with 3 vehicles (869, accounting for 34.3%) and females with 3 vehicles (440, making up 58.7%).
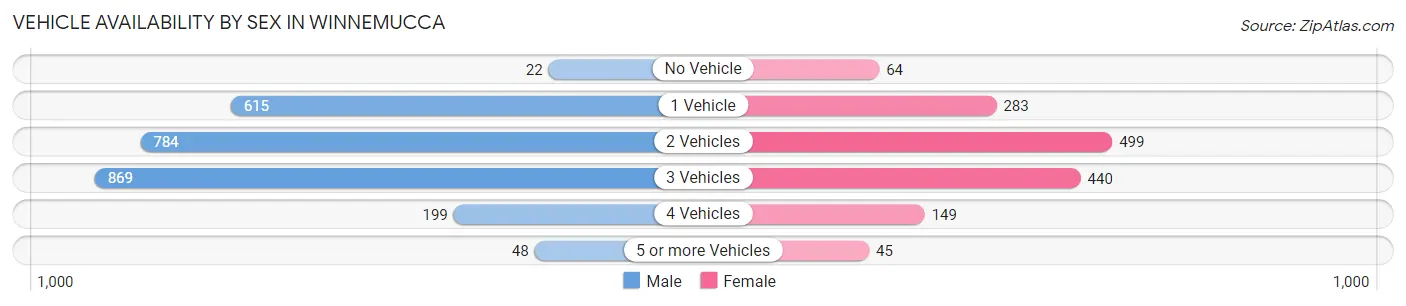
| Vehicles Available | Male | Female |
| No Vehicle | 22 (0.9%) | 64 (4.3%) |
| 1 Vehicle | 615 (24.2%) | 283 (19.1%) |
| 2 Vehicles | 784 (30.9%) | 499 (33.7%) |
| 3 Vehicles | 869 (34.3%) | 440 (29.7%) |
| 4 Vehicles | 199 (7.8%) | 149 (10.1%) |
| 5 or more Vehicles | 48 (1.9%) | 45 (3.0%) |
| Total | 2,537 (100.0%) | 1,480 (100.0%) |
Commute Time in Winnemucca
The most frequently occuring commute durations in Winnemucca are 10 to 14 minutes (1,100 commuters, 28.7%), 5 to 9 minutes (1,008 commuters, 26.3%), and 45 to 59 minutes (394 commuters, 10.3%).
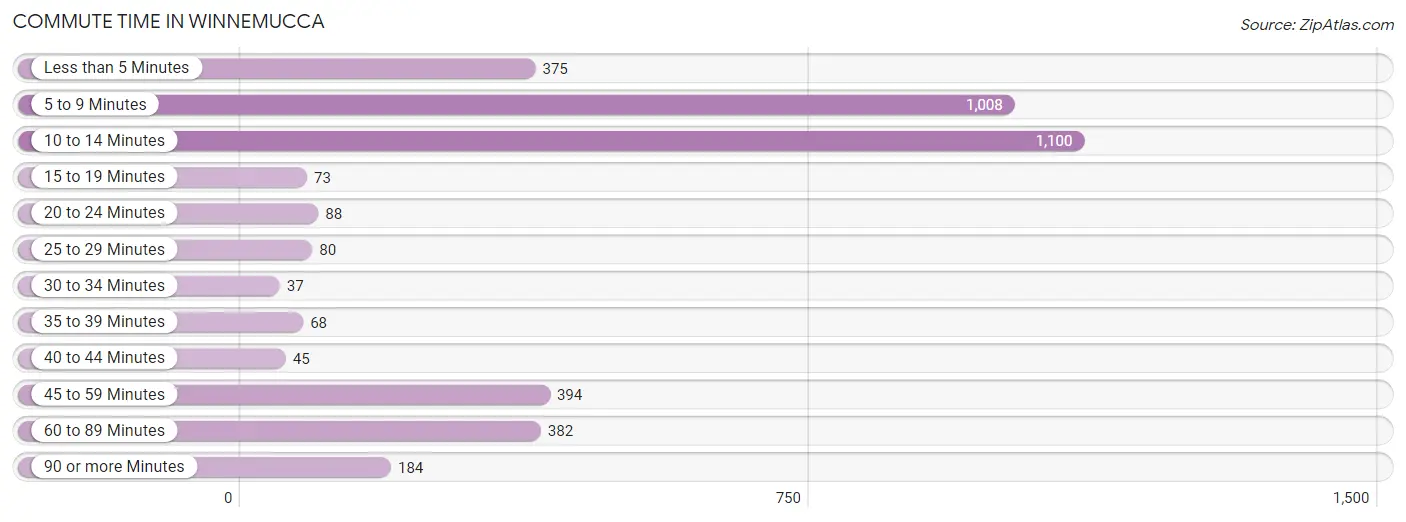
| Commute Time | # Commuters | % Commuters |
| Less than 5 Minutes | 375 | 9.8% |
| 5 to 9 Minutes | 1,008 | 26.3% |
| 10 to 14 Minutes | 1,100 | 28.7% |
| 15 to 19 Minutes | 73 | 1.9% |
| 20 to 24 Minutes | 88 | 2.3% |
| 25 to 29 Minutes | 80 | 2.1% |
| 30 to 34 Minutes | 37 | 1.0% |
| 35 to 39 Minutes | 68 | 1.8% |
| 40 to 44 Minutes | 45 | 1.2% |
| 45 to 59 Minutes | 394 | 10.3% |
| 60 to 89 Minutes | 382 | 10.0% |
| 90 or more Minutes | 184 | 4.8% |
Commute Time by Sex in Winnemucca
The most common commute times in Winnemucca are 10 to 14 minutes (667 commuters, 26.7%) for males and 5 to 9 minutes (523 commuters, 39.2%) for females.
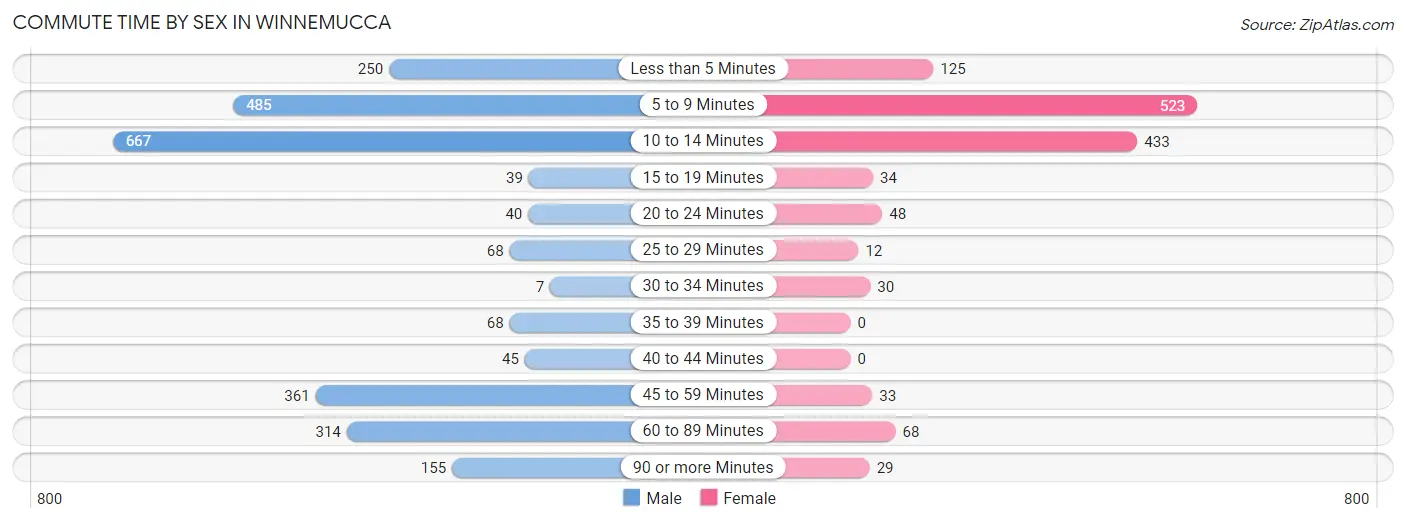
| Commute Time | Male | Female |
| Less than 5 Minutes | 250 (10.0%) | 125 (9.4%) |
| 5 to 9 Minutes | 485 (19.4%) | 523 (39.2%) |
| 10 to 14 Minutes | 667 (26.7%) | 433 (32.4%) |
| 15 to 19 Minutes | 39 (1.6%) | 34 (2.5%) |
| 20 to 24 Minutes | 40 (1.6%) | 48 (3.6%) |
| 25 to 29 Minutes | 68 (2.7%) | 12 (0.9%) |
| 30 to 34 Minutes | 7 (0.3%) | 30 (2.2%) |
| 35 to 39 Minutes | 68 (2.7%) | 0 (0.0%) |
| 40 to 44 Minutes | 45 (1.8%) | 0 (0.0%) |
| 45 to 59 Minutes | 361 (14.4%) | 33 (2.5%) |
| 60 to 89 Minutes | 314 (12.6%) | 68 (5.1%) |
| 90 or more Minutes | 155 (6.2%) | 29 (2.2%) |
Time of Departure to Work by Sex in Winnemucca
The most frequent times of departure to work in Winnemucca are 12:00 AM to 4:59 AM (660, 26.4%) for males and 7:00 AM to 7:29 AM (230, 17.2%) for females.
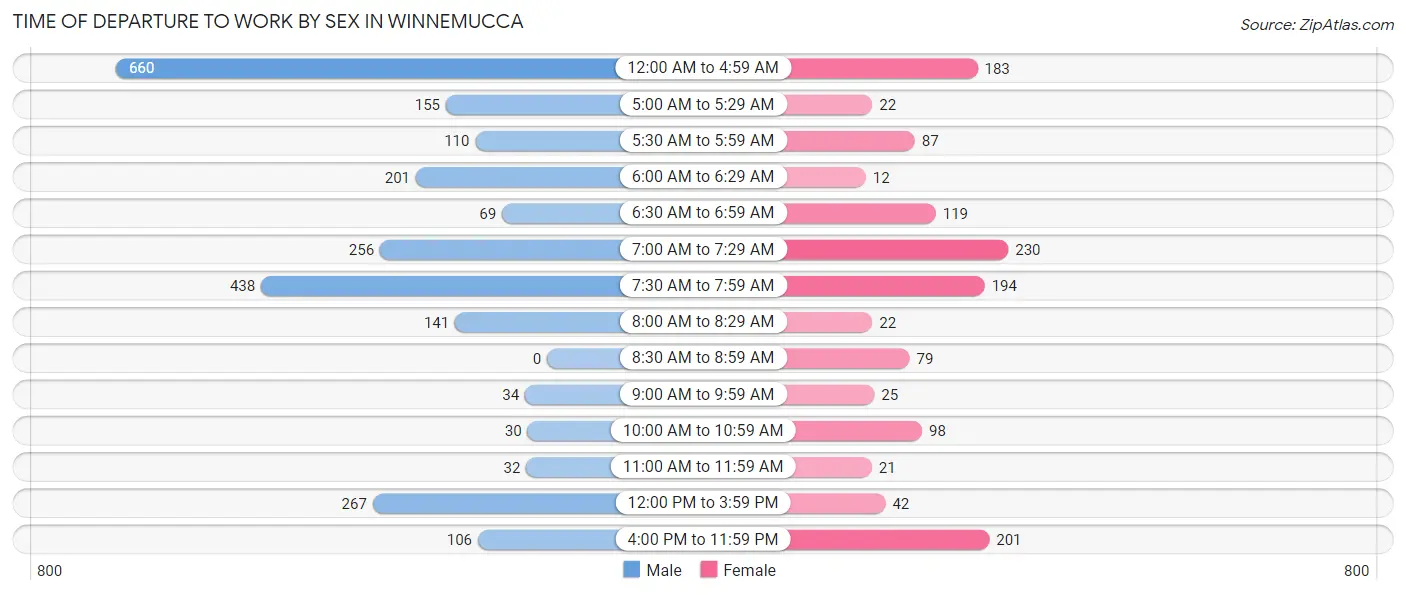
| Time of Departure | Male | Female |
| 12:00 AM to 4:59 AM | 660 (26.4%) | 183 (13.7%) |
| 5:00 AM to 5:29 AM | 155 (6.2%) | 22 (1.7%) |
| 5:30 AM to 5:59 AM | 110 (4.4%) | 87 (6.5%) |
| 6:00 AM to 6:29 AM | 201 (8.0%) | 12 (0.9%) |
| 6:30 AM to 6:59 AM | 69 (2.8%) | 119 (8.9%) |
| 7:00 AM to 7:29 AM | 256 (10.2%) | 230 (17.2%) |
| 7:30 AM to 7:59 AM | 438 (17.5%) | 194 (14.5%) |
| 8:00 AM to 8:29 AM | 141 (5.6%) | 22 (1.7%) |
| 8:30 AM to 8:59 AM | 0 (0.0%) | 79 (5.9%) |
| 9:00 AM to 9:59 AM | 34 (1.4%) | 25 (1.9%) |
| 10:00 AM to 10:59 AM | 30 (1.2%) | 98 (7.3%) |
| 11:00 AM to 11:59 AM | 32 (1.3%) | 21 (1.6%) |
| 12:00 PM to 3:59 PM | 267 (10.7%) | 42 (3.2%) |
| 4:00 PM to 11:59 PM | 106 (4.2%) | 201 (15.1%) |
| Total | 2,499 (100.0%) | 1,335 (100.0%) |
Housing Occupancy in Winnemucca
Occupancy by Ownership in Winnemucca
Of the total 3,643 dwellings in Winnemucca, owner-occupied units account for 2,048 (56.2%), while renter-occupied units make up 1,595 (43.8%).
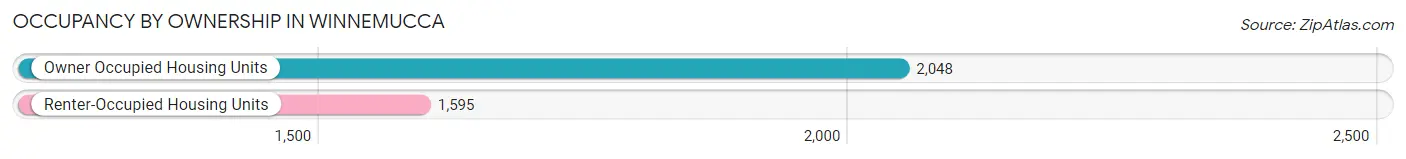
| Occupancy | # Housing Units | % Housing Units |
| Owner Occupied Housing Units | 2,048 | 56.2% |
| Renter-Occupied Housing Units | 1,595 | 43.8% |
| Total Occupied Housing Units | 3,643 | 100.0% |
Occupancy by Household Size in Winnemucca
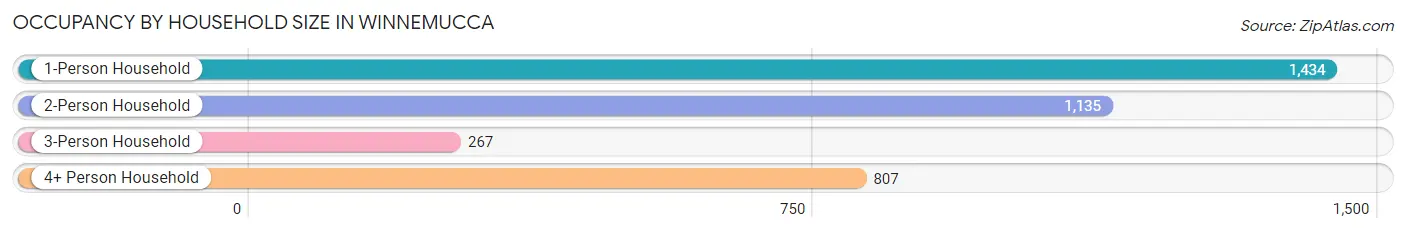
| Household Size | # Housing Units | % Housing Units |
| 1-Person Household | 1,434 | 39.4% |
| 2-Person Household | 1,135 | 31.2% |
| 3-Person Household | 267 | 7.3% |
| 4+ Person Household | 807 | 22.2% |
| Total Housing Units | 3,643 | 100.0% |
Occupancy by Ownership by Household Size in Winnemucca
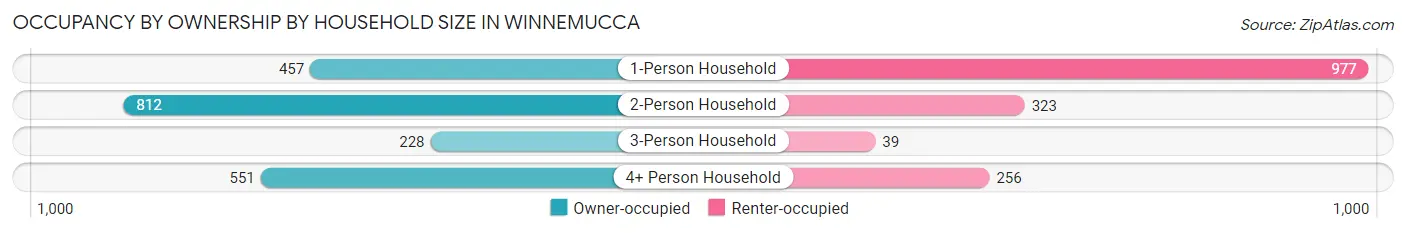
| Household Size | Owner-occupied | Renter-occupied |
| 1-Person Household | 457 (31.9%) | 977 (68.1%) |
| 2-Person Household | 812 (71.5%) | 323 (28.5%) |
| 3-Person Household | 228 (85.4%) | 39 (14.6%) |
| 4+ Person Household | 551 (68.3%) | 256 (31.7%) |
| Total Housing Units | 2,048 (56.2%) | 1,595 (43.8%) |
Occupancy by Educational Attainment in Winnemucca
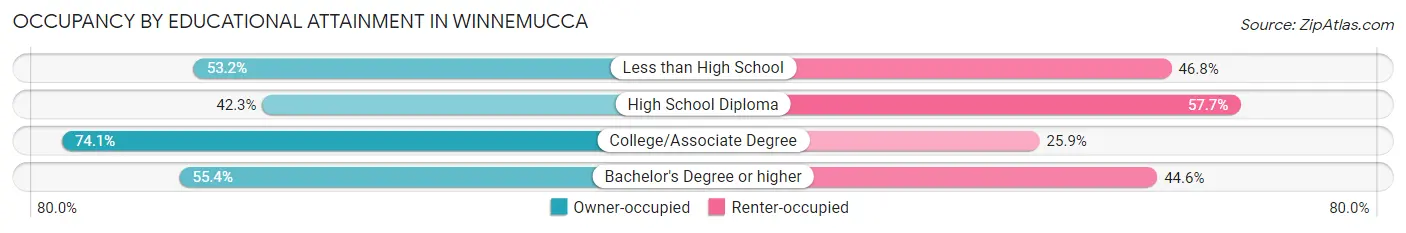
| Household Size | Owner-occupied | Renter-occupied |
| Less than High School | 286 (53.2%) | 252 (46.8%) |
| High School Diploma | 384 (42.3%) | 524 (57.7%) |
| College/Associate Degree | 637 (74.1%) | 223 (25.9%) |
| Bachelor's Degree or higher | 741 (55.4%) | 596 (44.6%) |
Occupancy by Age of Householder in Winnemucca
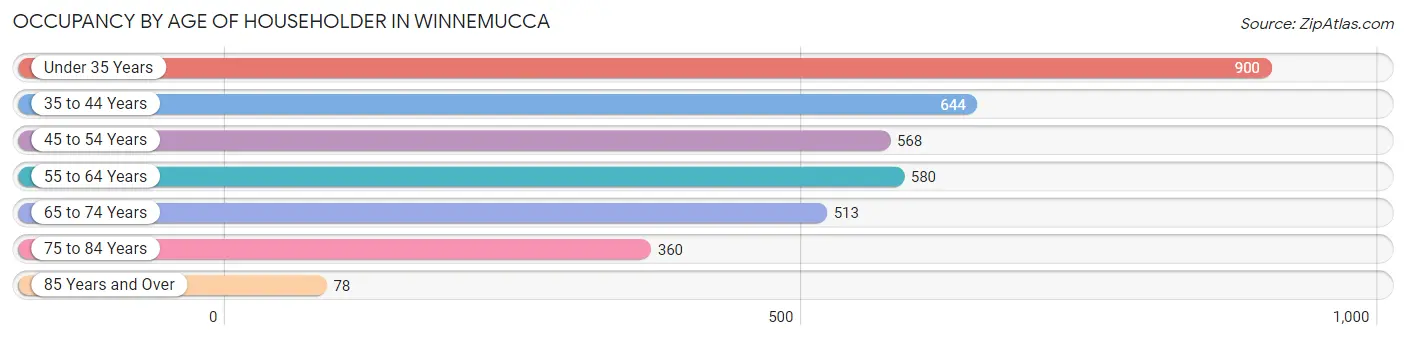
| Age Bracket | # Households | % Households |
| Under 35 Years | 900 | 24.7% |
| 35 to 44 Years | 644 | 17.7% |
| 45 to 54 Years | 568 | 15.6% |
| 55 to 64 Years | 580 | 15.9% |
| 65 to 74 Years | 513 | 14.1% |
| 75 to 84 Years | 360 | 9.9% |
| 85 Years and Over | 78 | 2.1% |
| Total | 3,643 | 100.0% |
Housing Finances in Winnemucca
Median Income by Occupancy in Winnemucca
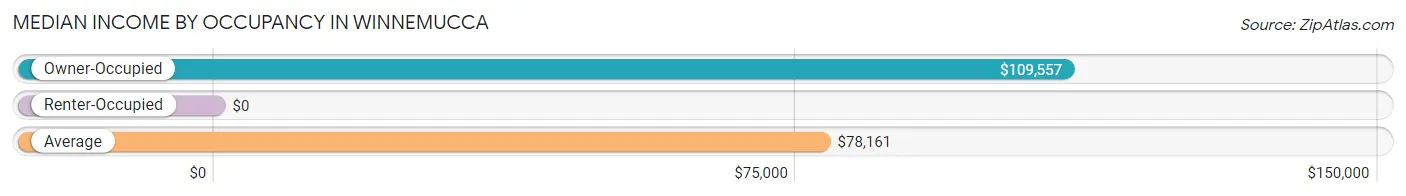
| Occupancy Type | # Households | Median Income |
| Owner-Occupied | 2,048 (56.2%) | $109,557 |
| Renter-Occupied | 1,595 (43.8%) | $0 |
| Average | 3,643 (100.0%) | $78,161 |
Occupancy by Householder Income Bracket in Winnemucca
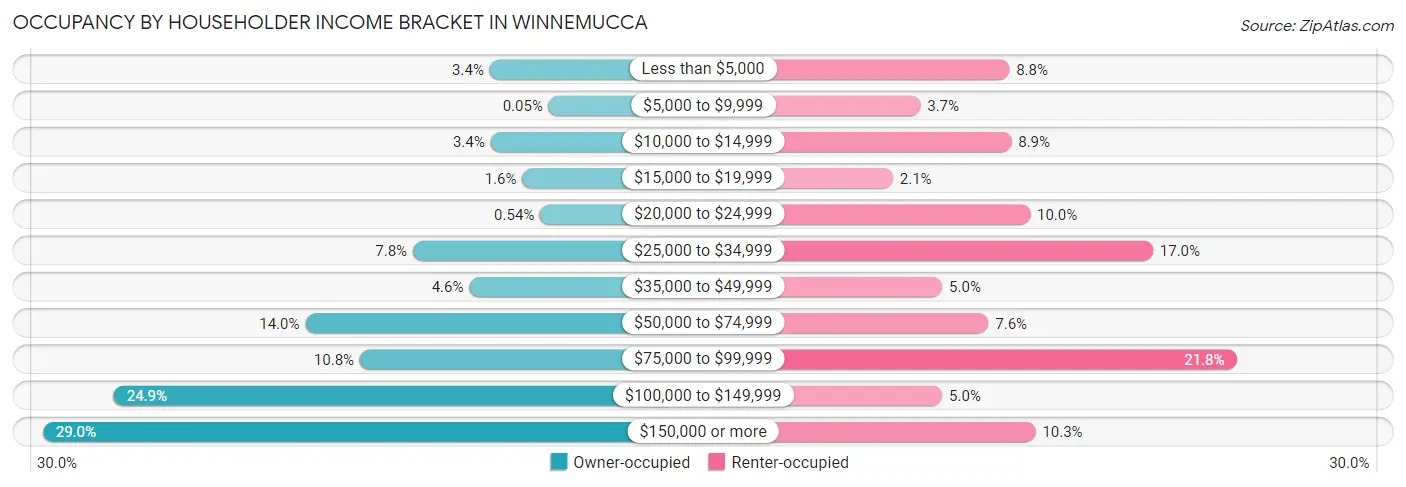
| Income Bracket | Owner-occupied | Renter-occupied |
| Less than $5,000 | 70 (3.4%) | 140 (8.8%) |
| $5,000 to $9,999 | 1 (0.1%) | 59 (3.7%) |
| $10,000 to $14,999 | 69 (3.4%) | 142 (8.9%) |
| $15,000 to $19,999 | 32 (1.6%) | 34 (2.1%) |
| $20,000 to $24,999 | 11 (0.5%) | 159 (10.0%) |
| $25,000 to $34,999 | 160 (7.8%) | 271 (17.0%) |
| $35,000 to $49,999 | 94 (4.6%) | 79 (5.0%) |
| $50,000 to $74,999 | 286 (14.0%) | 121 (7.6%) |
| $75,000 to $99,999 | 222 (10.8%) | 347 (21.8%) |
| $100,000 to $149,999 | 510 (24.9%) | 79 (5.0%) |
| $150,000 or more | 593 (29.0%) | 164 (10.3%) |
| Total | 2,048 (100.0%) | 1,595 (100.0%) |
Monthly Housing Cost Tiers in Winnemucca
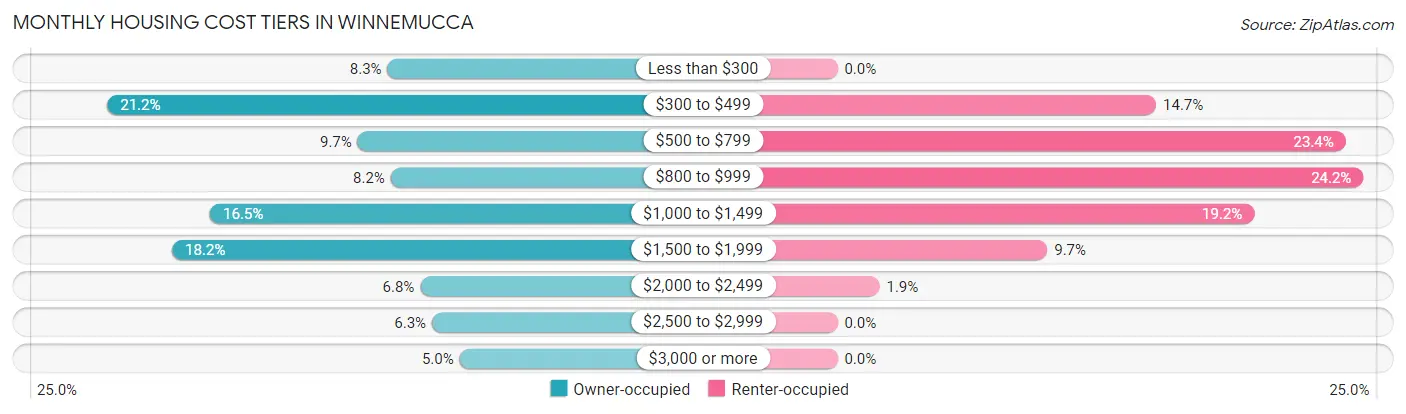
| Monthly Cost | Owner-occupied | Renter-occupied |
| Less than $300 | 170 (8.3%) | 0 (0.0%) |
| $300 to $499 | 434 (21.2%) | 234 (14.7%) |
| $500 to $799 | 198 (9.7%) | 373 (23.4%) |
| $800 to $999 | 167 (8.2%) | 386 (24.2%) |
| $1,000 to $1,499 | 337 (16.5%) | 306 (19.2%) |
| $1,500 to $1,999 | 373 (18.2%) | 154 (9.7%) |
| $2,000 to $2,499 | 139 (6.8%) | 31 (1.9%) |
| $2,500 to $2,999 | 128 (6.2%) | 0 (0.0%) |
| $3,000 or more | 102 (5.0%) | 0 (0.0%) |
| Total | 2,048 (100.0%) | 1,595 (100.0%) |
Physical Housing Characteristics in Winnemucca
Housing Structures in Winnemucca
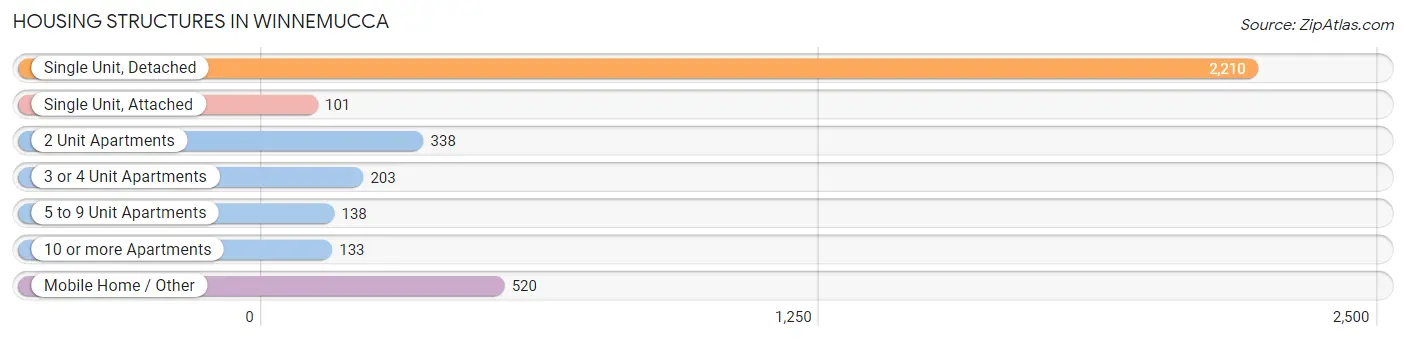
| Structure Type | # Housing Units | % Housing Units |
| Single Unit, Detached | 2,210 | 60.7% |
| Single Unit, Attached | 101 | 2.8% |
| 2 Unit Apartments | 338 | 9.3% |
| 3 or 4 Unit Apartments | 203 | 5.6% |
| 5 to 9 Unit Apartments | 138 | 3.8% |
| 10 or more Apartments | 133 | 3.6% |
| Mobile Home / Other | 520 | 14.3% |
| Total | 3,643 | 100.0% |
Housing Structures by Occupancy in Winnemucca
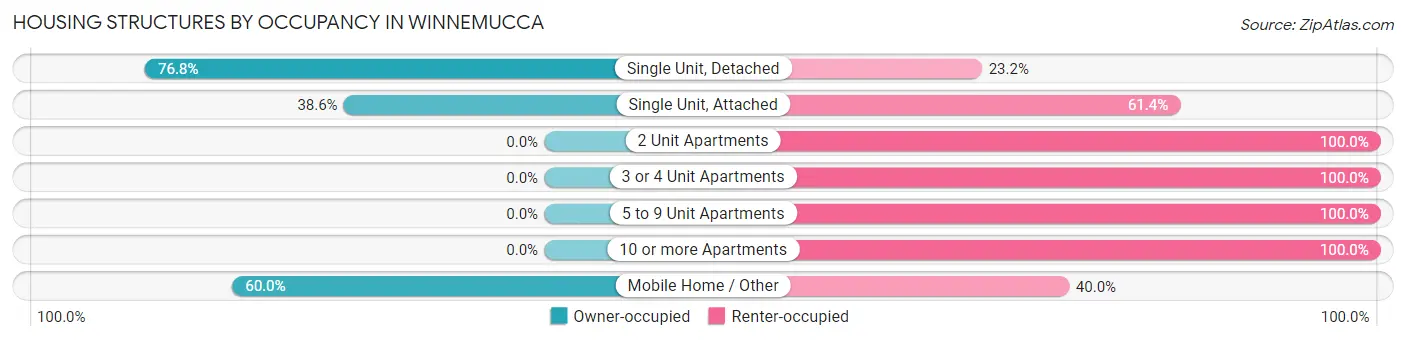
| Structure Type | Owner-occupied | Renter-occupied |
| Single Unit, Detached | 1,697 (76.8%) | 513 (23.2%) |
| Single Unit, Attached | 39 (38.6%) | 62 (61.4%) |
| 2 Unit Apartments | 0 (0.0%) | 338 (100.0%) |
| 3 or 4 Unit Apartments | 0 (0.0%) | 203 (100.0%) |
| 5 to 9 Unit Apartments | 0 (0.0%) | 138 (100.0%) |
| 10 or more Apartments | 0 (0.0%) | 133 (100.0%) |
| Mobile Home / Other | 312 (60.0%) | 208 (40.0%) |
| Total | 2,048 (56.2%) | 1,595 (43.8%) |
Housing Structures by Number of Rooms in Winnemucca
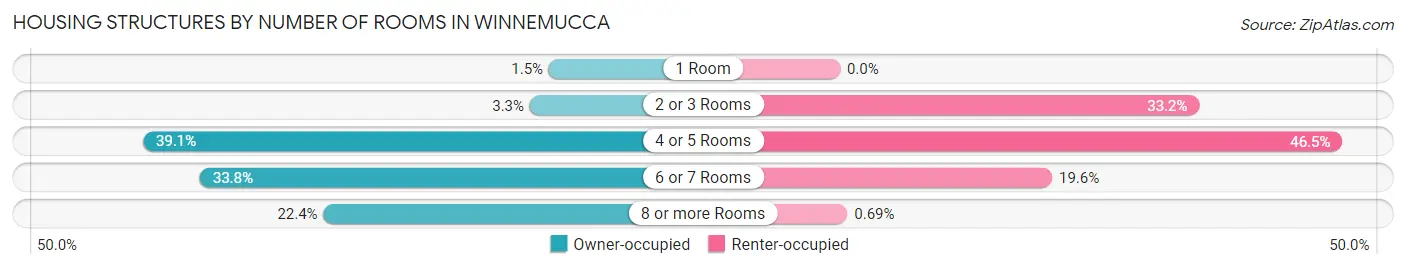
| Number of Rooms | Owner-occupied | Renter-occupied |
| 1 Room | 31 (1.5%) | 0 (0.0%) |
| 2 or 3 Rooms | 67 (3.3%) | 530 (33.2%) |
| 4 or 5 Rooms | 800 (39.1%) | 741 (46.5%) |
| 6 or 7 Rooms | 692 (33.8%) | 313 (19.6%) |
| 8 or more Rooms | 458 (22.4%) | 11 (0.7%) |
| Total | 2,048 (100.0%) | 1,595 (100.0%) |
Housing Structure by Heating Type in Winnemucca
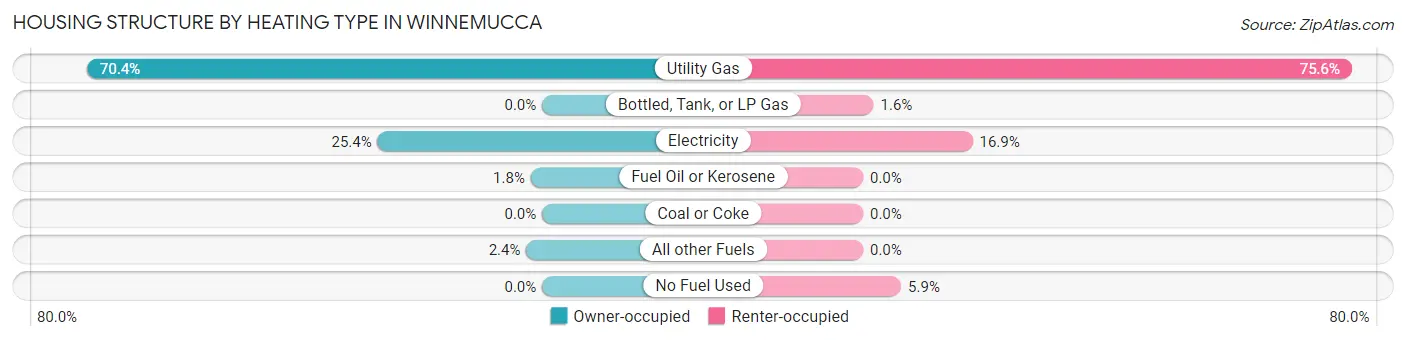
| Heating Type | Owner-occupied | Renter-occupied |
| Utility Gas | 1,441 (70.4%) | 1,205 (75.5%) |
| Bottled, Tank, or LP Gas | 0 (0.0%) | 26 (1.6%) |
| Electricity | 521 (25.4%) | 270 (16.9%) |
| Fuel Oil or Kerosene | 36 (1.8%) | 0 (0.0%) |
| Coal or Coke | 0 (0.0%) | 0 (0.0%) |
| All other Fuels | 50 (2.4%) | 0 (0.0%) |
| No Fuel Used | 0 (0.0%) | 94 (5.9%) |
| Total | 2,048 (100.0%) | 1,595 (100.0%) |
Household Vehicle Usage in Winnemucca
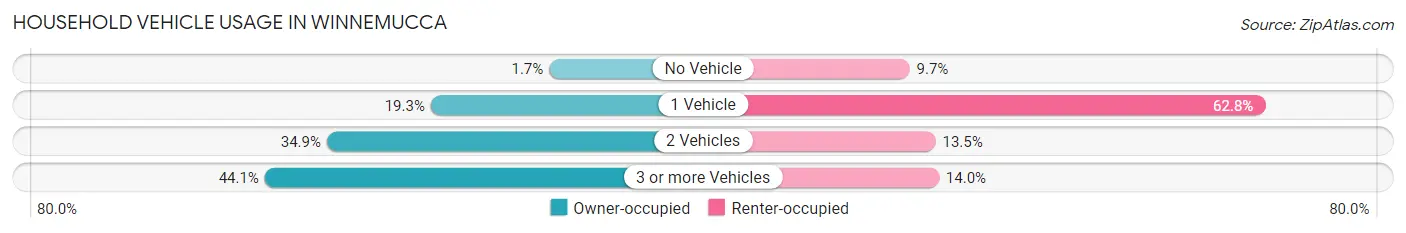
| Vehicles per Household | Owner-occupied | Renter-occupied |
| No Vehicle | 34 (1.7%) | 154 (9.7%) |
| 1 Vehicle | 396 (19.3%) | 1,001 (62.8%) |
| 2 Vehicles | 714 (34.9%) | 216 (13.5%) |
| 3 or more Vehicles | 904 (44.1%) | 224 (14.0%) |
| Total | 2,048 (100.0%) | 1,595 (100.0%) |
Real Estate & Mortgages in Winnemucca
Real Estate and Mortgage Overview in Winnemucca
| Characteristic | Without Mortgage | With Mortgage |
| Housing Units | 830 | 1,218 |
| Median Property Value | $250,000 | $291,300 |
| Median Household Income | $58,750 | $547 |
| Monthly Housing Costs | $408 | $93 |
| Real Estate Taxes | $1,372 | $109 |
Property Value by Mortgage Status in Winnemucca
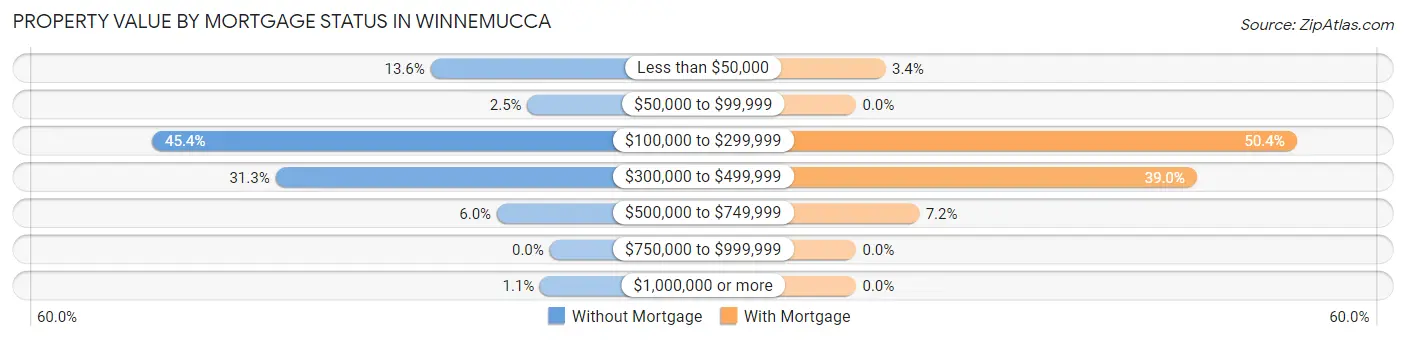
| Property Value | Without Mortgage | With Mortgage |
| Less than $50,000 | 113 (13.6%) | 41 (3.4%) |
| $50,000 to $99,999 | 21 (2.5%) | 0 (0.0%) |
| $100,000 to $299,999 | 377 (45.4%) | 614 (50.4%) |
| $300,000 to $499,999 | 260 (31.3%) | 475 (39.0%) |
| $500,000 to $749,999 | 50 (6.0%) | 88 (7.2%) |
| $750,000 to $999,999 | 0 (0.0%) | 0 (0.0%) |
| $1,000,000 or more | 9 (1.1%) | 0 (0.0%) |
| Total | 830 (100.0%) | 1,218 (100.0%) |
Household Income by Mortgage Status in Winnemucca
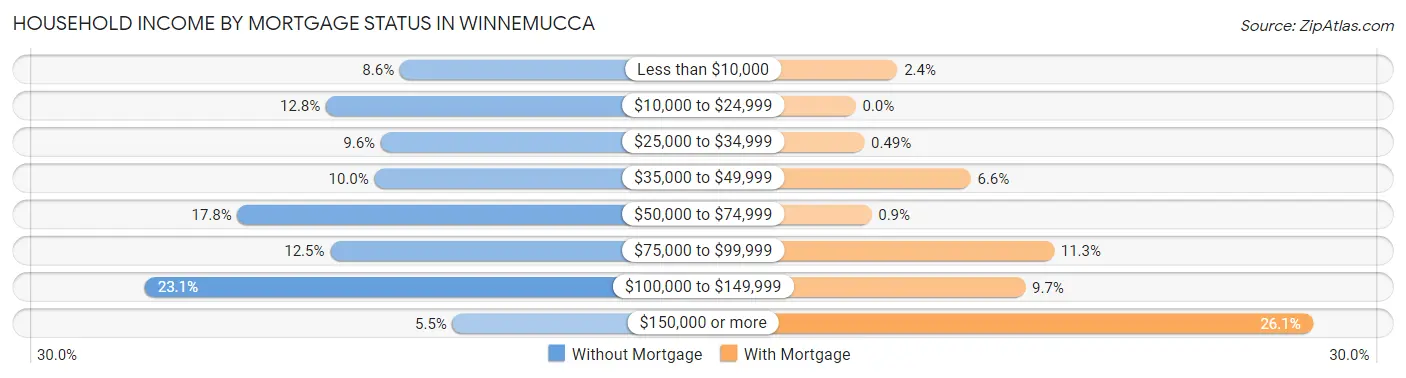
| Household Income | Without Mortgage | With Mortgage |
| Less than $10,000 | 71 (8.6%) | 29 (2.4%) |
| $10,000 to $24,999 | 106 (12.8%) | 0 (0.0%) |
| $25,000 to $34,999 | 80 (9.6%) | 6 (0.5%) |
| $35,000 to $49,999 | 83 (10.0%) | 80 (6.6%) |
| $50,000 to $74,999 | 148 (17.8%) | 11 (0.9%) |
| $75,000 to $99,999 | 104 (12.5%) | 138 (11.3%) |
| $100,000 to $149,999 | 192 (23.1%) | 118 (9.7%) |
| $150,000 or more | 46 (5.5%) | 318 (26.1%) |
| Total | 830 (100.0%) | 1,218 (100.0%) |
Property Value to Household Income Ratio in Winnemucca
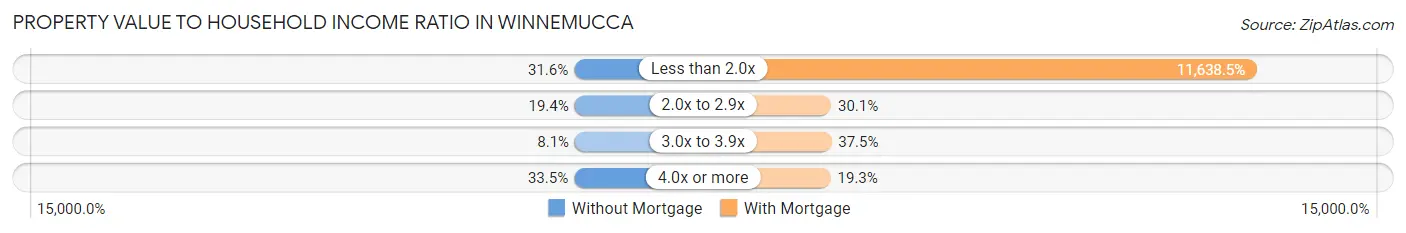
| Value-to-Income Ratio | Without Mortgage | With Mortgage |
| Less than 2.0x | 262 (31.6%) | 141,757 (11,638.5%) |
| 2.0x to 2.9x | 161 (19.4%) | 367 (30.1%) |
| 3.0x to 3.9x | 67 (8.1%) | 457 (37.5%) |
| 4.0x or more | 278 (33.5%) | 235 (19.3%) |
| Total | 830 (100.0%) | 1,218 (100.0%) |
Real Estate Taxes by Mortgage Status in Winnemucca
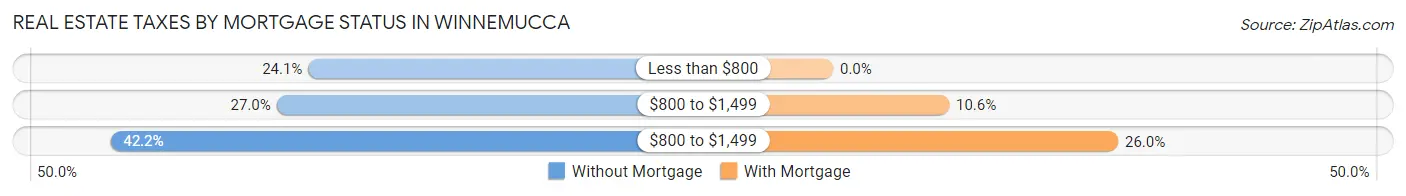
| Property Taxes | Without Mortgage | With Mortgage |
| Less than $800 | 200 (24.1%) | 0 (0.0%) |
| $800 to $1,499 | 224 (27.0%) | 129 (10.6%) |
| $800 to $1,499 | 350 (42.2%) | 317 (26.0%) |
| Total | 830 (100.0%) | 1,218 (100.0%) |
Health & Disability in Winnemucca
Health Insurance Coverage by Age in Winnemucca
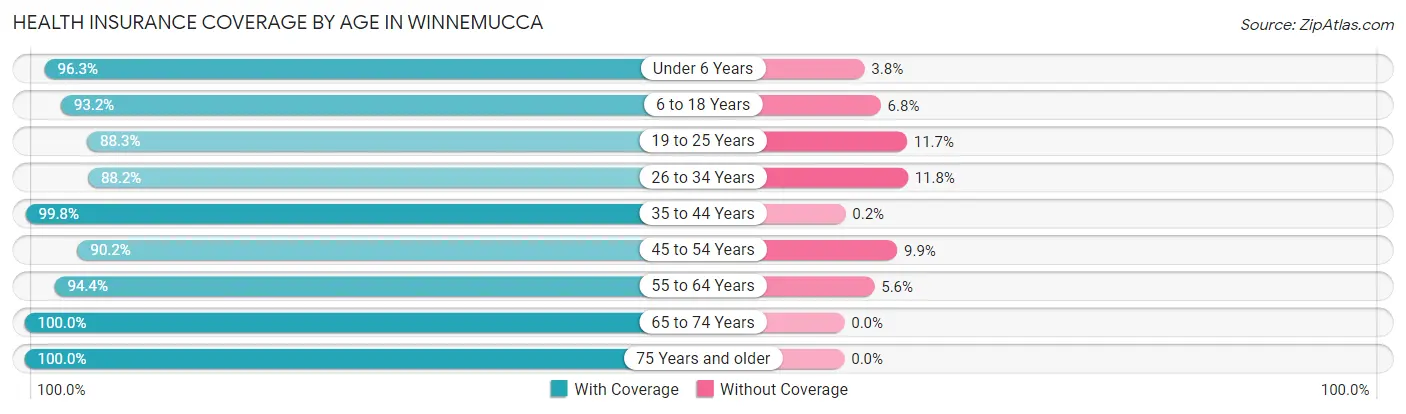
| Age Bracket | With Coverage | Without Coverage |
| Under 6 Years | 642 (96.3%) | 25 (3.7%) |
| 6 to 18 Years | 1,567 (93.2%) | 114 (6.8%) |
| 19 to 25 Years | 644 (88.3%) | 85 (11.7%) |
| 26 to 34 Years | 1,044 (88.2%) | 140 (11.8%) |
| 35 to 44 Years | 1,023 (99.8%) | 2 (0.2%) |
| 45 to 54 Years | 760 (90.1%) | 83 (9.9%) |
| 55 to 64 Years | 862 (94.4%) | 51 (5.6%) |
| 65 to 74 Years | 705 (100.0%) | 0 (0.0%) |
| 75 Years and older | 535 (100.0%) | 0 (0.0%) |
| Total | 7,782 (94.0%) | 500 (6.0%) |
Health Insurance Coverage by Citizenship Status in Winnemucca
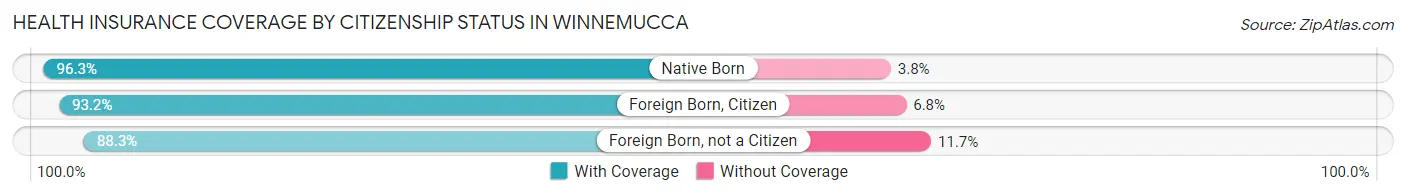
| Citizenship Status | With Coverage | Without Coverage |
| Native Born | 642 (96.3%) | 25 (3.7%) |
| Foreign Born, Citizen | 1,567 (93.2%) | 114 (6.8%) |
| Foreign Born, not a Citizen | 644 (88.3%) | 85 (11.7%) |
Health Insurance Coverage by Household Income in Winnemucca
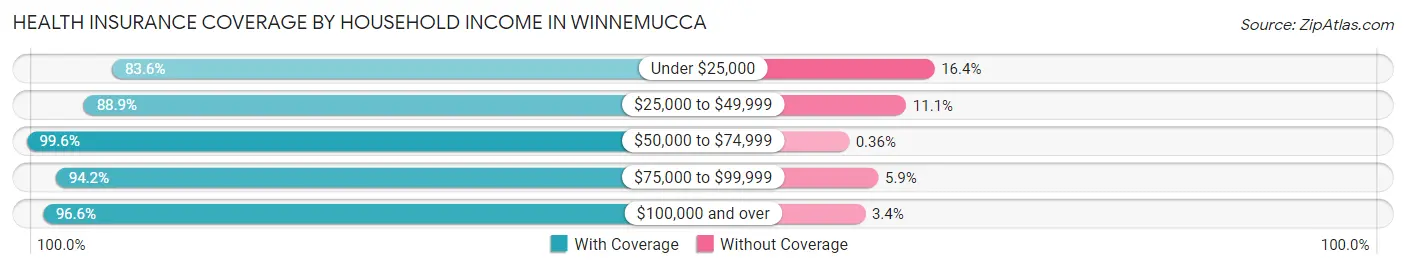
| Household Income | With Coverage | Without Coverage |
| Under $25,000 | 781 (83.6%) | 153 (16.4%) |
| $25,000 to $49,999 | 1,132 (88.9%) | 141 (11.1%) |
| $50,000 to $74,999 | 841 (99.6%) | 3 (0.4%) |
| $75,000 to $99,999 | 966 (94.2%) | 60 (5.9%) |
| $100,000 and over | 4,060 (96.6%) | 143 (3.4%) |
Public vs Private Health Insurance Coverage by Age in Winnemucca
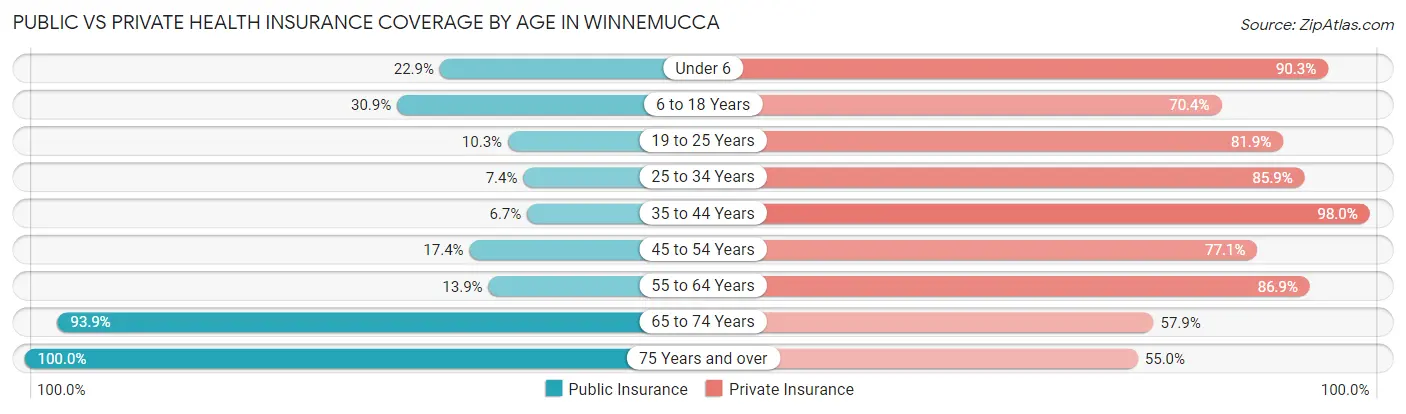
| Age Bracket | Public Insurance | Private Insurance |
| Under 6 | 153 (22.9%) | 602 (90.2%) |
| 6 to 18 Years | 519 (30.9%) | 1,184 (70.4%) |
| 19 to 25 Years | 75 (10.3%) | 597 (81.9%) |
| 25 to 34 Years | 88 (7.4%) | 1,017 (85.9%) |
| 35 to 44 Years | 69 (6.7%) | 1,004 (98.0%) |
| 45 to 54 Years | 147 (17.4%) | 650 (77.1%) |
| 55 to 64 Years | 127 (13.9%) | 793 (86.9%) |
| 65 to 74 Years | 662 (93.9%) | 408 (57.9%) |
| 75 Years and over | 535 (100.0%) | 294 (54.9%) |
| Total | 2,375 (28.7%) | 6,549 (79.1%) |
Disability Status by Sex by Age in Winnemucca
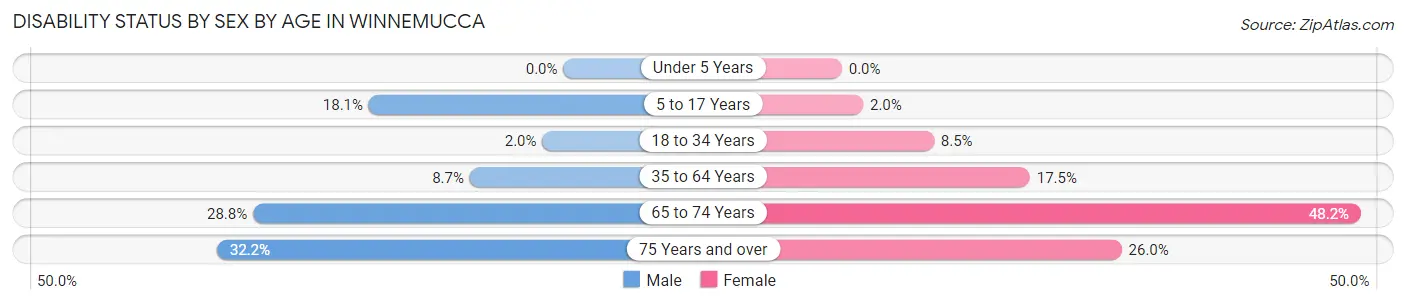
| Age Bracket | Male | Female |
| Under 5 Years | 0 (0.0%) | 0 (0.0%) |
| 5 to 17 Years | 176 (18.0%) | 15 (2.0%) |
| 18 to 34 Years | 21 (1.9%) | 79 (8.5%) |
| 35 to 64 Years | 136 (8.7%) | 212 (17.4%) |
| 65 to 74 Years | 108 (28.8%) | 159 (48.2%) |
| 75 Years and over | 73 (32.2%) | 80 (26.0%) |
Disability Class by Sex by Age in Winnemucca
Disability Class: Hearing Difficulty
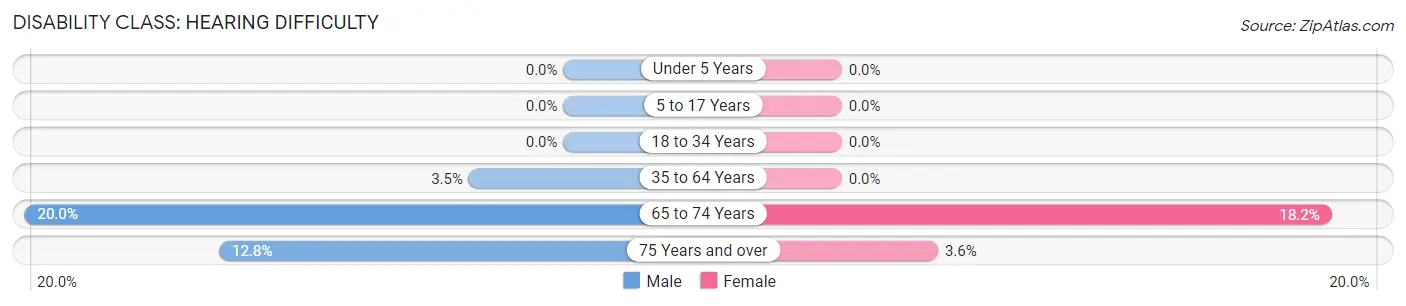
| Age Bracket | Male | Female |
| Under 5 Years | 0 (0.0%) | 0 (0.0%) |
| 5 to 17 Years | 0 (0.0%) | 0 (0.0%) |
| 18 to 34 Years | 0 (0.0%) | 0 (0.0%) |
| 35 to 64 Years | 55 (3.5%) | 0 (0.0%) |
| 65 to 74 Years | 75 (20.0%) | 60 (18.2%) |
| 75 Years and over | 29 (12.8%) | 11 (3.6%) |
Disability Class: Vision Difficulty
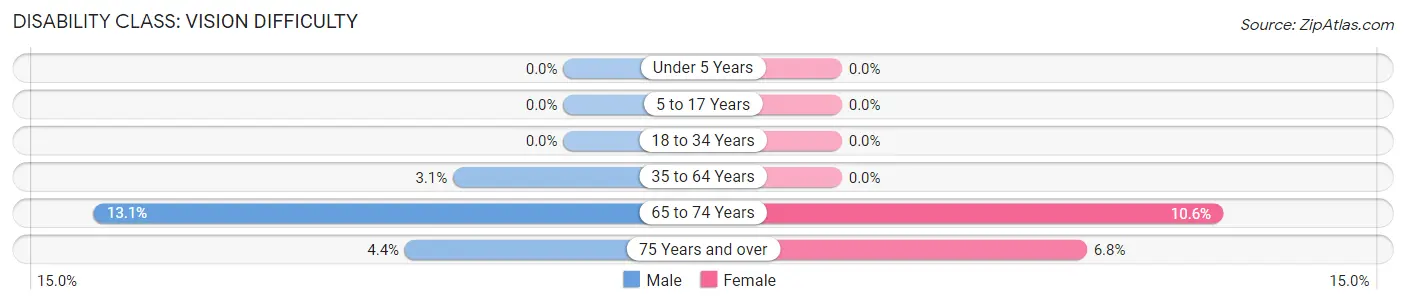
| Age Bracket | Male | Female |
| Under 5 Years | 0 (0.0%) | 0 (0.0%) |
| 5 to 17 Years | 0 (0.0%) | 0 (0.0%) |
| 18 to 34 Years | 0 (0.0%) | 0 (0.0%) |
| 35 to 64 Years | 48 (3.1%) | 0 (0.0%) |
| 65 to 74 Years | 49 (13.1%) | 35 (10.6%) |
| 75 Years and over | 10 (4.4%) | 21 (6.8%) |
Disability Class: Cognitive Difficulty
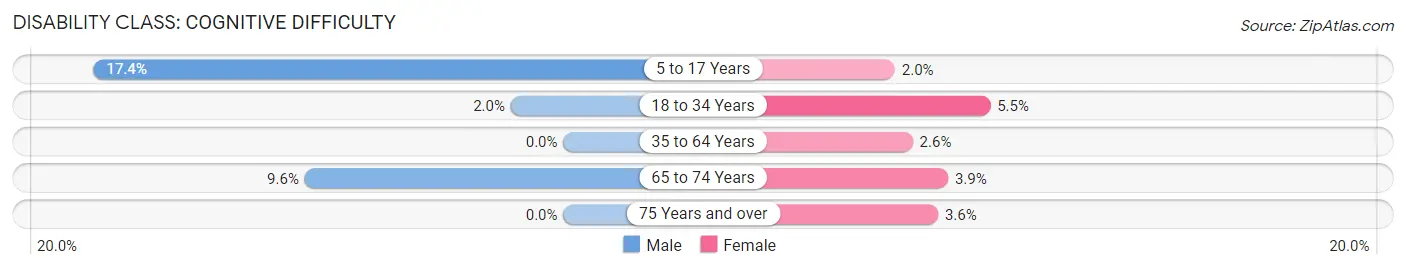
| Age Bracket | Male | Female |
| 5 to 17 Years | 170 (17.4%) | 15 (2.0%) |
| 18 to 34 Years | 21 (1.9%) | 51 (5.5%) |
| 35 to 64 Years | 0 (0.0%) | 32 (2.6%) |
| 65 to 74 Years | 36 (9.6%) | 13 (3.9%) |
| 75 Years and over | 0 (0.0%) | 11 (3.6%) |
Disability Class: Ambulatory Difficulty
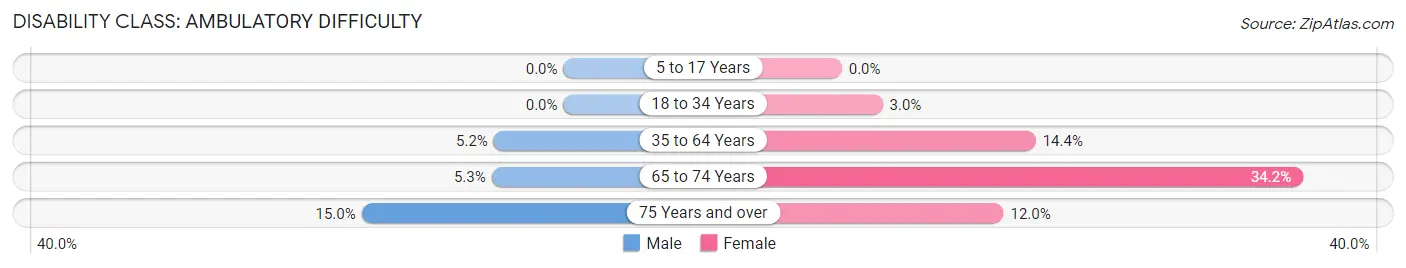
| Age Bracket | Male | Female |
| 5 to 17 Years | 0 (0.0%) | 0 (0.0%) |
| 18 to 34 Years | 0 (0.0%) | 28 (3.0%) |
| 35 to 64 Years | 81 (5.2%) | 175 (14.4%) |
| 65 to 74 Years | 20 (5.3%) | 113 (34.2%) |
| 75 Years and over | 34 (15.0%) | 37 (12.0%) |
Disability Class: Self-Care Difficulty
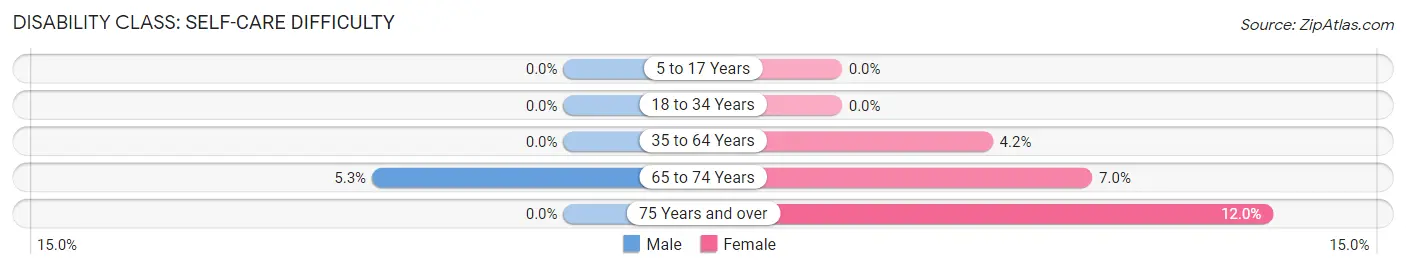
| Age Bracket | Male | Female |
| 5 to 17 Years | 0 (0.0%) | 0 (0.0%) |
| 18 to 34 Years | 0 (0.0%) | 0 (0.0%) |
| 35 to 64 Years | 0 (0.0%) | 51 (4.2%) |
| 65 to 74 Years | 20 (5.3%) | 23 (7.0%) |
| 75 Years and over | 0 (0.0%) | 37 (12.0%) |
Technology Access in Winnemucca
Computing Device Access in Winnemucca
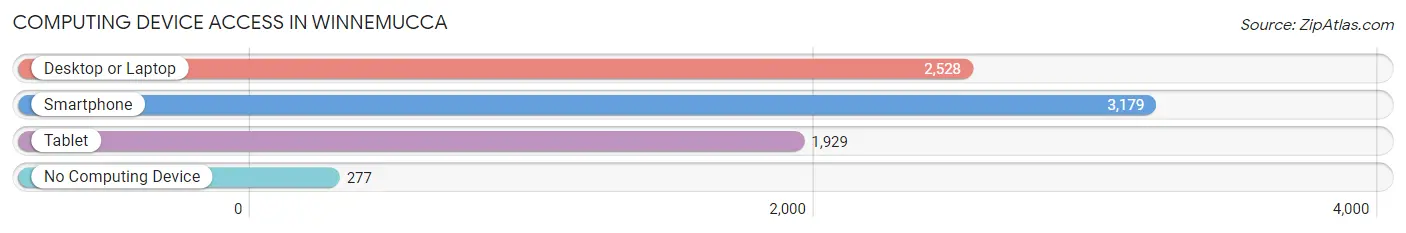
| Device Type | # Households | % Households |
| Desktop or Laptop | 2,528 | 69.4% |
| Smartphone | 3,179 | 87.3% |
| Tablet | 1,929 | 52.9% |
| No Computing Device | 277 | 7.6% |
| Total | 3,643 | 100.0% |
Internet Access in Winnemucca
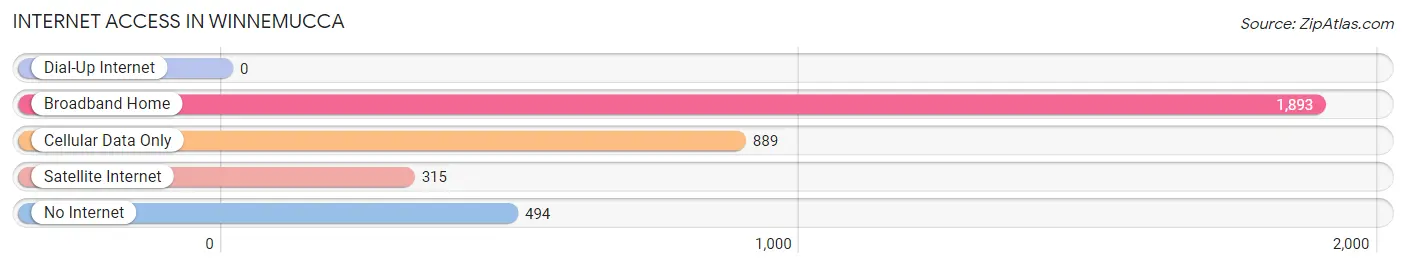
| Internet Type | # Households | % Households |
| Dial-Up Internet | 0 | 0.0% |
| Broadband Home | 1,893 | 52.0% |
| Cellular Data Only | 889 | 24.4% |
| Satellite Internet | 315 | 8.6% |
| No Internet | 494 | 13.6% |
| Total | 3,643 | 100.0% |
Winnemucca Summary
Winnemucca is a city located in Humboldt County, Nevada, United States. It is the county seat of Humboldt County and the principal city of the Winnemucca Micropolitan Statistical Area, which includes all of Humboldt County. The population was 7,396 at the 2010 census, up from 5,400 at the 2000 census.
History
The area around Winnemucca was inhabited by the Northern Paiute and Shoshone tribes for centuries before the arrival of European settlers. The first European to visit the area was John C. Fremont, who passed through in 1843. The first permanent settlement was established in 1868 by the Central Pacific Railroad, which built a station at the present site of Winnemucca. The city was named after the 19th-century Paiute chief Winnemucca, who had befriended the early settlers and lived in the area.
Geography
Winnemucca is located in the Humboldt Valley of northern Nevada, at the intersection of Interstate 80 and U.S. Route 95. It is about 90 miles east of Reno and about 200 miles northeast of Sacramento, California. According to the United States Census Bureau, the city has a total area of 8.3 square miles, all of it land.
Economy
Winnemucca's economy is largely based on mining, ranching, and tourism. The city is a major hub for trucking and freight transportation, and is home to several large truck stops. The city is also a popular stop for travelers on Interstate 80, and is home to several hotels and casinos.
Demographics
As of the census of 2000, there were 5,400 people, 2,068 households, and 1,372 families residing in the city. The population density was 651.2 people per square mile (251.3/km2). There were 2,338 housing units at an average density of 283.2 per square mile (109.4/km2). The racial makeup of the city was 81.2% White, 0.7% African American, 5.2% Native American, 0.7% Asian, 0.1% Pacific Islander, 9.2% from other races, and 3.0% from two or more races. Hispanic or Latino of any race were 19.2% of the population.
There were 2,068 households, out of which 33.2% had children under the age of 18 living with them, 48.2% were married couples living together, 12.3% had a female householder with no husband present, and 33.7% were non-families. 28.2% of all households were made up of individuals, and 11.2% had someone living alone who was 65 years of age or older. The average household size was 2.60 and the average family size was 3.17.
In the city, the population was spread out, with 28.7% under the age of 18, 8.7% from 18 to 24, 27.2% from 25 to 44, 22.2% from 45 to 64, and 13.2% who were 65 years of age or older. The median age was 35 years. For every 100 females, there were 103.2 males. For every 100 females age 18 and over, there were 101.2 males.
The median income for a household in the city was $35,938, and the median income for a family was $41,944. Males had a median income of $35,938 versus $21,875 for females. The per capita income for the city was $17,845. About 11.2% of families and 14.2% of the population were below the poverty line, including 17.2% of those under age 18 and 8.7% of those age 65 or over.
Common Questions
What is Per Capita Income in Winnemucca?
Per Capita income in Winnemucca is $41,467.
What is the Median Family Income in Winnemucca?
Median Family Income in Winnemucca is $110,139.
What is the Median Household income in Winnemucca?
Median Household Income in Winnemucca is $78,161.
What is Income or Wage Gap in Winnemucca?
Income or Wage Gap in Winnemucca is 58.5%.
Women in Winnemucca earn 41.5 cents for every dollar earned by a man.
What is Inequality or Gini Index in Winnemucca?
Inequality or Gini Index in Winnemucca is 0.50.
What is the Total Population of Winnemucca?
Total Population of Winnemucca is 8,354.
What is the Total Male Population of Winnemucca?
Total Male Population of Winnemucca is 4,494.
What is the Total Female Population of Winnemucca?
Total Female Population of Winnemucca is 3,860.
What is the Ratio of Males per 100 Females in Winnemucca?
There are 116.42 Males per 100 Females in Winnemucca.
What is the Ratio of Females per 100 Males in Winnemucca?
There are 85.89 Females per 100 Males in Winnemucca.
What is the Median Population Age in Winnemucca?
Median Population Age in Winnemucca is 33.9 Years.
What is the Average Family Size in Winnemucca
Average Family Size in Winnemucca is 3.2 People.
What is the Average Household Size in Winnemucca
Average Household Size in Winnemucca is 2.3 People.
How Large is the Labor Force in Winnemucca?
There are 4,268 People in the Labor Forcein in Winnemucca.
What is the Percentage of People in the Labor Force in Winnemucca?
67.2% of People are in the Labor Force in Winnemucca.
What is the Unemployment Rate in Winnemucca?
Unemployment Rate in Winnemucca is 4.4%.